双重MACD趋势确认交易系统
Author: ChaoZhang, Date: 2024-07-31 11:17:05Tags: MACDEMASMA
概述
本策略是一个基于MACD指标的交易系统,结合了两个时间周期的MACD指标来进行交易决策。该策略主要使用5分钟周期的MACD指标来寻找入场机会,同时使用1小时周期的MACD指标来确认整体市场趋势。这种双重确认机制旨在提高交易的准确性和可靠性。策略还包括了固定的利润目标和止损设置,以管理风险和锁定利润。
策略原理
该策略的核心原理是利用不同时间周期的MACD指标来捕捉市场趋势和交易机会。具体来说:
5分钟MACD: 用于寻找具体的入场信号。当MACD线上穿信号线时,产生买入信号。
1小时MACD: 用于确认整体市场趋势。只有当1小时MACD柱状图为正值时,才认为市场处于上升趋势。
入场条件: 当5分钟MACD产生买入信号,且1小时MACD确认上升趋势时,策略才会执行买入操作。
风险管理: 策略设置了固定的利润目标(100点)和止损(20点)来管理每笔交易的风险。
仓位管理: 每次交易使用固定的100单位交易量。
策略优势
多周期确认: 通过结合短周期(5分钟)和长周期(1小时)的MACD指标,策略能够更全面地评估市场趋势,减少虚假信号。
趋势跟随: 策略设计遵循”顺势而为”的原则,只在确认整体趋势向上时才进行买入,提高了交易的成功率。
明确的风险管理: 固定的止盈止损设置,有助于控制每笔交易的风险,防止单笔交易造成过大损失。
自动化执行: 策略可以在交易平台上自动执行,减少人为情绪干扰,提高交易纪律性。
参数可调: 策略允许用户根据个人偏好和市场特性调整MACD参数,增加了灵活性。
策略风险
滞后性: MACD是滞后指标,在快速变化的市场中可能出现信号滞后,导致入场或出场不及时。
震荡市不适用: 在横盘震荡市场中,策略可能频繁产生假信号,导致连续亏损。
固定止损可能不足: 在高波动性市场中,20点的固定止损可能不足以应对突发性大幅波动。
仅考虑做多: 策略只设计了做多逻辑,忽略了做空机会,可能错过部分盈利机会。
参数敏感性: MACD参数的选择对策略表现影响较大,不同市场或时期可能需要不同的参数设置。
策略优化方向
动态止损: 考虑引入基于ATR或波动率的动态止损机制,以适应不同市场环境。
加入做空逻辑: 扩展策略以包含做空交易,充分利用双向市场机会。
引入量价分析: 结合成交量指标,如OBV或CMF,以增强信号的可靠性。
优化仓位管理: 考虑基于账户净值或风险评估的动态仓位管理,而非固定交易量。
增加过滤条件: 引入额外的技术指标或市场情绪指标,如RSI或VIX,以减少假信号。
回测与优化: 对不同市场和时间周期进行广泛回测,优化MACD参数和其他策略参数。
考虑基本面因素: 在重要经济数据或事件发布期间,可以设置交易限制或调整策略参数。
总结
双重MACD趋势确认交易系统是一个结合了短期和长期市场趋势分析的量化交易策略。通过利用不同时间周期的MACD指标,该策略旨在捕捉市场趋势并在趋势确立时进行交易。固定的风险管理规则和自动化执行特性使其成为一个相对稳健的交易系统。然而,如同所有交易策略一样,它也面临着一些固有的风险和局限性。
为了进一步提高策略的有效性和适应性,建议交易者考虑引入动态止损机制、扩展做空逻辑、优化仓位管理,并结合其他技术和基本面分析工具。同时,持续的回测和参数优化对于保持策略的有效性至关重要。最后,交易者应该始终牢记,没有完美的交易策略,风险管理和持续学习是长期成功的关键。
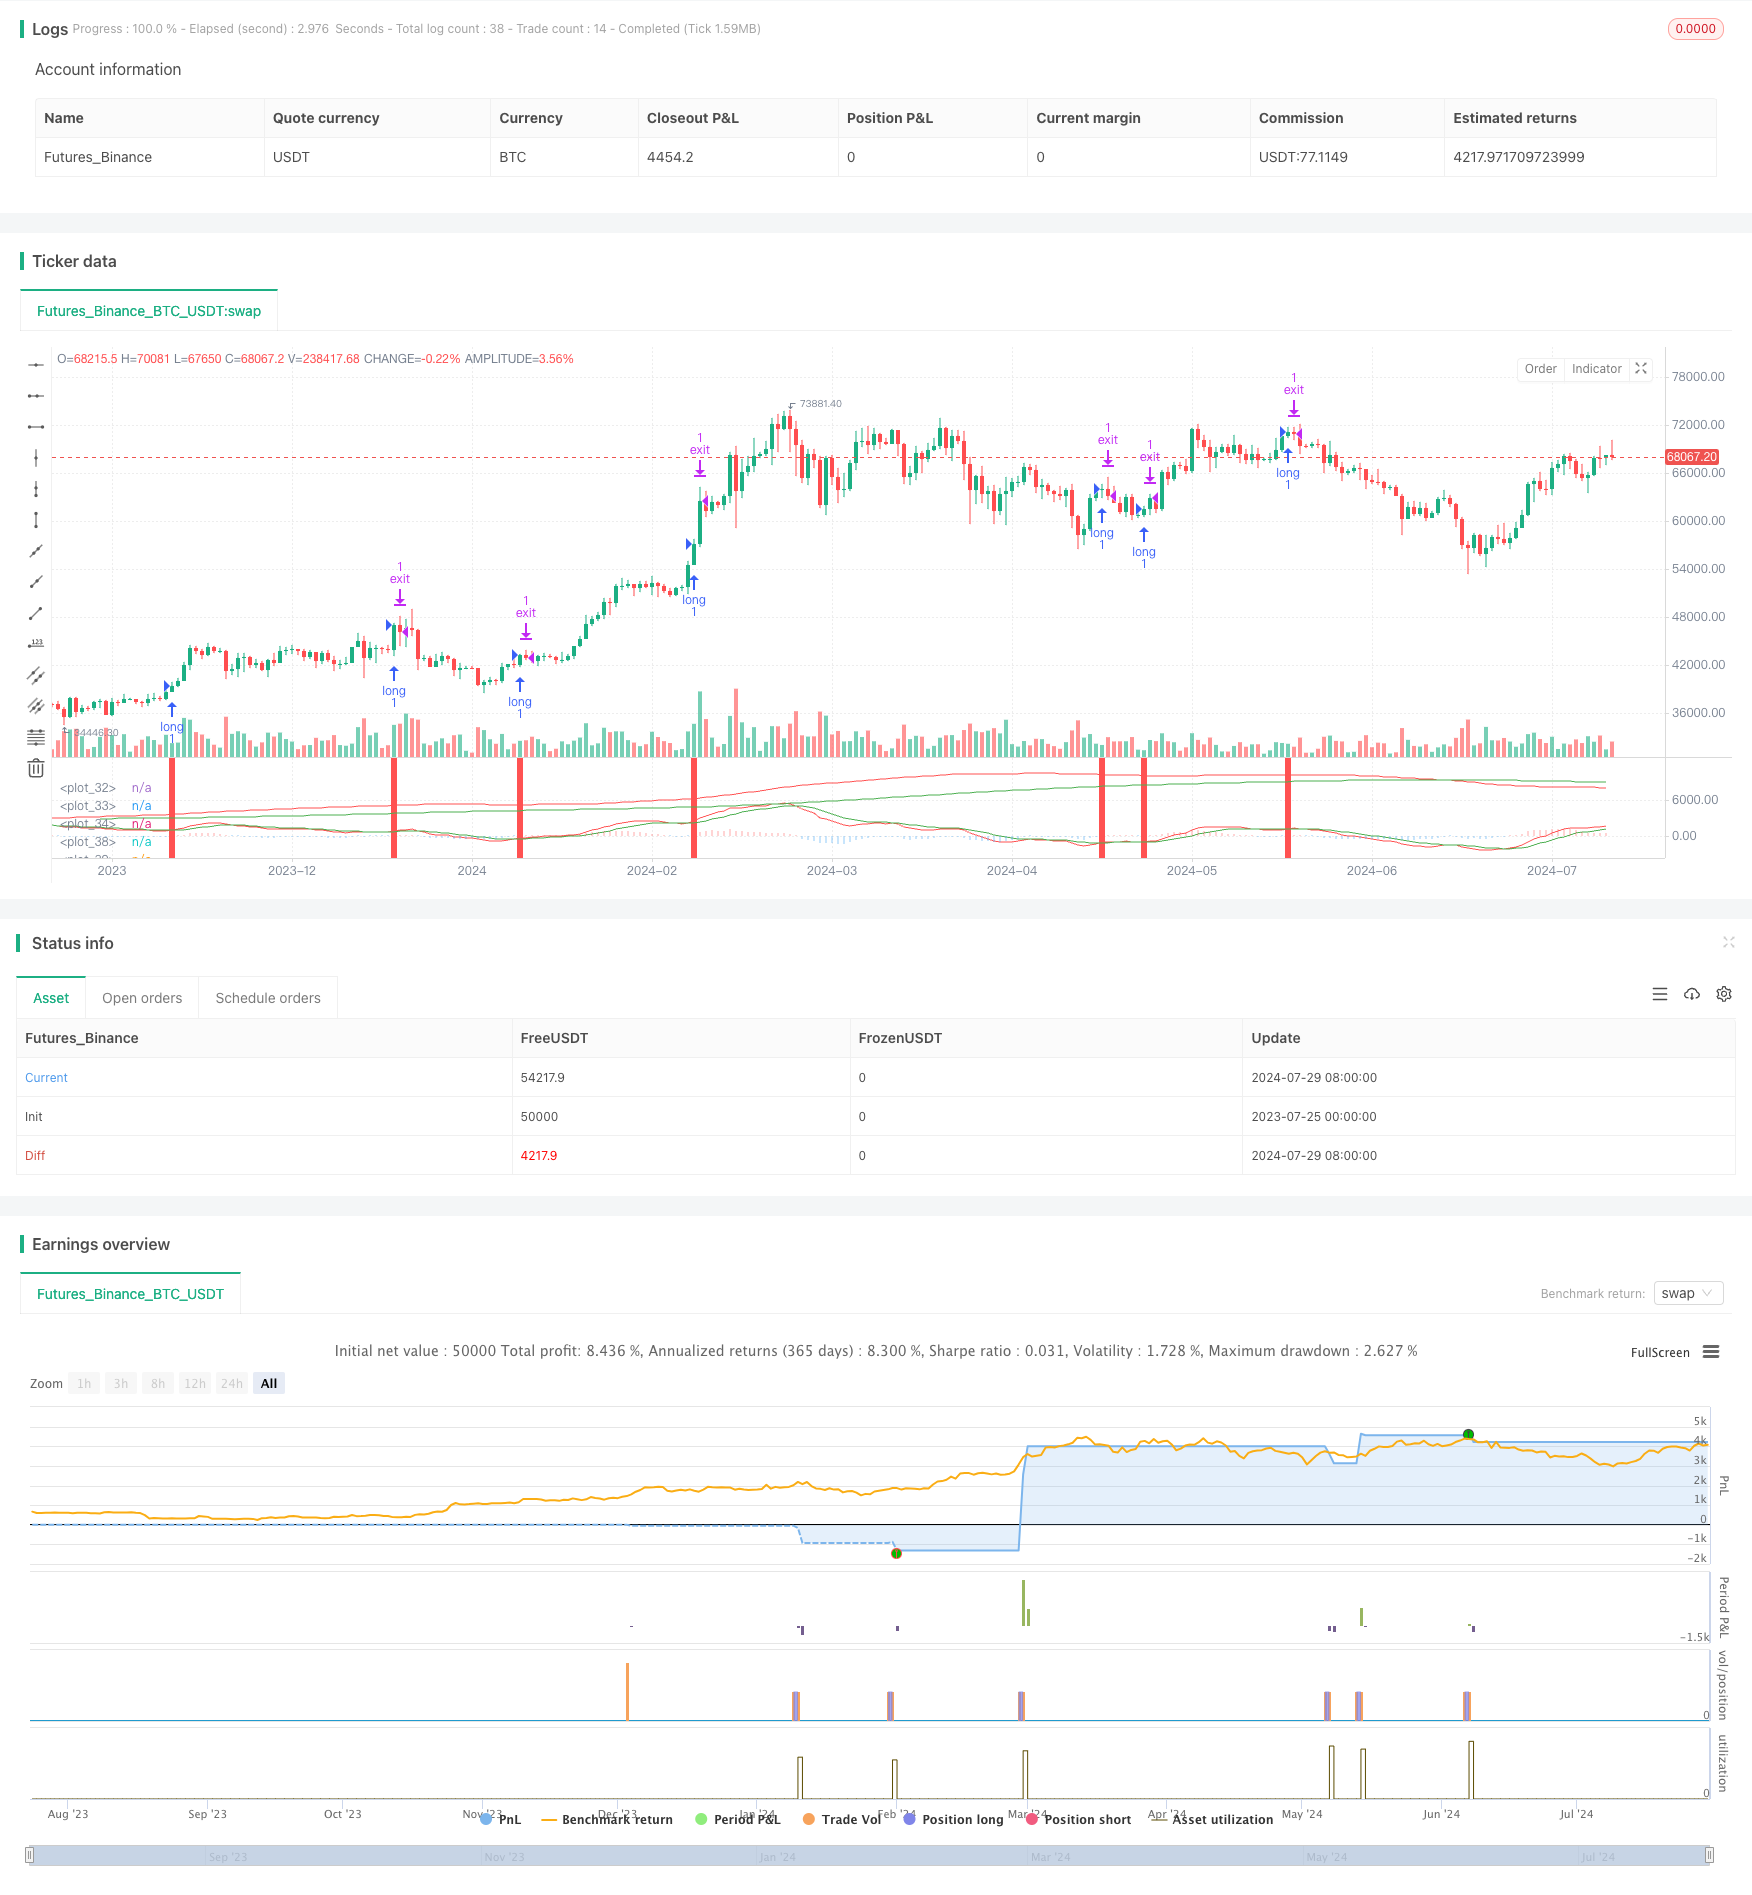
/*backtest
start: 2023-07-25 00:00:00
end: 2024-07-30 00:00:00
period: 1d
basePeriod: 1h
exchanges: [{"eid":"Futures_Binance","currency":"BTC_USDT"}]
*/

//5分足で運用想定

//@version=5
strategy(title='MACD5分IN,一時間足強弱判定', shorttitle='MACDストラテジー', overlay=false)
//overlay true:チャート上に表示 felse:別ウィンドに表示

//================
//注文ポイント
//================

//入力部を作成
//input関数で設定画面に入力項目を追加できる
//type入力形式の設定,defval初期設定値,minval最小設定値
FastLength = input.int(title='短期線本数', defval=12, minval=1)
SlowLength = input.int(title='長期線本数', defval=26, minval=1)
SignalLength = input.int(title='シグナル本数', defval=9, minval=1)

FastLength1 = input.int(title='短期線本数', defval=144, minval=1)
SlowLength1 = input.int(title='長期線本数', defval=312, minval=1)
SignalLength1 = input.int(title='シグナル本数', defval=108, minval=1)
//一時間足で強弱判定のため5分足の数字を12倍

//MACDの計算 エントリー
[MACD, MACDSignal, MACDosc] = ta.macd(close, FastLength, SlowLength, SignalLength)
//MACDの計算 強弱判定
[MACD1, MACDSignal1, MACDosc1] = ta.macd(close, FastLength1, SlowLength1, SignalLength1)

//プロット エントリー
//plot画面表示,MACD計算からMACDラインとシグナルラインを表示
//linewidthでラインの太さ変更
//style_histogramでヒストグラム表示, color = MACDosc < 0の判定式で色変更
plot(MACD, color=color.new(color.red, 0), linewidth=1)
plot(MACDSignal, color=color.new(color.green, 0))
plot(MACDosc, style=plot.style_histogram, linewidth=3, color=MACDosc < 0 ? color.new(color.blue, 50) : color.new(color.red, 50))

//プロット 相場強弱判定
//一時間足の表示作成
plot(MACD1, color=color.new(color.red, 0), linewidth=1)
plot(MACDSignal1, color=color.new(color.green, 0))

//買いポイント
//crossover(x,y)yをxが上抜け
BuyPoint_MACDGC = ta.crossover(MACD, MACDSignal)
//ヒストグラムの値がプラスの場合GC中と判定
BuyPoint_crossnow = MACDosc1 > 0
//5分足MACDGCかつ1時間足がGC中,条件は末尾にand追加で条件追加可能
BuyPoint = BuyPoint_MACDGC and BuyPoint_crossnow

//買いポイントに背景色を設定
bgcolor(BuyPoint ? color.red : color.new(color.green, 100), transp=90)

//================
//決済ポイント
//================
//100円抜いたらOUT,20円下がったら損切
ProfitDelta = 100
LossDelta = 20

//================
//枚数
//================
Size = 1

//================
//注文・決済
//================
//strategy.entryでエントリー,qtyでサイズ指定,
//エントリータイミング今回は46行目BuyPoint = BuyPoint_MACDGC and BuyPoint_crossnow
if BuyPoint
    strategy.entry(id='long', direction=strategy.long, qty=Size)
//profit利確までの幅,loss損切までの幅(stopというので移動平均線に到達したらなどの損切設定なども可能)
strategy.exit(id='exit', from_entry='long', profit=ProfitDelta, loss=LossDelta)
- MACD双转换零滞后交易策略-基于短期趋势捕捉的高频交易
- CM MACD Custom Indicator - Multiple Time Frame - V2
- K's Reversal Indicator I
- ZeroLag MACD 多空策略
- 均线交叉+MACD慢线动量策略
- MACD BB 波段突破策略
- MACD与马丁策略结合的多头优化交易策略
- 双均线MACD交叉日期可调节量化交易策略
- MACD多区间动态止盈止损交易系统
- MACD动态波动交叉预测策略
- 双均线趋势捕捉策略结合动态止损和过滤器
- 多指标趋势跟踪与成交量确认策略
- 双均线交叉带止盈止损的自适应量化交易策略
- 基于艾略特波浪与汤姆·德马克顺势交易策略
- 基于量化动量和收敛发散的多时间框架统一策略
- RSI超卖定期投资策略与冷却期优化
- HMA优化多周期量化交易策略与动态止损结合
- 布林带交叉与滑点价格影响组合策略
- 趋势结构突破与订单块公平价值缺口策略
- SMA交叉与成交量过滤的自适应动态止盈止损策略
- 高低突破策略结合Alpha趋势和移动平均线过滤
- 多重蜡烛图形识别与交易策略
- 多重指数移动平均线交叉策略
- 动量驱动型均线-RSI交叉策略
- 多指标综合型动态交易策略
- 多重指标智能金字塔策略
- 多重指数移动平均线交叉动量策略
- 多重订单突破趋势跟踪策略
- 多重均线交叉与时间间隔整合策略
- 双均线交叉确认策略与量价结合优化模型