概述
这个策略是一个结合了趋势跟踪、结构突破、订单块和公平价值缺口概念的综合交易系统。它使用快速和慢速移动平均线来确定市场趋势,同时寻找价格结构的突破点。此外,策略还识别重要的订单块和公平价值缺口,这些都是潜在的支撑和阻力区域。通过整合这些技术分析概念,该策略旨在捕捉强劲的市场走势,同时在关键价格水平提供额外的交易信号。
策略原理
趋势识别:使用9周期和21周期简单移动平均线(SMA)来确定市场趋势。当快速SMA高于慢速SMA时,被视为牛市趋势;反之则为熊市趋势。
结构突破(BOS):策略跟踪10个周期内的最高高点和最低低点。当价格突破这些水平时,被认为是结构突破,并用标签标记出来。
订单块:在结构突破发生时,策略识别潜在的订单块。这些区域被视为重要的供需区域,可能会在未来充当支撑或阻力。
公平价值缺口(FVG):当价格快速突破时,策略会识别潜在的公平价值缺口。这些缺口被认为是市场可能回填的区域。
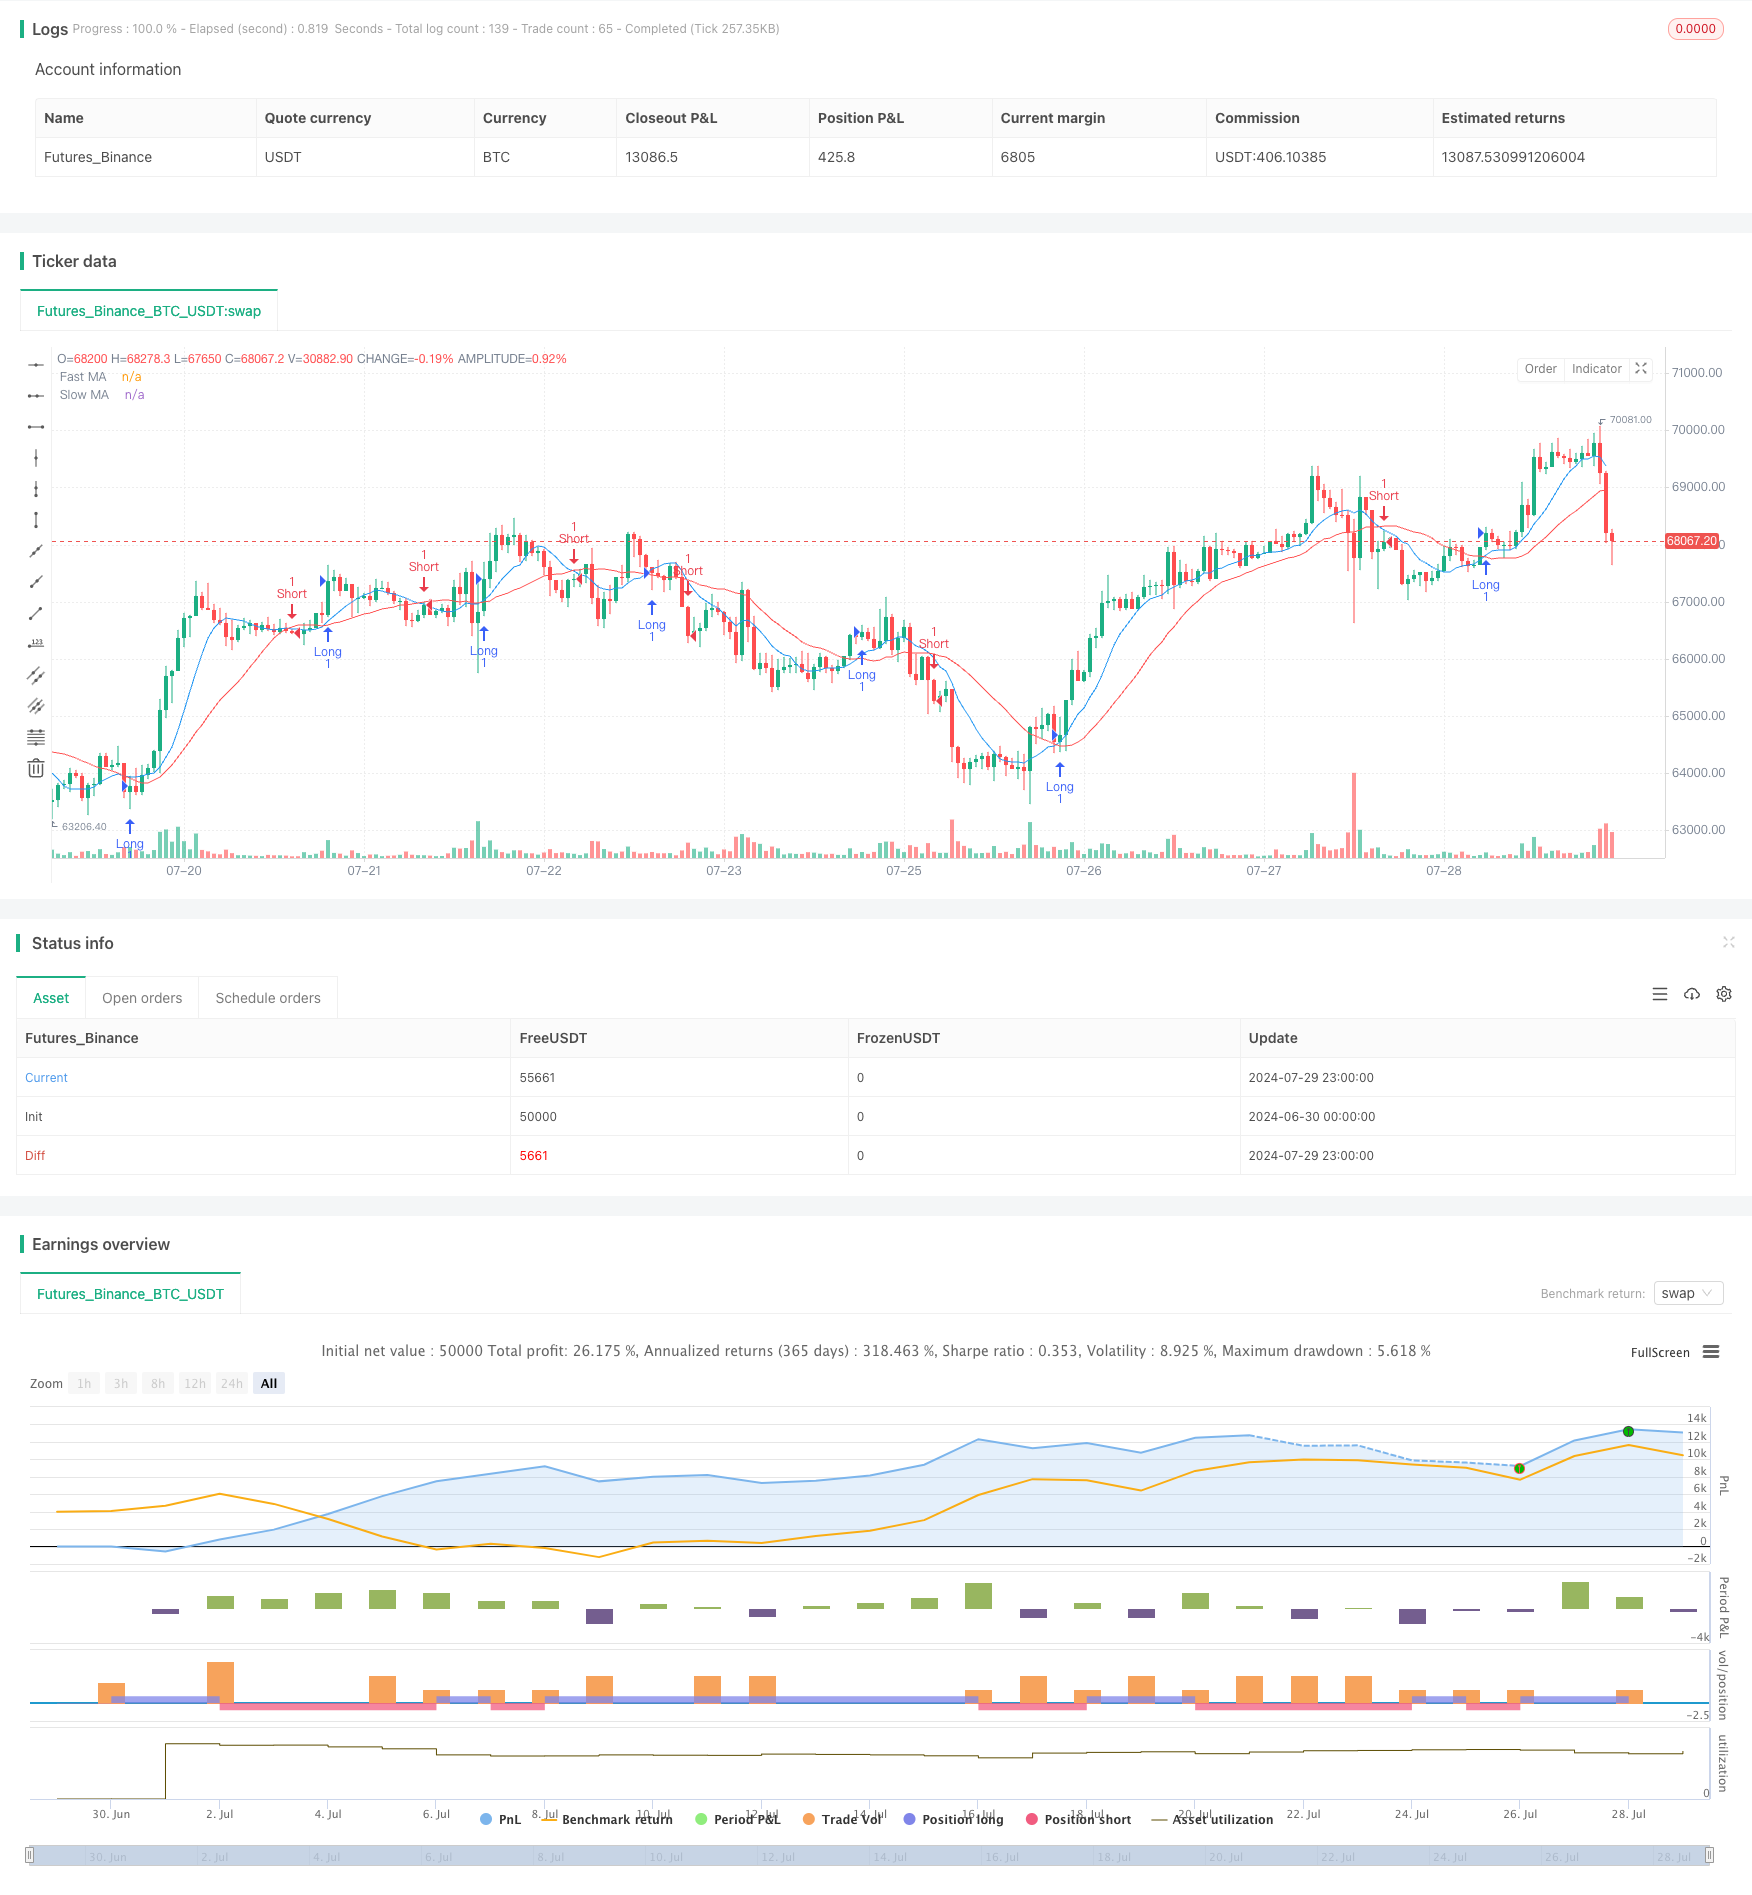
入场信号:策略使用快速和慢速移动平均线的交叉来生成入场信号。当快速MA上穿慢速MA时,触发做多信号;当快速MA下穿慢速MA时,触发做空信号。
策略优势
多维度分析:该策略结合了多个技术分析概念,提供了更全面的市场视角,有助于做出更明智的交易决策。
趋势跟踪与反转:通过结合移动平均线和结构突破,策略既能跟随主要趋势,又能捕捉潜在的反转机会。
关键价格水平识别:订单块和公平价值缺口的概念帮助交易者识别重要的支撑和阻力水平,这些水平可能影响未来价格走势。
视觉化工具:策略使用标签、框和线条来可视化关键信息,使交易者能够快速理解市场结构。
灵活性:通过可调整的参数,如移动平均线周期和阈值,策略可以适应不同的市场条件和交易风格。
策略风险
假突破:在波动较大的市场中,可能会出现假突破,导致错误的交易信号。
滞后性:移动平均线本质上是滞后指标,可能在快速变化的市场中反应不及时。
过度依赖技术指标:仅依赖技术指标而忽视基本面分析可能导致在重要经济事件或新闻发布时做出错误决策。
参数敏感性:策略的性能可能对输入参数非常敏感,需要仔细的优化和回测。
缺乏止损机制:当前策略没有明确的止损机制,可能导致在不利行情中承受过大损失。
策略优化方向
引入动态止损:考虑添加基于ATR或近期波动性的动态止损机制,以更好地管理风险。
整合成交量分析:将成交量指标纳入策略,可以帮助确认趋势强度和突破的有效性。
优化入场时机:考虑在移动平均线交叉的基础上,增加额外的过滤条件,如RSI或MACD,以减少假信号。
回测不同时间框架:在不同的时间框架上测试策略,找出表现最佳的设置。
加入基本面过滤器:考虑整合一些基本面指标或经济日历,以避免在重要新闻发布前后进行交易。
改进订单块和FVG逻辑:可以考虑使用更复杂的算法来识别更准确的订单块和公平价值缺口。
实现部分利润获取:在达到某些利润目标时,考虑部分平仓,以锁定利润并减少回撤。
总结
“趋势结构突破与订单块公平价值缺口策略”是一个综合性的技术分析交易系统,结合了多个先进的交易概念。通过整合趋势跟踪、结构突破、订单块和公平价值缺口,该策略提供了一个全面的市场分析框架。它的优势在于多维度的市场洞察和灵活的参数设置,使其能够适应不同的市场环境。然而,像所有交易策略一样,它也面临假突破和过度依赖技术指标的风险。通过引入动态止损、整合成交量分析和优化入场逻辑等方法,该策略有潜力进一步提高其性能和稳健性。对于寻求在技术分析基础上构建全面交易系统的交易者来说,这个策略提供了一个很好的起点和框架。
/*backtest
start: 2024-06-30 00:00:00
end: 2024-07-30 00:00:00
period: 1h
basePeriod: 15m
exchanges: [{"eid":"Futures_Binance","currency":"BTC_USDT"}]
*/

//@version=5
strategy("Trend and Structure Break Strategy", overlay=true)

// Inputs for the moving averages to determine trend
fastLength = input.int(9, title="Fast MA Length")
slowLength = input.int(21, title="Slow MA Length")

// Inputs for the order block and fair value gap
orderBlockThreshold = input.float(0.1, title="Order Block Threshold (%)")
fvgThreshold = input.float(0.5, title="Fair Value Gap Threshold (%)")

// Calculate moving averages
fastMA = ta.sma(close, fastLength)
slowMA = ta.sma(close, slowLength)

// Determine trend
isBullishTrend = fastMA > slowMA
isBearishTrend = fastMA < slowMA

// Break of structure
var float highestHigh = na
var float lowestLow = na

if isBullishTrend
    highestHigh := ta.highest(high, 10)
    if close > highestHigh
        label.new(bar_index, high, "BOS Up", style=label.style_label_down, color=color.green)
if isBearishTrend
    lowestLow := ta.lowest(low, 10)
    if close < lowestLow
        label.new(bar_index, low, "BOS Down", style=label.style_label_up, color=color.red)

// Identify order block
var float orderBlockHigh = na
var float orderBlockLow = na

if isBullishTrend and close > highestHigh
    orderBlockHigh := highestHigh
    orderBlockLow := close * (1 - orderBlockThreshold / 100)
    box.new(left=bar_index - 1, right=bar_index, top=orderBlockHigh, bottom=orderBlockLow, bgcolor=color.new(color.green, 80))

if isBearishTrend and close < lowestLow
    orderBlockLow := lowestLow
    orderBlockHigh := close * (1 + orderBlockThreshold / 100)
    box.new(left=bar_index - 1, right=bar_index, top=orderBlockHigh, bottom=orderBlockLow, bgcolor=color.new(color.red, 80))

// Identify fair value gap
var line fvgLine1 = na
var line fvgLine2 = na
var line fvgLine3 = na

if isBullishTrend and ta.crossover(close, highestHigh)
    fvgLine1 := line.new(x1=bar_index, y1=high, x2=bar_index + 1, y2=high, color=color.blue)
    fvgLine2 := line.new(x1=bar_index, y1=high * (1 - fvgThreshold / 100), x2=bar_index + 1, y2=high * (1 - fvgThreshold / 100), color=color.blue)
    fvgLine3 := line.new(x1=bar_index, y1=high * (1 - fvgThreshold / 100 * 2), x2=bar_index + 1, y2=high * (1 - fvgThreshold / 100 * 2), color=color.blue)

if isBearishTrend and ta.crossunder(close, lowestLow)
    fvgLine1 := line.new(x1=bar_index, y1=low, x2=bar_index + 1, y2=low, color=color.blue)
    fvgLine2 := line.new(x1=bar_index, y1=low * (1 + fvgThreshold / 100), x2=bar_index + 1, y2=low * (1 + fvgThreshold / 100), color=color.blue)
    fvgLine3 := line.new(x1=bar_index, y1=low * (1 + fvgThreshold / 100 * 2), x2=bar_index + 1, y2=low * (1 + fvgThreshold / 100 * 2), color=color.blue)

// Entry and exit signals
if (ta.crossover(fastMA, slowMA))
    strategy.entry("Long", strategy.long)

if (ta.crossunder(fastMA, slowMA))
    strategy.entry("Short", strategy.short)

// Plot moving averages
plot(fastMA, color=color.blue, title="Fast MA")
plot(slowMA, color=color.red, title="Slow MA")