概述
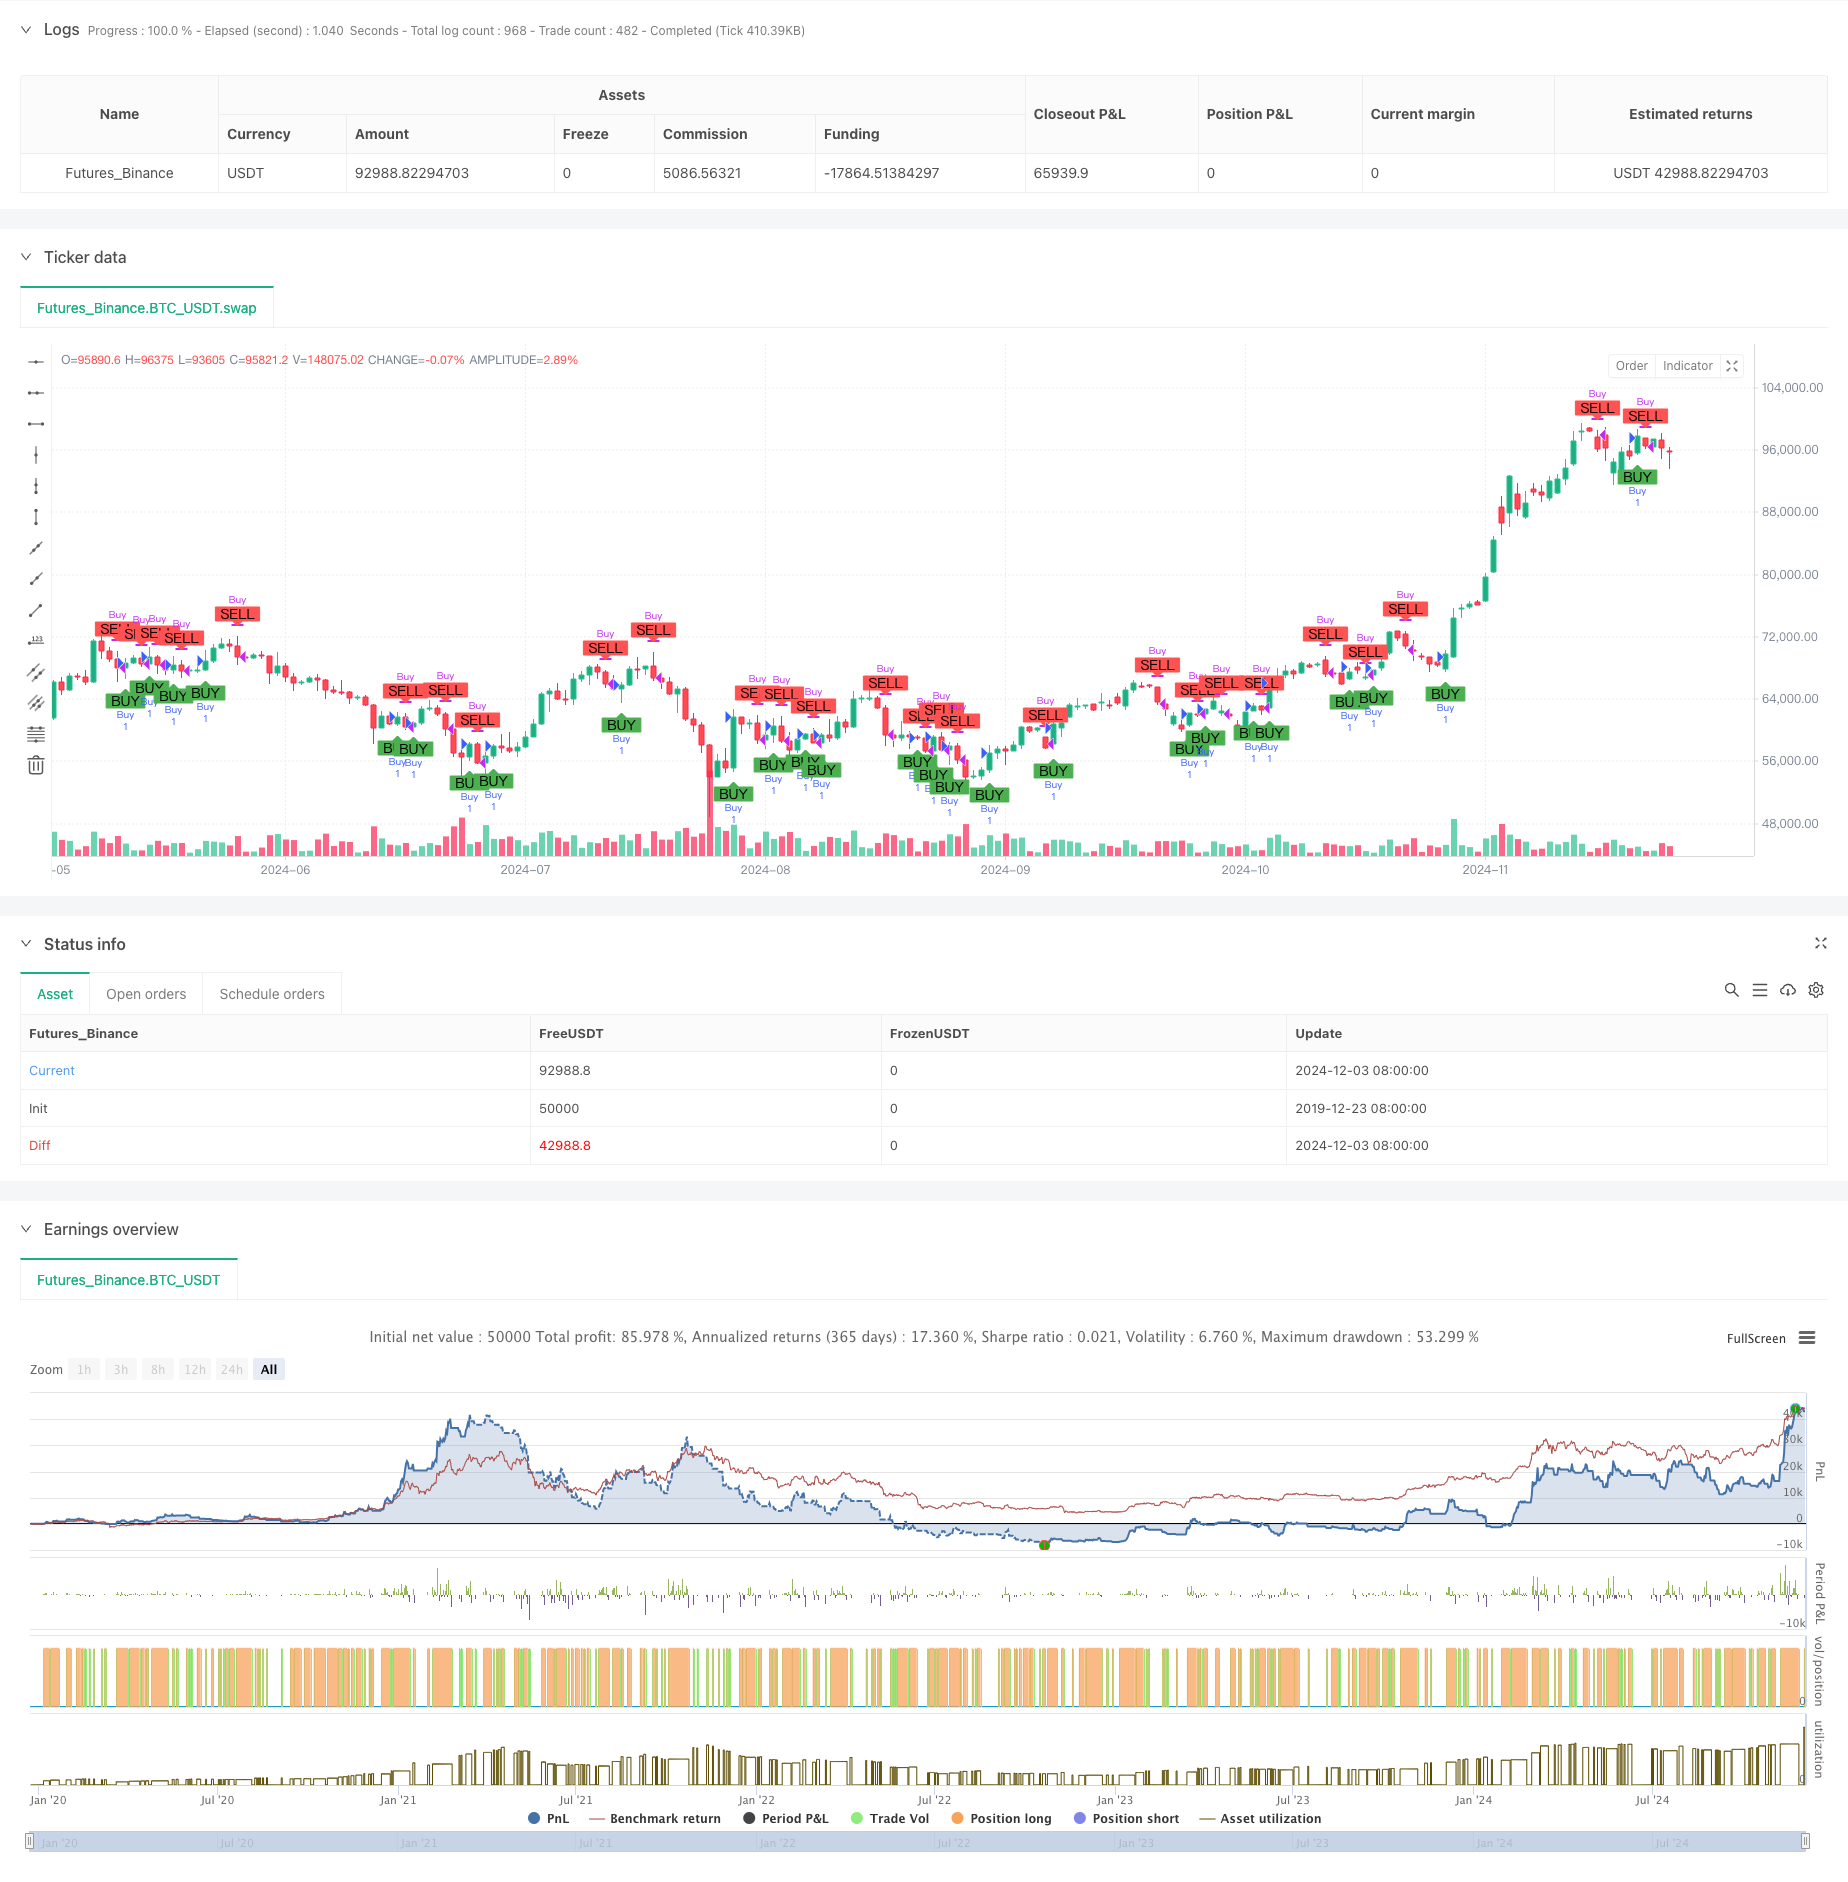
本策略是一个基于去趋势价格震荡指标(DPO)和指数移动平均线(EMA)交叉的量化交易策略。策略的核心思想是通过对比DPO和其4周期EMA的关系来捕捉市场趋势的变化,从而产生买入和卖出信号。该策略特别适用于4小时及以上的较大时间周期,并且在使用平滑蜡烛图(Heikin Ashi)时效果更佳。
策略原理
策略的核心逻辑包含以下几个关键步骤: 1. 计算24周期简单移动平均线(SMA)作为基准线 2. 将SMA向前移动(length/2+1)个周期,获得位移后的SMA值 3. 用收盘价减去位移后的SMA,得到DPO值 4. 计算DPO的4周期指数移动平均线 5. 当DPO上穿其4周期EMA时,产生买入信号 6. 当DPO下穿其4周期EMA时,产生卖出信号
策略优势
- 信号明确性强:通过交叉信号产生明确的买卖点,避免主观判断
- 趋势跟踪效果好:DPO指标可以有效过滤市场噪音,更好地捕捉主要趋势
- 时滞较小:使用短周期(4周期)EMA作为信号线,能够较快响应市场变化
- 适应性强:策略在不同市场环境下都具有一定的适应能力
- 操作简单:策略逻辑清晰,容易理解和执行
策略风险
- 震荡市场风险:在横盘震荡市场中可能产生频繁的假信号
- 滞后性风险:虽然使用了短周期EMA,但仍存在一定的滞后性
- 趋势反转风险:在强势趋势突然反转时可能造成较大损失
- 参数敏感性:策略效果对周期参数的选择较为敏感
- 市场条件依赖:策略在某些市场条件下的表现可能不够理想
策略优化方向
- 引入波动率过滤:可以添加ATR或其他波动率指标来过滤低波动率环境下的信号
- 增加趋势确认:结合其他趋势指标如ADX来确认趋势强度
- 优化止损设置:可以根据市场波动性动态调整止损位置
- 改进信号过滤:添加成交量确认或其他技术指标来过滤假信号
- 参数自适应:实现参数的动态优化,以适应不同市场环境
总结
DPO-EMA趋势交叉策略是一个结构简单但效果显著的量化交易策略。通过结合去趋势震荡指标和移动平均线,该策略能够有效捕捉市场趋势变化。虽然存在一些固有的风险,但通过合理的优化和风险管理措施,该策略仍然具有较好的实战应用价值。对于中长期交易者来说,这是一个值得考虑的策略选择。
策略源码
/*backtest
start: 2019-12-23 08:00:00
end: 2024-12-04 00:00:00
period: 1d
basePeriod: 1d
exchanges: [{"eid":"Futures_Binance","currency":"BTC_USDT"}]
*/

//@version=5
strategy("DPO 4,24 Strategy", shorttitle="DPO Strategy", overlay=true)

// Define a fixed lookback period and EMA length
length = 24
ema_length = 4

// Calculate the Simple Moving Average (SMA) of the closing prices
sma = ta.sma(close, length)

// Calculate the shifted SMA value
shifted_sma = sma[length / 2 + 1]

// Calculate the Detrended Price Oscillator (DPO)
dpo = close - shifted_sma

// Calculate the 4-period Exponential Moving Average (EMA) of the DPO
dpo_ema = ta.ema(dpo, ema_length)

// Generate buy and sell signals based on crossovers
buy_signal = ta.crossover(dpo, dpo_ema)
sell_signal = ta.crossunder(dpo, dpo_ema)

// Overlay buy and sell signals on the candlestick chart
plotshape(series=buy_signal, location=location.belowbar, color=color.green, style=shape.labelup, text="BUY")
plotshape(series=sell_signal, location=location.abovebar, color=color.red, style=shape.labeldown, text="SELL")

// Strategy entry and exit conditions
if (buy_signal)
    strategy.entry("Buy", strategy.long)

if (sell_signal)
    strategy.close("Buy")
相关推荐