概述
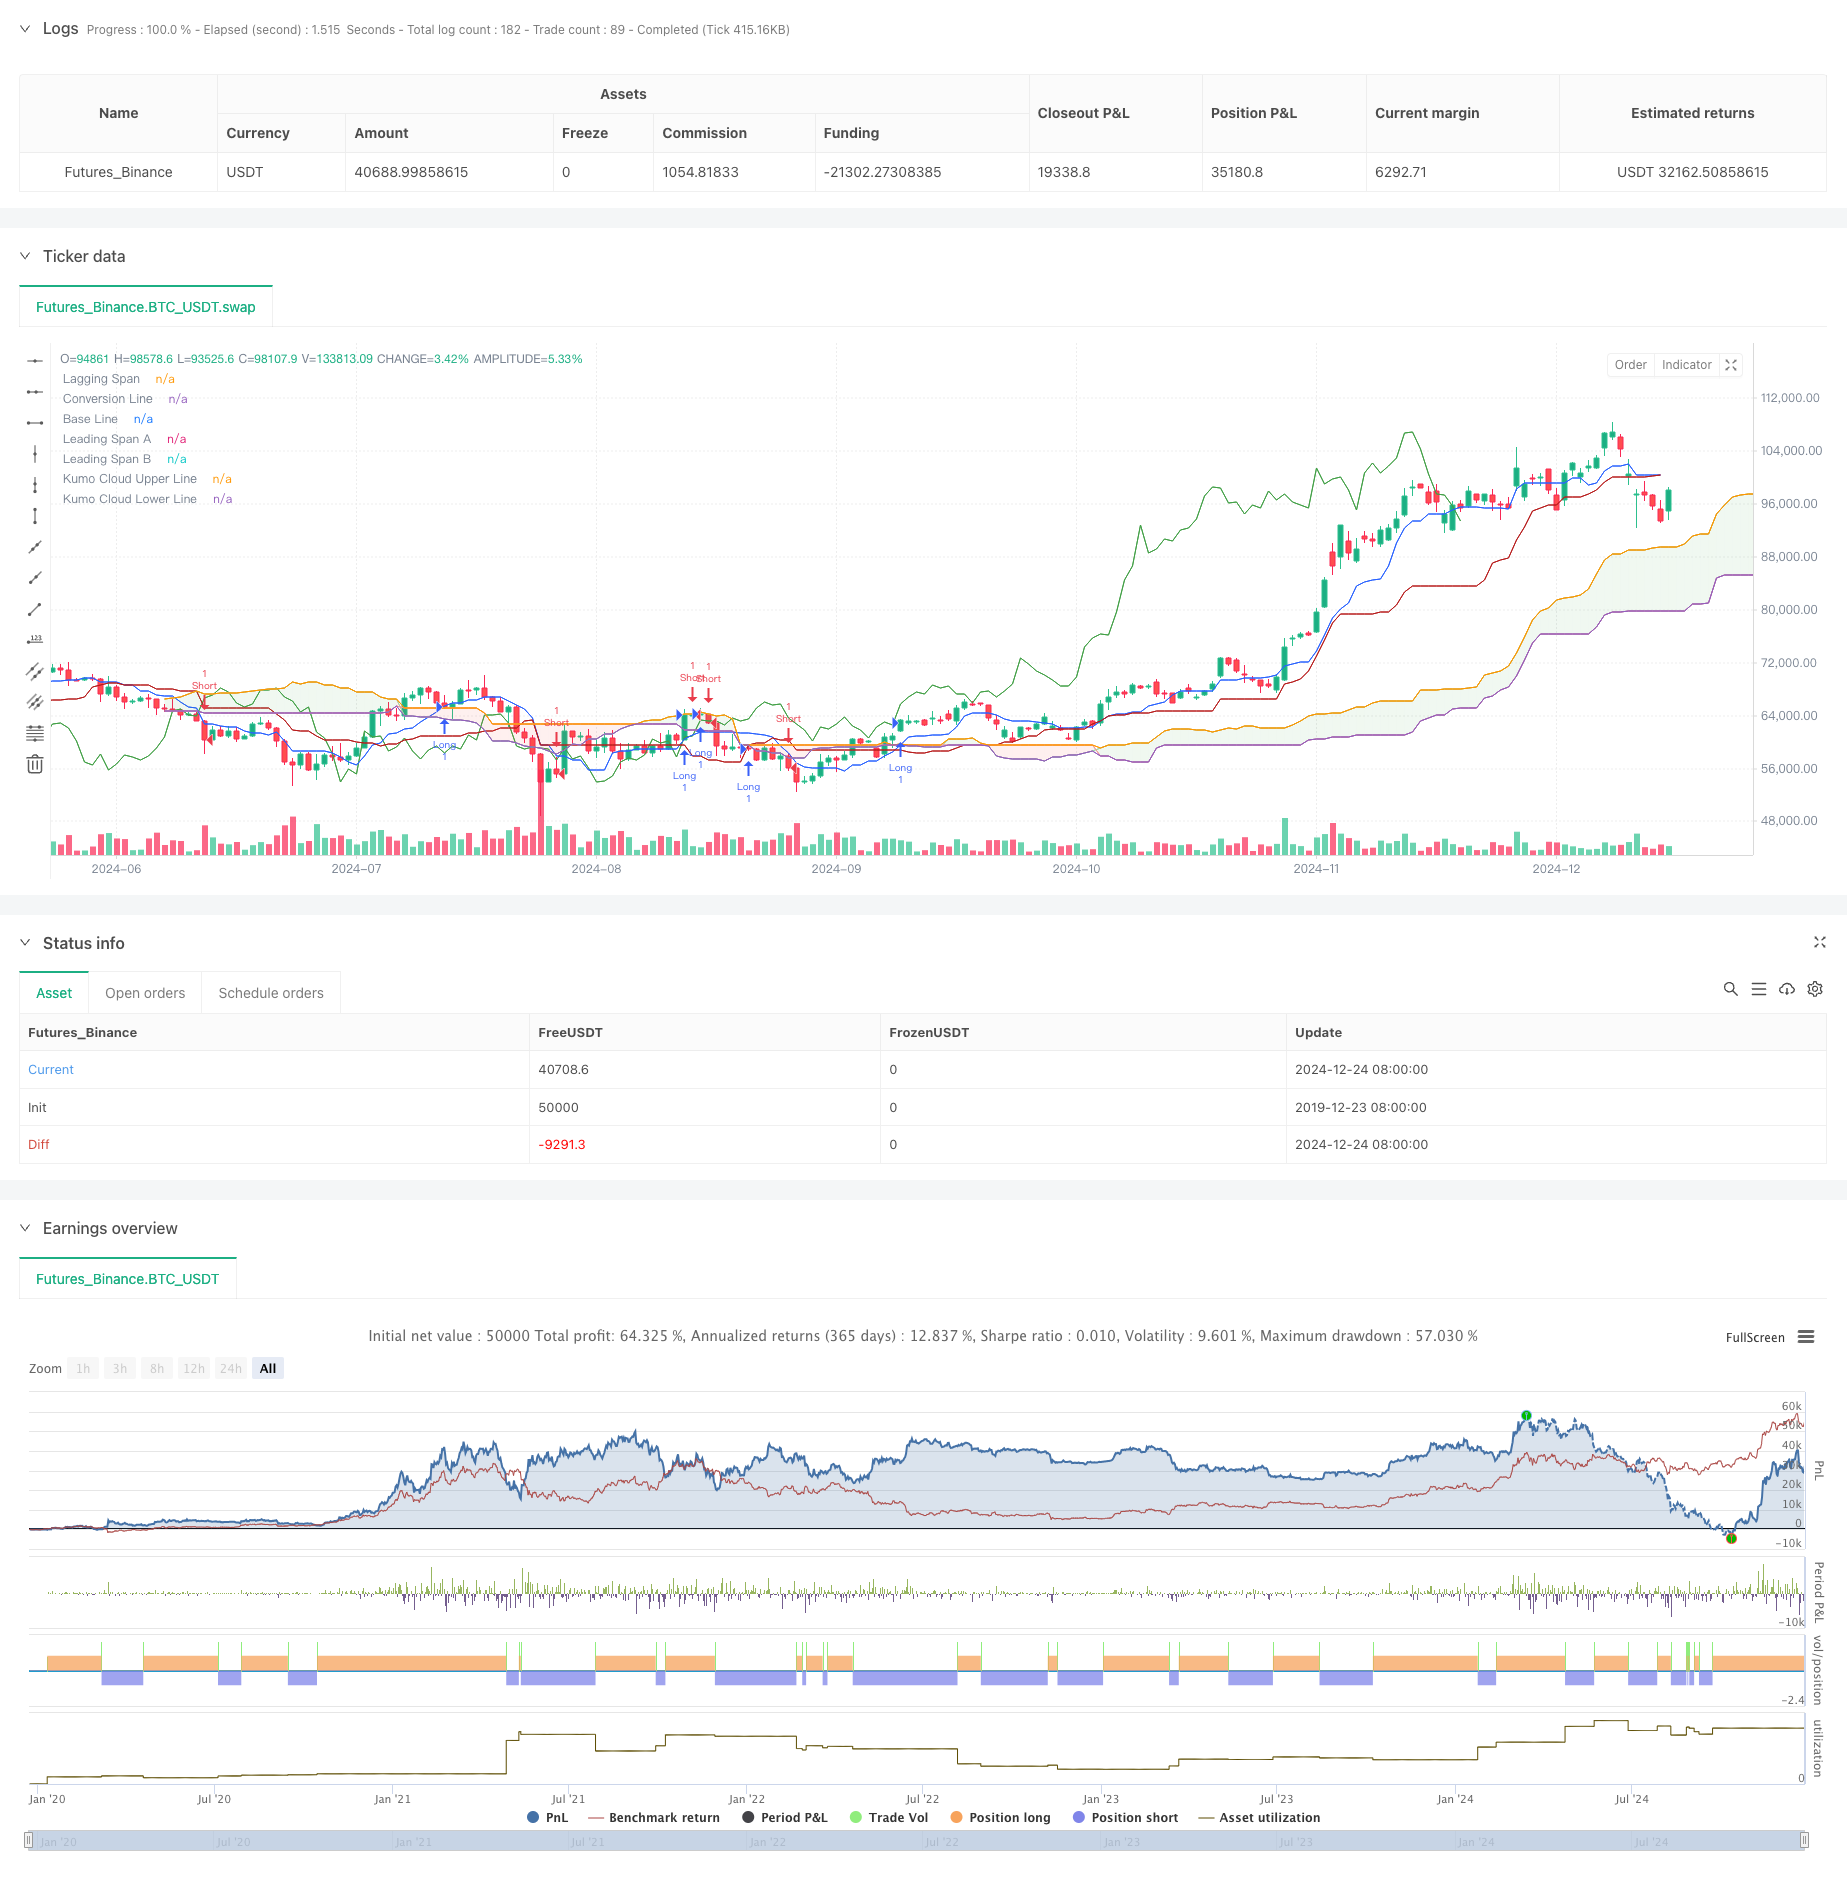
本策略是一个基于一目均衡表(Ichimoku Cloud)的量化交易系统。该策略主要利用先行带A(Leading Span A)和先行带B(Leading Span B)的交叉信号来确定市场趋势方向并生成交易信号。策略采用了动态的价格区间判断方法,结合了唐奇安通道(Donchian Channel)的计算原理,能够有效捕捉市场趋势的转折点。
策略原理
策略的核心逻辑基于以下几个关键组件: 1. 转换线(Conversion Line):利用9周期的唐奇安通道中值作为快速反应指标 2. 基准线(Base Line):采用26周期的唐奇安通道中值作为中期趋势指标 3. 先行带A(Leading Span A):由转换线和基准线的均值计算得出 4. 先行带B(Leading Span B):使用52周期的唐奇安通道中值作为长期趋势指标 5. 延迟线(Lagging Span):将收盘价向后移动26个周期
交易信号的触发条件如下: - 做多信号:当先行带A向上穿越先行带B时 - 做空信号:当先行带A向下穿越先行带B时
策略优势
- 多维度趋势确认:通过不同周期的指标组合,能够全面评估市场趋势
- 信号可靠性高:利用云层交叉作为信号触发条件,能够有效过滤虚假信号
- 风险控制完善:云层结构本身就具有支撑压力的功能,为交易提供了自然的止损位
- 适应性强:策略参数可根据不同市场特征进行调整,具有较强的普适性
策略风险
- 滞后性风险:由于使用较长周期的计算方法,可能导致入场和出场信号存在一定延迟
- 震荡市场风险:在横盘震荡市场中,可能产生频繁的假突破信号
- 参数敏感性:不同的参数组合可能导致策略表现差异较大
- 回撤风险:在趋势反转时,可能面临较大的回撤
策略优化方向
- 引入成交量指标:可以结合成交量变化来确认趋势的有效性
- 优化参数选择:根据不同市场周期特征,动态调整各项参数
- 增加辅助指标:可以添加RSI或MACD等指标作为辅助确认信号
- 完善止损机制:设计更加灵活的止损策略,如跟踪止损
总结
该策略是一个结合了经典技术分析工具的量化交易系统,通过多维度的趋势分析来捕捉市场机会。虽然存在一定的滞后性,但整体而言具有较好的可靠性和适应性。通过持续优化和完善,该策略有望在不同市场环境下都能保持稳定的表现。
策略源码
/*backtest
start: 2019-12-23 08:00:00
end: 2024-12-25 08:00:00
period: 1d
basePeriod: 1d
exchanges: [{"eid":"Futures_Binance","currency":"BTC_USDT"}]
*/

// This Pine Script™ code is subject to the terms of the Mozilla Public License 2.0 at https://mozilla.org/MPL/2.0/
// © mrbakipinarli

//@version=6
strategy(title="Ichimoku Cloud Strategy", shorttitle="Ichimoku Strategy", overlay=true)

// Inputs for Ichimoku Cloud
conversionPeriods = input.int(9, minval=1, title="Conversion Line Length")
basePeriods = input.int(26, minval=1, title="Base Line Length")
laggingSpan2Periods = input.int(52, minval=1, title="Leading Span B Length")
displacement = input.int(26, minval=1, title="Lagging Span")

// Functions
donchian(len) => math.avg(ta.lowest(len), ta.highest(len))

// Ichimoku Components
conversionLine = donchian(conversionPeriods)
baseLine = donchian(basePeriods)
leadLine1 = math.avg(conversionLine, baseLine)
leadLine2 = donchian(laggingSpan2Periods)

// Plotting Ichimoku Components
plot(conversionLine, color=color.new(#2962FF, 0), title="Conversion Line")
plot(baseLine, color=color.new(#B71C1C, 0), title="Base Line")
plot(close, offset = -displacement + 1, color=color.new(#43A047, 0), title="Lagging Span")
p1 = plot(leadLine1, offset = displacement - 1, color=color.new(#A5D6A7, 0), title="Leading Span A")
p2 = plot(leadLine2, offset = displacement - 1, color=color.new(#EF9A9A, 0), title="Leading Span B")

// Kumo Cloud
plot(leadLine1 > leadLine2 ? leadLine1 : leadLine2, offset = displacement - 1, title = "Kumo Cloud Upper Line", display = display.none)
plot(leadLine1 < leadLine2 ? leadLine1 : leadLine2, offset = displacement - 1, title = "Kumo Cloud Lower Line", display = display.none)
fill(p1, p2, color = leadLine1 > leadLine2 ? color.rgb(67, 160, 71, 90) : color.rgb(244, 67, 54, 90))

// Trading Logic
longCondition = ta.crossover(leadLine1, leadLine2)
shortCondition = ta.crossunder(leadLine1, leadLine2)

if (longCondition)
    strategy.entry("Long", strategy.long)

if (shortCondition)
    strategy.entry("Short", strategy.short)
相关推荐