概述
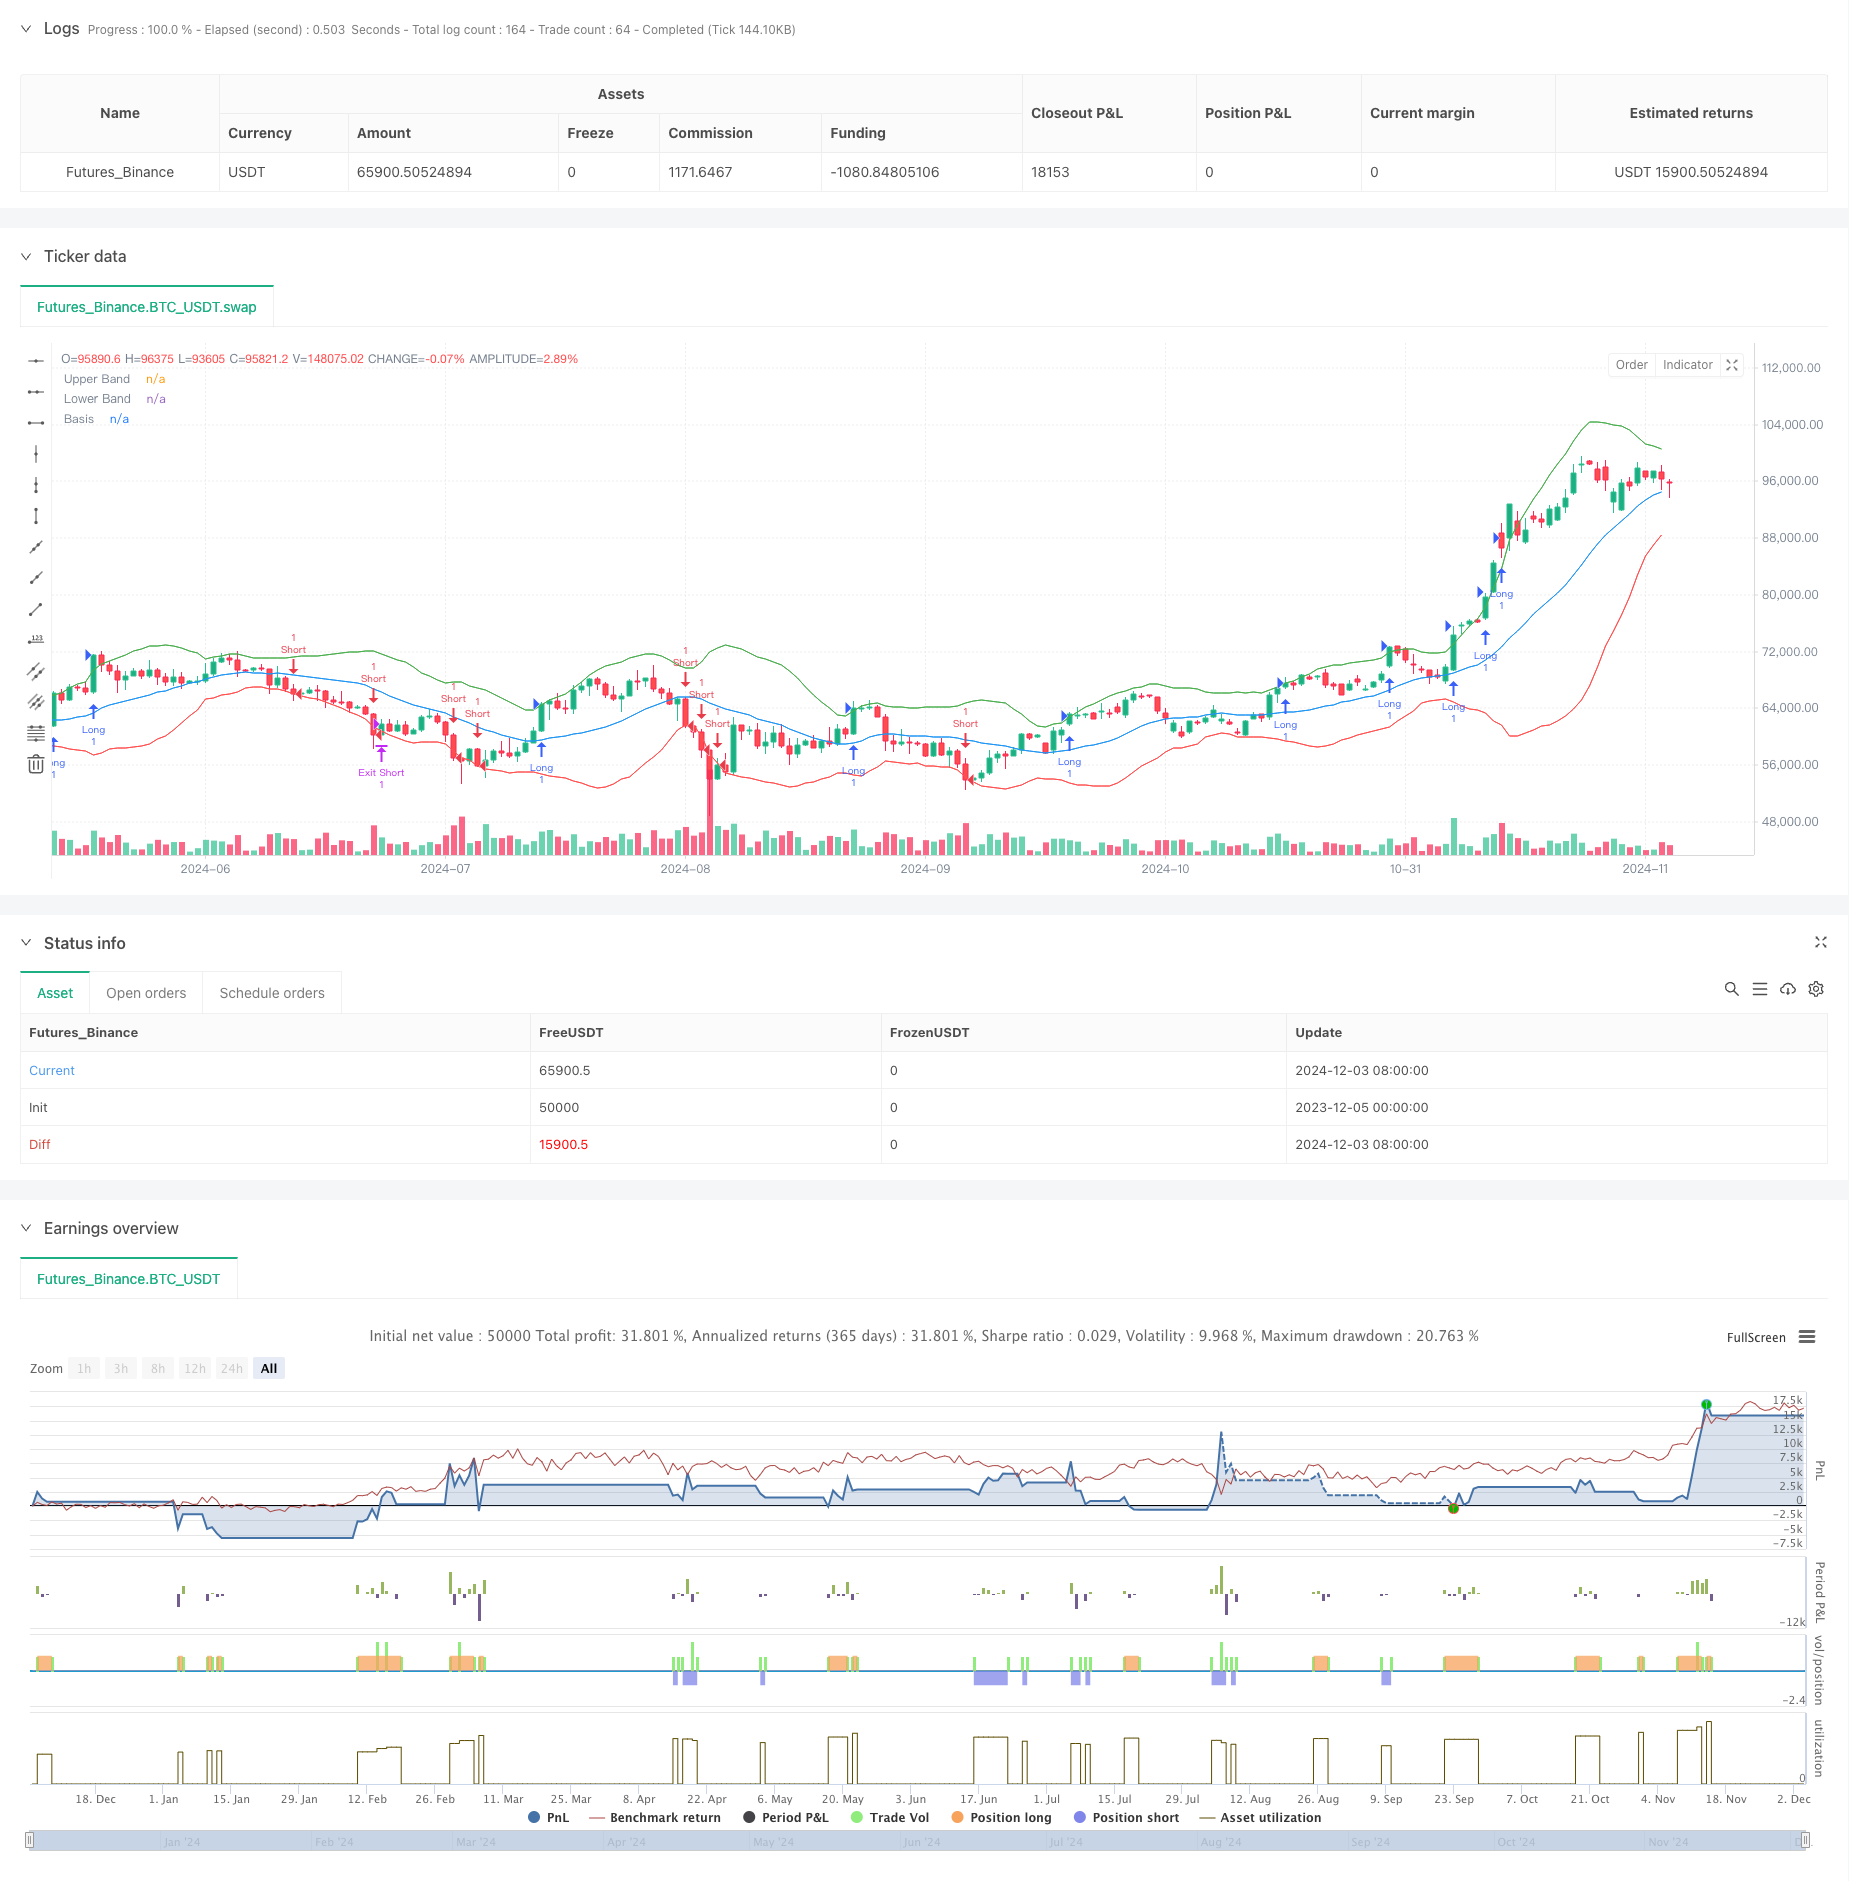
该策略是一个基于布林带和RSI指标的动态突破交易系统。它通过将布林带的波动性分析与RSI的动量确认相结合,构建了一个全面的交易决策框架。策略支持多方向交易控制,可以根据市场情况灵活选择做多、做空或双向交易。系统采用风险收益比来精确控制每笔交易的止损和获利目标,实现了交易管理的系统化。
策略原理
策略的核心原理是通过多重信号确认来识别高概率的突破交易机会。具体来说: 1. 使用布林带作为主要的突破信号指示器,当价格突破上轨或下轨时触发交易信号 2. 引入RSI作为动量确认指标,要求RSI值支持突破方向(上突破时RSI>50,下突破时RSI<50) 3. 通过trade_direction参数控制交易方向,可以根据市场趋势选择单向或双向交易 4. 采用固定比例止损(2%)和动态风险收益比(默认2:1)来管理每笔交易的风险与收益 5. 设置了完整的仓位管理机制,包括入场、止损和获利了结的精确控制
策略优势
- 信号可靠性高:通过布林带和RSI的双重确认,大大提高了交易信号的可靠性
- 方向控制灵活:可以根据市场环境自由选择交易方向,适应性强
- 风险管理完善:采用固定止损比例和可调整的风险收益比,实现了系统化的风险控制
- 参数可优化性:关键参数如布林带长度、乘数、RSI设置等都可以根据市场特征优化
- 策略逻辑清晰:突破条件明确,交易规则简单直观,便于理解和执行
策略风险
- 假突破风险:在震荡市场中可能出现虚假突破信号,导致连续止损
- 固定止损风险:2%的固定止损位可能不适合所有市场环境
- 参数依赖性:策略效果强烈依赖于参数设置,不同市场可能需要不同参数
- 趋势依赖:在无明显趋势的市场中,策略表现可能不佳
- 滑点风险:在波动剧烈时,实际成交价格可能与信号价格有较大偏差
策略优化方向
- 引入成交量确认:在突破信号中加入成交量过滤器,提高信号可靠性
- 增加趋势过滤:添加ADX等趋势指标,避免在震荡市场中频繁交易
- 动态止损设置:根据ATR等波动指标动态调整止损距离
- 完善出场机制:除了固定风险收益比外,可以增加移动止损等灵活出场方式
- 市场环境分类:增加市场环境判断模块,在不同市场状态下使用不同的参数设置
总结
这是一个设计合理、逻辑清晰的突破交易策略。通过多重信号确认和完善的风险管理机制,策略具有较好的实用性。同时,策略提供了丰富的优化空间,可以根据具体交易品种和市场环境进行针对性改进。建议在实盘使用前进行充分的参数优化和回测验证。
策略源码
/*backtest
start: 2023-12-05 00:00:00
end: 2024-12-04 00:00:00
period: 1d
basePeriod: 1d
exchanges: [{"eid":"Futures_Binance","currency":"BTC_USDT"}]
*/

//@version=5
strategy("Bollinger Breakout Strategy with Direction Control", overlay=true)

// === Input Parameters ===
length = input(20, title="Bollinger Bands Length")
src = close
mult = input(2.0, title="Bollinger Bands Multiplier")
rsi_length = input(14, title="RSI Length")
rsi_midline = input(50, title="RSI Midline")
risk_reward_ratio = input(2.0, title="Risk/Reward Ratio")

// === Trade Direction Option ===
trade_direction = input.string("Both", title="Trade Direction", options=["Long", "Short", "Both"])

// === Bollinger Bands Calculation ===
basis = ta.sma(src, length)
dev = mult * ta.stdev(src, length)
upper_band = basis + dev
lower_band = basis - dev

// === RSI Calculation ===
rsi_val = ta.rsi(src, rsi_length)

// === Breakout Conditions ===
// Long: Prijs sluit boven de bovenste Bollinger Band en RSI > RSI Midline
long_condition = close > upper_band and rsi_val > rsi_midline and (trade_direction == "Long" or trade_direction == "Both")

// Short: Prijs sluit onder de onderste Bollinger Band en RSI < RSI Midline
short_condition = close < lower_band and rsi_val < rsi_midline and (trade_direction == "Short" or trade_direction == "Both")

// === Entry Prices ===
var float entry_price_long = na
var float entry_price_short = na

if (long_condition)
    entry_price_long := close
    strategy.entry("Long", strategy.long, when=long_condition)

if (short_condition)
    entry_price_short := close
    strategy.entry("Short", strategy.short, when=short_condition)

// === Stop-Loss and Take-Profit ===
long_stop_loss = entry_price_long * 0.98  // 2% onder instapprijs
long_take_profit = entry_price_long * (1 + (0.02 * risk_reward_ratio))

short_stop_loss = entry_price_short * 1.02  // 2% boven instapprijs
short_take_profit = entry_price_short * (1 - (0.02 * risk_reward_ratio))

if (strategy.position_size > 0)  // Long Positie
    strategy.exit("Exit Long", "Long", stop=long_stop_loss, limit=long_take_profit)

if (strategy.position_size < 0)  // Short Positie
    strategy.exit("Exit Short", "Short", stop=short_stop_loss, limit=short_take_profit)

// === Plotting ===
plot(upper_band, color=color.green, title="Upper Band")
plot(lower_band, color=color.red, title="Lower Band")
plot(basis, color=color.blue, title="Basis")
相关推荐