ওভারভিউ
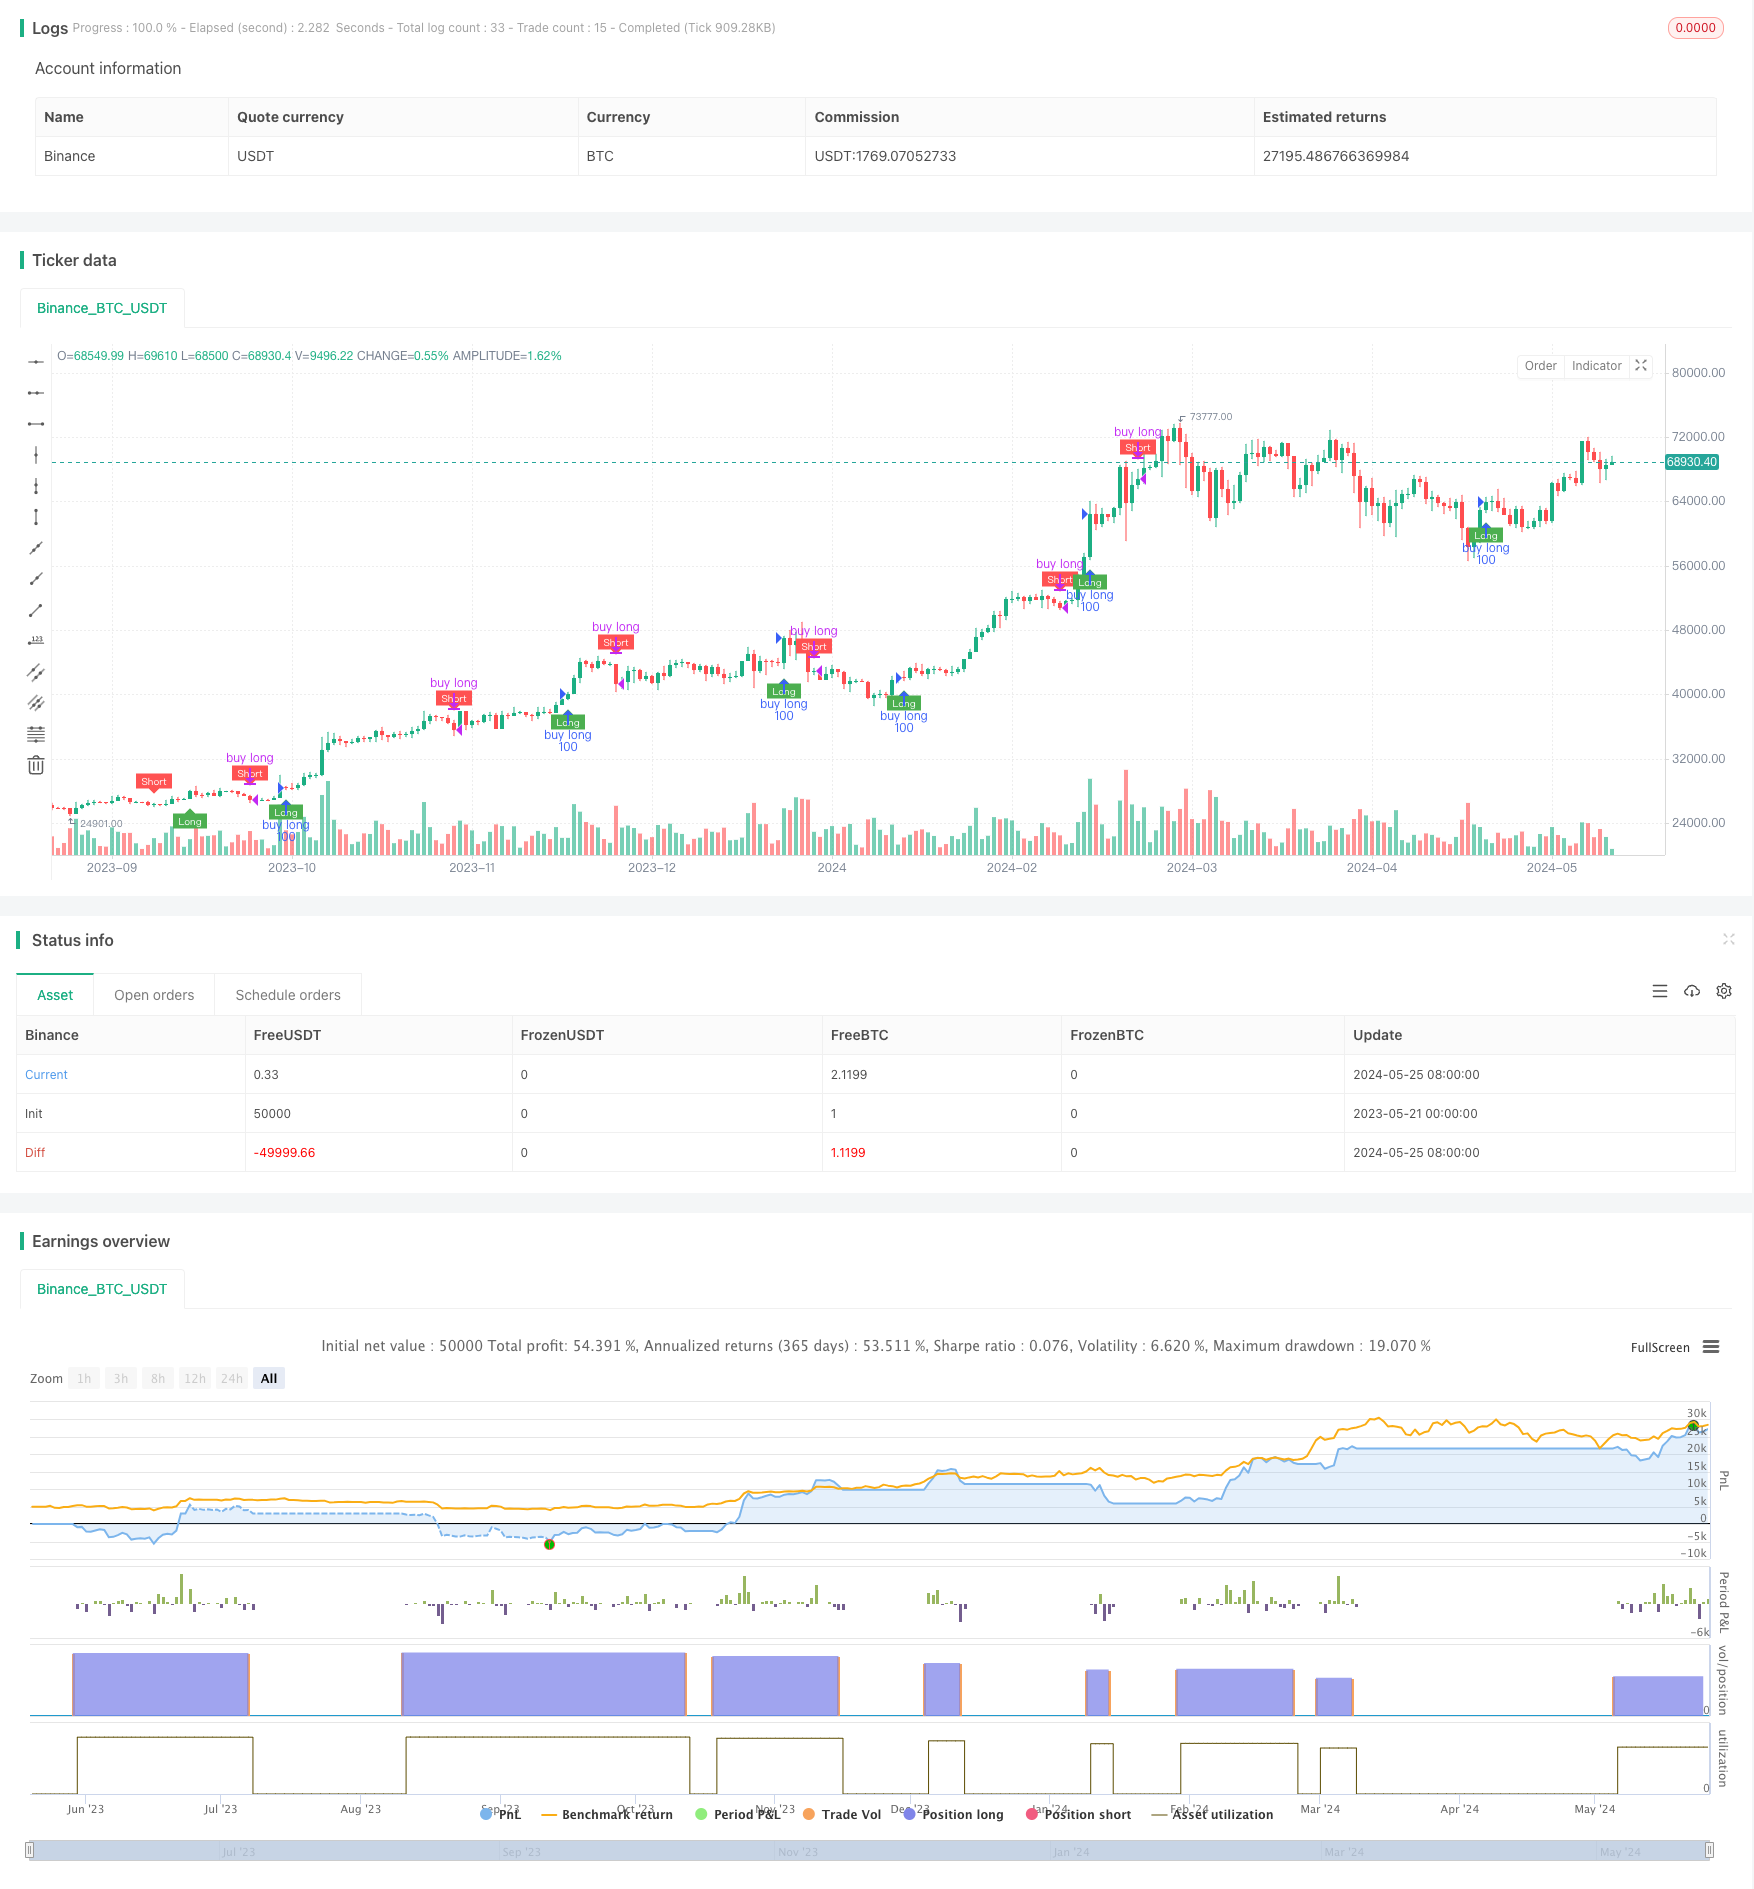
এই কৌশলটি QQE সূচক এবং RSI সূচকের উপর ভিত্তি করে, RSI সূচকের মসৃণ চলমান গড় এবং গতিশীল অস্থিরতার প্রশস্ততা গণনা করে একটি বহু-বাম সংকেত ব্যাপ্তি তৈরি করে। যখন RSI সূচকটি উর্ধ্বমুখী হয় তখন একটি বহু-সিগন্যাল উত্পন্ন হয় এবং যখন এটি নিম্নমুখী হয় তখন একটি শূন্য সংকেত উত্পন্ন হয়। কৌশলটির মূল ধারণাটি হ’ল RSI সূচকের প্রবণতার বৈশিষ্ট্য এবং QQE সূচকের ওলট-পালট বৈশিষ্ট্যগুলি ব্যবহার করে বাজারের প্রবণতা পরিবর্তন এবং ওলট-পালট সুযোগগুলি ধরতে।
কৌশল নীতি
- ট্রেন্ড নির্ধারণের ভিত্তিতে RSI সূচকের সমতল চলমান গড় RsiMa গণনা করা হয়।
- আরএসআই সূচকের পরম বিচ্যুতির মান AttrRsi গণনা করুন এবং এর মসৃণ চলমান গড় মান MaAtrRsi গণনা করুন, যা ওঠানামা করার ভিত্তি হিসাবে কাজ করে।
- QQE ফ্যাক্টর দ্বারা গতিশীল কম্পন dar এর পরিমাণ গণনা করা হয় এবং RsiMa এর সাথে মিলিত হয়ে একটি বহুমুখী সংকেত ব্যাপ্তি longband এবং shortband গঠন করা হয়।
- আরএসআই সূচকটি মাল্টি-ব্যান্ড সংকেতের সাথে সম্পর্কিত, যখন আরএসআই সূচকটি লম্বা ব্যান্ডে প্রবেশ করে তখন মাল্টি-সাইন তৈরি করে, এবং শর্ট ব্যান্ডে প্রবেশের সময় একটি শূন্য সংকেত তৈরি করে।
- ট্রেডিং করা হয় পল্টু শূন্য সংকেত অনুসারে, পল্টু সংকেত ট্রিগার হলে পজিশন খোলার জন্য ক্রয় করা হয় এবং পল্টু সংকেত ট্রিগার হলে পজিশন খোলার জন্য।
কৌশলগত সুবিধা
- আরএসআই এবং কিউকিউই সূচকগুলির বৈশিষ্ট্যগুলি একত্রিত করে, এটি বাজারের প্রবণতা এবং অস্থিরতার সুযোগগুলি আরও ভালভাবে ক্যাপচার করতে পারে।
- গতিশীল কম্পনের মাত্রা ব্যবহার করে একটি সংকেত ব্যাপ্তি তৈরি করা হয় যা বাজারের অস্থিরতার পরিবর্তনের সাথে খাপ খাইয়ে নেয়।
- আরএসআই সূচক এবং ওঠানামার প্রস্থকে মসৃণভাবে পরিচালনা করে, শব্দ এবং ঘন ঘন লেনদেনের ঝামেলা কার্যকরভাবে হ্রাস করে।
- লজিক পরিষ্কার, প্যারামিটার কম, আরও অপ্টিমাইজেশান এবং উন্নতির জন্য উপযুক্ত।
কৌশলগত ঝুঁকি
- এই কৌশলটি অস্থির বাজার এবং স্বল্প অস্থিরতার জন্য উপযুক্ত নাও হতে পারে।
- মার্কেটের হঠাৎ বিপর্যয় ঘটলে প্রত্যাহারের ঝুঁকি বাড়তে পারে, কারণ সুস্পষ্ট ক্ষতিপূরণ ব্যবস্থা নেই।
- প্যারামিটার সেটিংগুলি কৌশলগত পারফরম্যান্সের উপর প্রভাব ফেলে এবং বিভিন্ন বাজার এবং জাতের সাথে সামঞ্জস্য করে।
কৌশল অপ্টিমাইজেশনের দিকনির্দেশনা
- প্রত্যাহারের ঝুঁকি নিয়ন্ত্রণের জন্য সুনির্দিষ্ট ক্ষতিপূরণ ব্যবস্থা যেমন স্থির শতাংশ ক্ষতিপূরণ, এটিআর ক্ষতিপূরণ ইত্যাদি চালু করা।
- অনুকূলিতকরণ প্যারামিটার সেটিং, জেনেটিক অ্যালগরিদম, গ্রিড অনুসন্ধান ইত্যাদির মাধ্যমে সর্বোত্তম প্যারামিটার সমন্বয় খুঁজে পাওয়া যায়।
- ট্রেডিং সিগন্যাল সমৃদ্ধ করতে এবং কৌশলগত স্থিতিশীলতা বাড়ানোর জন্য অন্যান্য সূচক যেমন লেনদেনের পরিমাণ, হোল্ডিং পরিমাণ ইত্যাদি বিবেচনা করুন।
- ঝড়ের বাজারের জন্য, কৌশলগত অভিযোজনযোগ্যতা বাড়ানোর জন্য, ব্যাপ্তি ট্রেডিং বা ব্যাপ্তি অপারেশন লজিক প্রবর্তন করা যেতে পারে।
সারসংক্ষেপ
এই কৌশলটি আরএসআই এবং কিউকিউই সূচকগুলির উপর ভিত্তি করে একটি বহুমুখী সংকেত তৈরি করে, যা প্রবণতা ক্যাপচার এবং ওঠানামা বোঝার বৈশিষ্ট্যযুক্ত। কৌশলটির যুক্তি স্পষ্ট, প্যারামিটারগুলি কম, আরও অপ্টিমাইজেশন এবং উন্নতির জন্য উপযুক্ত। তবে কৌশলটির কিছু ঝুঁকিও রয়েছে, যেমন প্রত্যাহার নিয়ন্ত্রণ, প্যারামিটার সেটিং ইত্যাদির ক্ষেত্রে আরও উন্নতি করা দরকার। ভবিষ্যতে কৌশলটির স্থিতিশীলতা এবং লাভজনকতা বাড়ানোর জন্য স্টপ মেশিন, প্যারামিটার অপ্টিমাইজেশন, সংকেত সমৃদ্ধি এবং বিভিন্ন বাজারের অভিযোজন ইত্যাদির ক্ষেত্রে কৌশলটি অপ্টিমাইজ করা যেতে পারে।
/*backtest
start: 2023-05-21 00:00:00
end: 2024-05-26 00:00:00
period: 1d
basePeriod: 1h
exchanges: [{"eid":"Binance","currency":"BTC_USDT"}]
*/

//@version=4
// modified by swigle
// thanks colinmck

strategy("QQE signals bot", overlay=true)


RSI_Period = input(14, title='RSI Length')
SF = input(5, title='RSI Smoothing')
QQE = input(4.236, title='Fast QQE Factor')
ThreshHold = input(10, title="Thresh-hold")

src = close
Wilders_Period = RSI_Period * 2 - 1

Rsi = rsi(src, RSI_Period)
RsiMa = ema(Rsi, SF)
AtrRsi = abs(RsiMa[1] - RsiMa)
MaAtrRsi = ema(AtrRsi, Wilders_Period)
dar = ema(MaAtrRsi, Wilders_Period) * QQE

longband = 0.0
shortband = 0.0
trend = 0

DeltaFastAtrRsi = dar
RSIndex = RsiMa
newshortband = RSIndex + DeltaFastAtrRsi
newlongband = RSIndex - DeltaFastAtrRsi
longband := RSIndex[1] > longband[1] and RSIndex > longband[1] ? max(longband[1], newlongband) : newlongband
shortband := RSIndex[1] < shortband[1] and RSIndex < shortband[1] ? min(shortband[1], newshortband) : newshortband
cross_1 = cross(longband[1], RSIndex)
trend := cross(RSIndex, shortband[1]) ? 1 : cross_1 ? -1 : nz(trend[1], 1)
FastAtrRsiTL = trend == 1 ? longband : shortband

// Find all the QQE Crosses

QQExlong = 0
QQExlong := nz(QQExlong[1])
QQExshort = 0
QQExshort := nz(QQExshort[1])
QQExlong := FastAtrRsiTL < RSIndex ? QQExlong + 1 : 0
QQExshort := FastAtrRsiTL > RSIndex ? QQExshort + 1 : 0

//Conditions

qqeLong = QQExlong == 1 ? FastAtrRsiTL[1] - 50 : na
qqeShort = QQExshort == 1 ? FastAtrRsiTL[1] - 50 : na

// Plotting

plotshape(qqeLong, title="QQE long", text="Long", textcolor=color.white, style=shape.labelup, location=location.belowbar, color=color.green, size=size.tiny)
plotshape(qqeShort, title="QQE short", text="Short", textcolor=color.white, style=shape.labeldown, location=location.abovebar, color=color.red, size=size.tiny)

// trade

//if qqeLong > 0
strategy.entry("buy long", strategy.long, 100, when=qqeLong)

if qqeShort > 0
    strategy.close("buy long")
    // strategy.exit("close_position", "buy long", loss=1000)
    // strategy.entry("sell", strategy.short, 1, when=strategy.position_size > 0)