Kryptowährungs-Futures Multi-Symbol ART-Strategie (Lehre)
Schriftsteller:- Ich bin ein Idiot., Erstellt: 2022-04-07 11:09:42, aktualisiert: 2022-04-07 16:15:14Kryptowährungs-Futures Multi-Symbol ART-Strategie (Lehre)
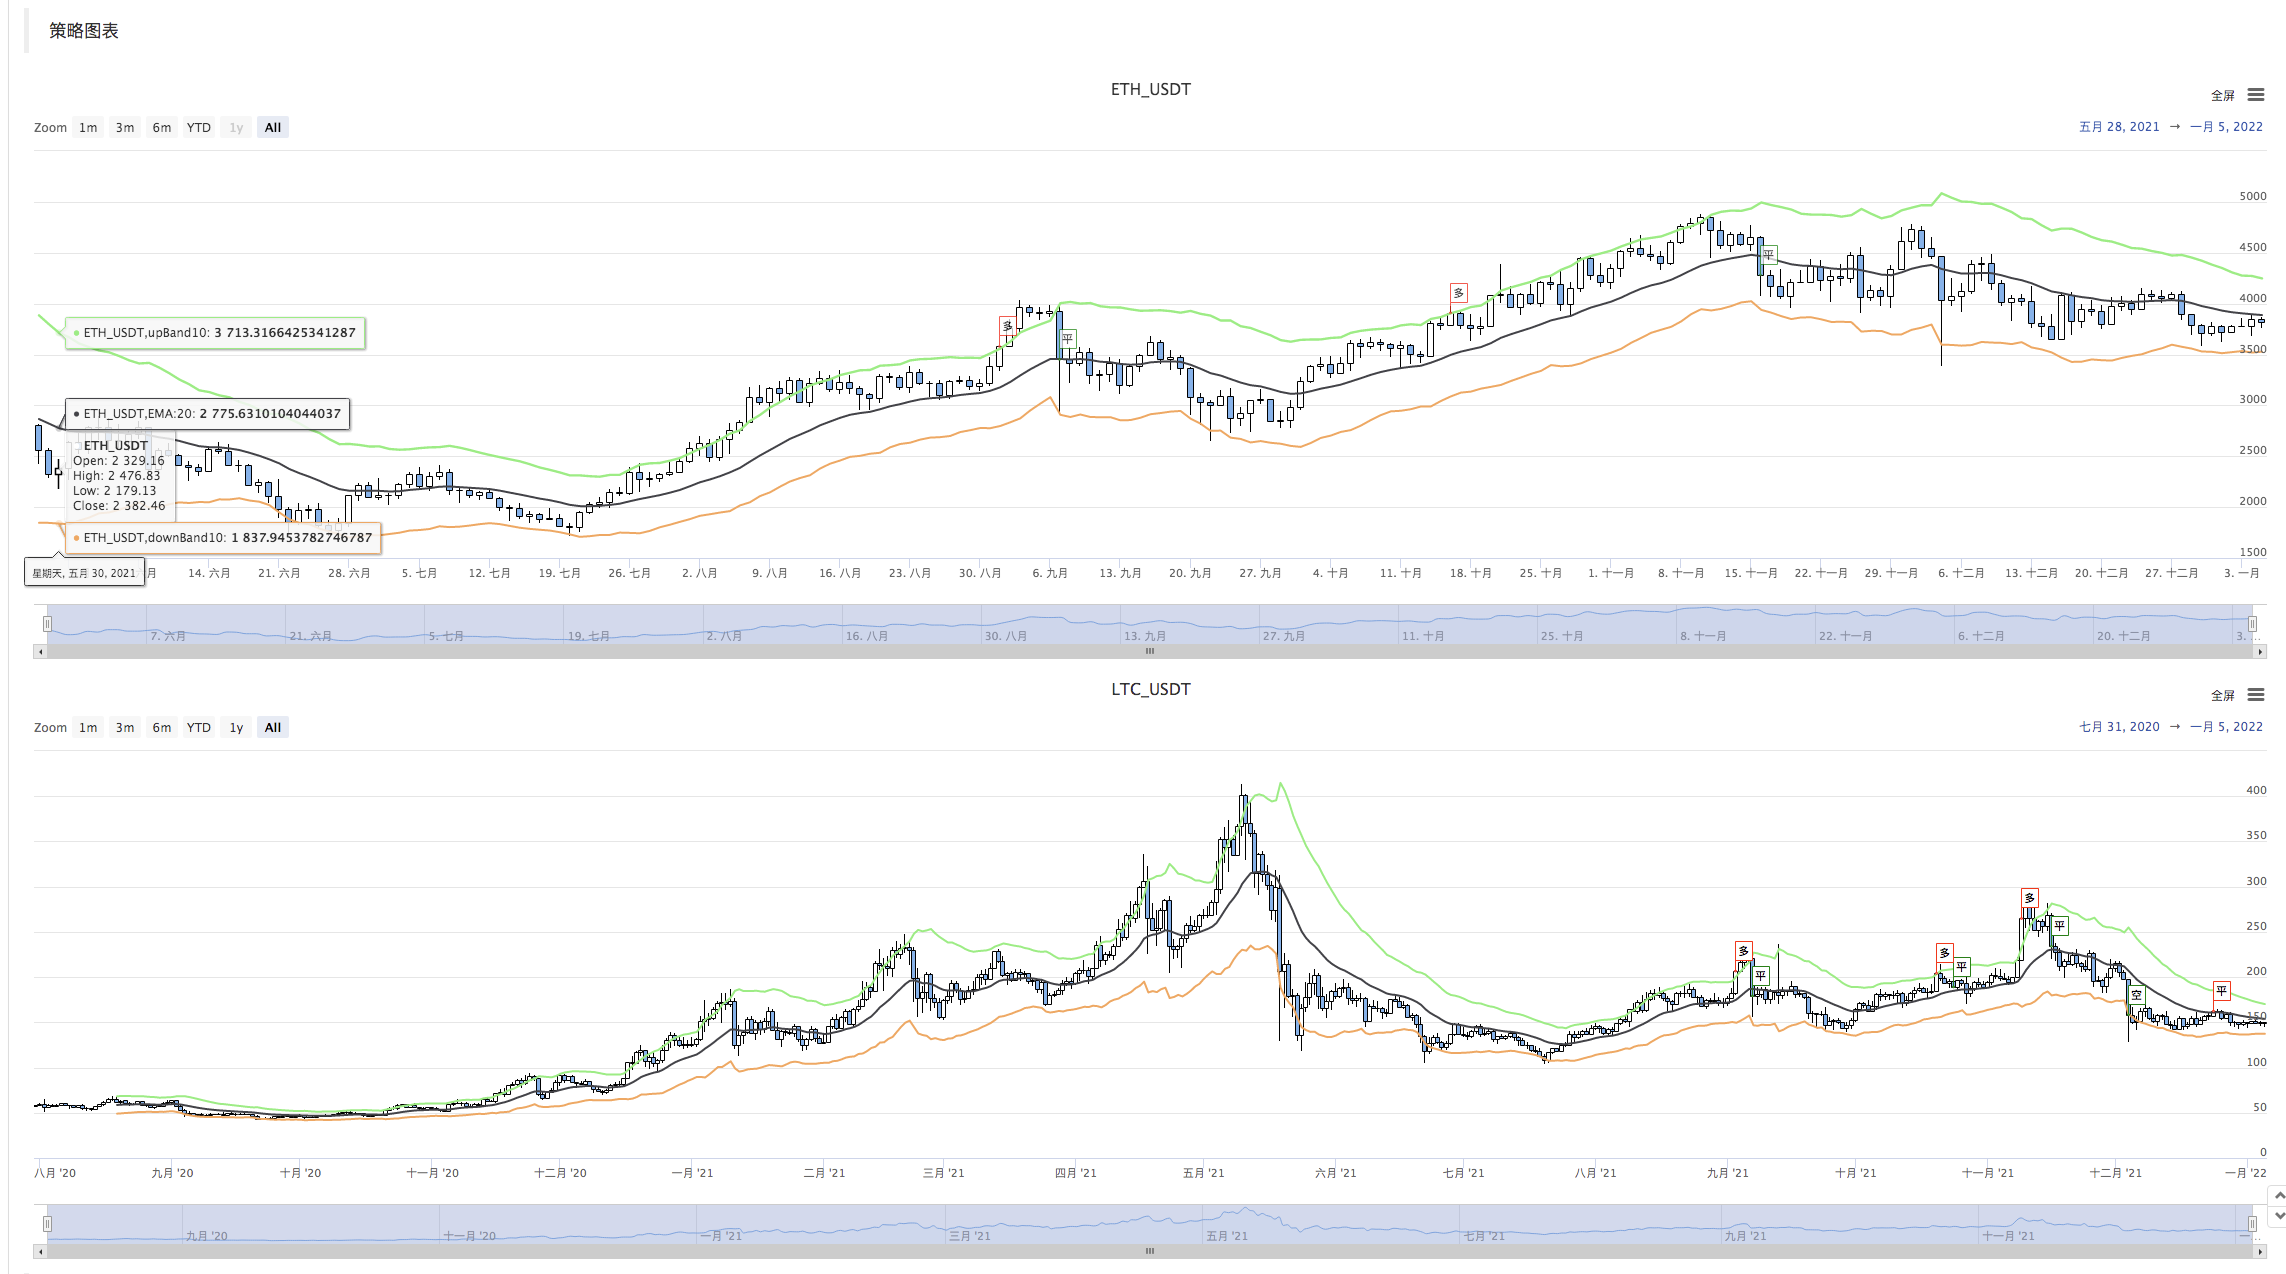
In letzter Zeit freuen sich einige Benutzer unserer Plattform sehr darauf, eine Mylanguage-Strategie in eine JavaScript-Strategie zu portieren, so dass viele Optimierungsideen flexibel hinzugefügt werden können. Sie möchten sogar eine Strategie in eine Multi-Symbol-Version erweitern. Da Mylanguage-Strategien normalerweise Trendstrategien sind und viele in einem nahen Preismodell ausgeführt werden. Diese Strategien verlangen nicht sehr häufig eine Plattform-API-Schnittstelle, die für die Porting in eine Multi-Symbol-Strategie-Version geeigneter ist. Im Artikel nehmen wir eine einfache Mylanguage-Strategie als Beispiel und portieren sie in eine einfache Version der JavaScript-Sprache. Der Hauptzweck besteht darin, zu unterrichten, zu backtesten und zu recherchieren. Wenn Sie eine Strategie ausführen möchten, müssen Sie möglicherweise einige Details hinzufügen (wie Bestellpreis, Präzision, Bestellbetrag, Bestellstatus, Bestellkontrolle nach Vermögenswert
Mylangauge-Strategie übertragen werden
TR:=MAX(MAX((H-L),ABS(REF(C,1)-H)),ABS(REF(C,1)-L));
ATR:=EMA(TR,LENGTH2);

MIDLINE^^EMA((H + L + C)/3,LENGTH1);
UPBAND^^MIDLINE + N*ATR;
DOWNBAND^^MIDLINE - N*ATR;


BKVOL=0 AND C>=UPBAND AND REF(C,1)<REF(UPBAND,1),BPK;
SKVOL=0 AND C<=DOWNBAND AND REF(C,1)>REF(DOWNBAND,1),SPK;

BKVOL>0 AND C<=MIDLINE,SP(BKVOL);
SKVOL>0 AND C>=MIDLINE,BP(SKVOL);
// stop loss
C>=SKPRICE*(1+SLOSS*0.01),BP;
C<=BKPRICE*(1-SLOSS*0.01),SP;
AUTOFILTER;
Die Strategie-Logik ist sehr einfach. Zuerst berechnen Sie nach Parametern den ATR, und berechnen Sie dann die Durchschnittswerte der höchsten, niedrigsten, geschlossenen und offenen Preise aller K-Line BARs, anhand derer der EMA-Indikator berechnet wird. Schließlich berechnen Sie auf der Grundlage des ATR und des Verhältnisses N in den Parametern den upBand und den downBand.
Offene Position und Reverse basieren auf dem Schlusskurs, der durch die UpBand und DownBand durchbricht. Wenn der Schlusskurs die Mittellinie erreicht, schließt die Position; wenn der Schlusskurs den Stop-Loss-Kurs erreicht, schließt die Position (gemäß SLOSS zum Stop-Loss; wenn SLOSS 1 ist, bedeutet dies 0,01, nämlich 1%). Die Strategie wird im Modell des Schlusskurses ausgeführt.
Nachdem wir die strategischen Anforderungen und Gedanken von Mylanguage verstanden haben, können wir anfangen zu transportieren.
Prototyp der Hafen- und Konstruktionsstrategie
Der Strategie-Prototyp-Code ist nicht zu lang, nur 1 bis 200 Zeilen. Damit Sie die Strategie-Schreibideen bequem studieren können, schreibe ich die Bemerkungen direkt in den Strategie-Code.
// parse params, from string to object
var arrParam = JSON.parse(params)

// the function creates the chart configuration
function createChartConfig(symbol, atrPeriod, emaPeriod, index) {   // symbol: trading pair; atrPeriod: ATR parameter period;  emaPeriod: EMA parameter period; index: index of the corresponding exchange object
    var chart = {
        __isStock: true,
        extension: {
                layout: 'single',
                height: 600,
        },
        title : { text : symbol},
        xAxis: { type: 'datetime'},
        series : [
            {
                type: 'candlestick',    // K-line data series
                name: symbol,
                id: symbol + "-" + index,
                data: []
            }, {
                type: 'line',           // EMA
                name: symbol + ',EMA:' + emaPeriod,
                data: [],
            }, {
                type: 'line',           // upBand
                name: symbol + ',upBand' + atrPeriod,
                data: []
            }, {
                type: 'line',           // downBand
                name: symbol + ',downBand' + atrPeriod,
                data: []
            }, {
                type: 'flags',
                onSeries: symbol + "-" + index,
                data: [],
            }
        ]
    }
    return chart
}

// main logic
function process(e, kIndex, c) {    // e is the exchange object, such as exchanges[0] ... ; kIndex is the data series of K-line data in the chart; c is the chart object
    // obtain K-line data
    var r = e.GetRecords(e.param.period)
    if (!r || r.length < e.param.atrPeriod + 2 || r.length < e.param.emaPeriod + 2) {
        // if K-line data length is insufficient, return
        return
    }

    // calculate ATR indicator
    var atr = TA.ATR(r, e.param.atrPeriod)
    var arrAvgPrice = []
    _.each(r, function(bar) {
        arrAvgPrice.push((bar.High + bar.Low + bar.Close) / 3)
    })
    // calculate EMA indicator
    var midLine = TA.EMA(arrAvgPrice, e.param.emaPeriod)
    // calculate upBand and downBand
    var upBand = []
    var downBand = []
    _.each(midLine, function(mid, index) {
        if (index < e.param.emaPeriod - 1 || index < e.param.atrPeriod - 1) {
            upBand.push(NaN)
            downBand.push(NaN)
            return
        }
        upBand.push(mid + e.param.trackRatio * atr[index])
        downBand.push(mid - e.param.trackRatio * atr[index])
    })

    // plot
    for (var i = 0 ; i < r.length ; i++) {
        if (r[i].Time == e.state.lastBarTime) {
            // update
            c.add(kIndex, [r[i].Time, r[i].Open, r[i].High, r[i].Low, r[i].Close], -1)
            c.add(kIndex + 1, [r[i].Time, midLine[i]], -1)
            c.add(kIndex + 2, [r[i].Time, upBand[i]], -1)
            c.add(kIndex + 3, [r[i].Time, downBand[i]], -1)
        } else if (r[i].Time > e.state.lastBarTime) {
            // add
            e.state.lastBarTime = r[i].Time
            c.add(kIndex, [r[i].Time, r[i].Open, r[i].High, r[i].Low, r[i].Close])
            c.add(kIndex + 1, [r[i].Time, midLine[i]])
            c.add(kIndex + 2, [r[i].Time, upBand[i]])
            c.add(kIndex + 3, [r[i].Time, downBand[i]])
        }
    }

    // detect position
    var pos = e.GetPosition()
    if (!pos) {
        return
    }
    var holdAmount = 0
    var holdPrice = 0
    if (pos.length > 1) {
        throw "Long and short positions are detected simultaneously!"
    } else if (pos.length != 0) {
        holdAmount = pos[0].Type == PD_LONG ? pos[0].Amount : -pos[0].Amount
        holdPrice = pos[0].Price
    }

    if (e.state.preBar == -1) {
        e.state.preBar = r[r.length - 1].Time
    }
    // detect signal
    if (e.state.preBar != r[r.length - 1].Time) {   // close price model
        if (holdAmount <= 0 && r[r.length - 3].Close < upBand[upBand.length - 3] && r[r.length - 2].Close > upBand[upBand.length - 2]) {   // close price up cross the upBand
            if (holdAmount < 0) {   // holding short, close position
                Log(e.GetCurrency(), "close short position", "#FF0000")
                $.CoverShort(e, e.param.symbol, Math.abs(holdAmount))
                c.add(kIndex + 4, {x: r[r.length - 2].Time, color: 'red', shape: 'flag', title: 'close', text: "close short position"})
            }
            // open long
            Log(e.GetCurrency(), "open long position", "#FF0000")
            $.OpenLong(e, e.param.symbol, 10)
            c.add(kIndex + 4, {x: r[r.length - 2].Time, color: 'red', shape: 'flag', title: 'long', text: "open long position"})
        } else if (holdAmount >= 0 && r[r.length - 3].Close > downBand[downBand.length - 3] && r[r.length - 2].Close < downBand[downBand.length - 2]) {  // close price down cross the downBand
            if (holdAmount > 0) {   // holding long, close position
                Log(e.GetCurrency(), "close long position", "#FF0000")
                $.CoverLong(e, e.param.symbol, Math.abs(holdAmount))
                c.add(kIndex + 4, {x: r[r.length - 2].Time, color: 'green', shape: 'flag', title: 'close', text: "close long position"})
            }
            // open short
            Log(e.GetCurrency(), "open short position", "#FF0000")
            $.OpenShort(e, e.param.symbol, 10)
            c.add(kIndex + 4, {x: r[r.length - 2].Time, color: 'green', shape: 'flag', title: 'short', text: "open short position"})
        } else {
            // close position
            if (holdAmount > 0 && (r[r.length - 2].Close <= holdPrice * (1 - e.param.stopLoss) || r[r.length - 2].Close <= midLine[midLine.length - 2])) {   // if holding long position, close price is equal to or less than midline, stop loss according to open position price
                Log(e.GetCurrency(), "if midline is triggered or stop loss, close long position", "#FF0000")
                $.CoverLong(e, e.param.symbol, Math.abs(holdAmount))
                c.add(kIndex + 4, {x: r[r.length - 2].Time, color: 'green', shape: 'flag', title: 'close', text: "close long position"})
            } else if (holdAmount < 0 && (r[r.length - 2].Close >= holdPrice * (1 + e.param.stopLoss) || r[r.length - 2].Close >= midLine[midLine.length - 2])) {  // if holding short position, close price is equal to or more than midline, stop loss according to open position price
                Log(e.GetCurrency(), "if midline is triggered or stop loss, close short position", "#FF0000")
                $.CoverShort(e, e.param.symbol, Math.abs(holdAmount))
                c.add(kIndex + 4, {x: r[r.length - 2].Time, color: 'red', shape: 'flag', title: 'close', text: "close short position"})
            }
        }
        e.state.preBar = r[r.length - 1].Time
    }
}

function main() {
    var arrChartConfig = []
    if (arrParam.length != exchanges.length) {
        throw "The parameter and the exchange object do not match!"
    }
    var arrState = _G("arrState")
    _.each(exchanges, function(e, index) {
        if (e.GetName() != "Futures_Binance") {
            throw "The platform is not supported!"
        }
        e.param = arrParam[index]
        e.state = {lastBarTime: 0, symbol: e.param.symbol, currency: e.GetCurrency()}
        if (arrState) {
            if (arrState[index].symbol == e.param.symbol && arrState[index].currency == e.GetCurrency()) {
                Log("Recover:", e.state)
                e.state = arrState[index]
            } else {
                throw "The recovered data and the current setting do not match!"
            }
        }
        e.state.preBar = -1   // initially set -1
        e.SetContractType(e.param.symbol)
        Log(e.GetName(), e.GetLabel(), "Set contract:", e.param.symbol)
        arrChartConfig.push(createChartConfig(e.GetCurrency(), e.param.atrPeriod, e.param.emaPeriod, index))
    })
    var chart = Chart(arrChartConfig)
    chart.reset()

    while (true) {
        _.each(exchanges, function(e, index) {
            process(e, index + index * 4, chart)
            Sleep(500)
        })
    }
}

function onexit() {
    // record e.state
    var arrState = []
    _.each(exchanges, function(e) {
        arrState.push(e.state)
    })
    Log("Record:", arrState)
    _G("arrState", arrState)
}
Strategieparameter:
var params = '[{
        "symbol" : "swap",    // contract code
        "period" : 86400,     // K-line period; 86400 seconds indicates 1 day
        "stopLoss" : 0.07,    // ratio of stoploss; 0.07 means 7%
        "atrPeriod" : 10,     // ATR indicator parameter
        "emaPeriod" : 10,     // EMA indicator parameter
        "trackRatio" : 1,     // ratio of upBand or downBand
        "openRatio" : 0.1     // ratio of reserved open position (temporarily not supported)
    }, {
        "symbol" : "swap",
        "period" : 86400,
        "stopLoss" : 0.07,
        "atrPeriod" : 10,
        "emaPeriod" : 10,
        "trackRatio" : 1,
        "openRatio" : 0.1
    }]'
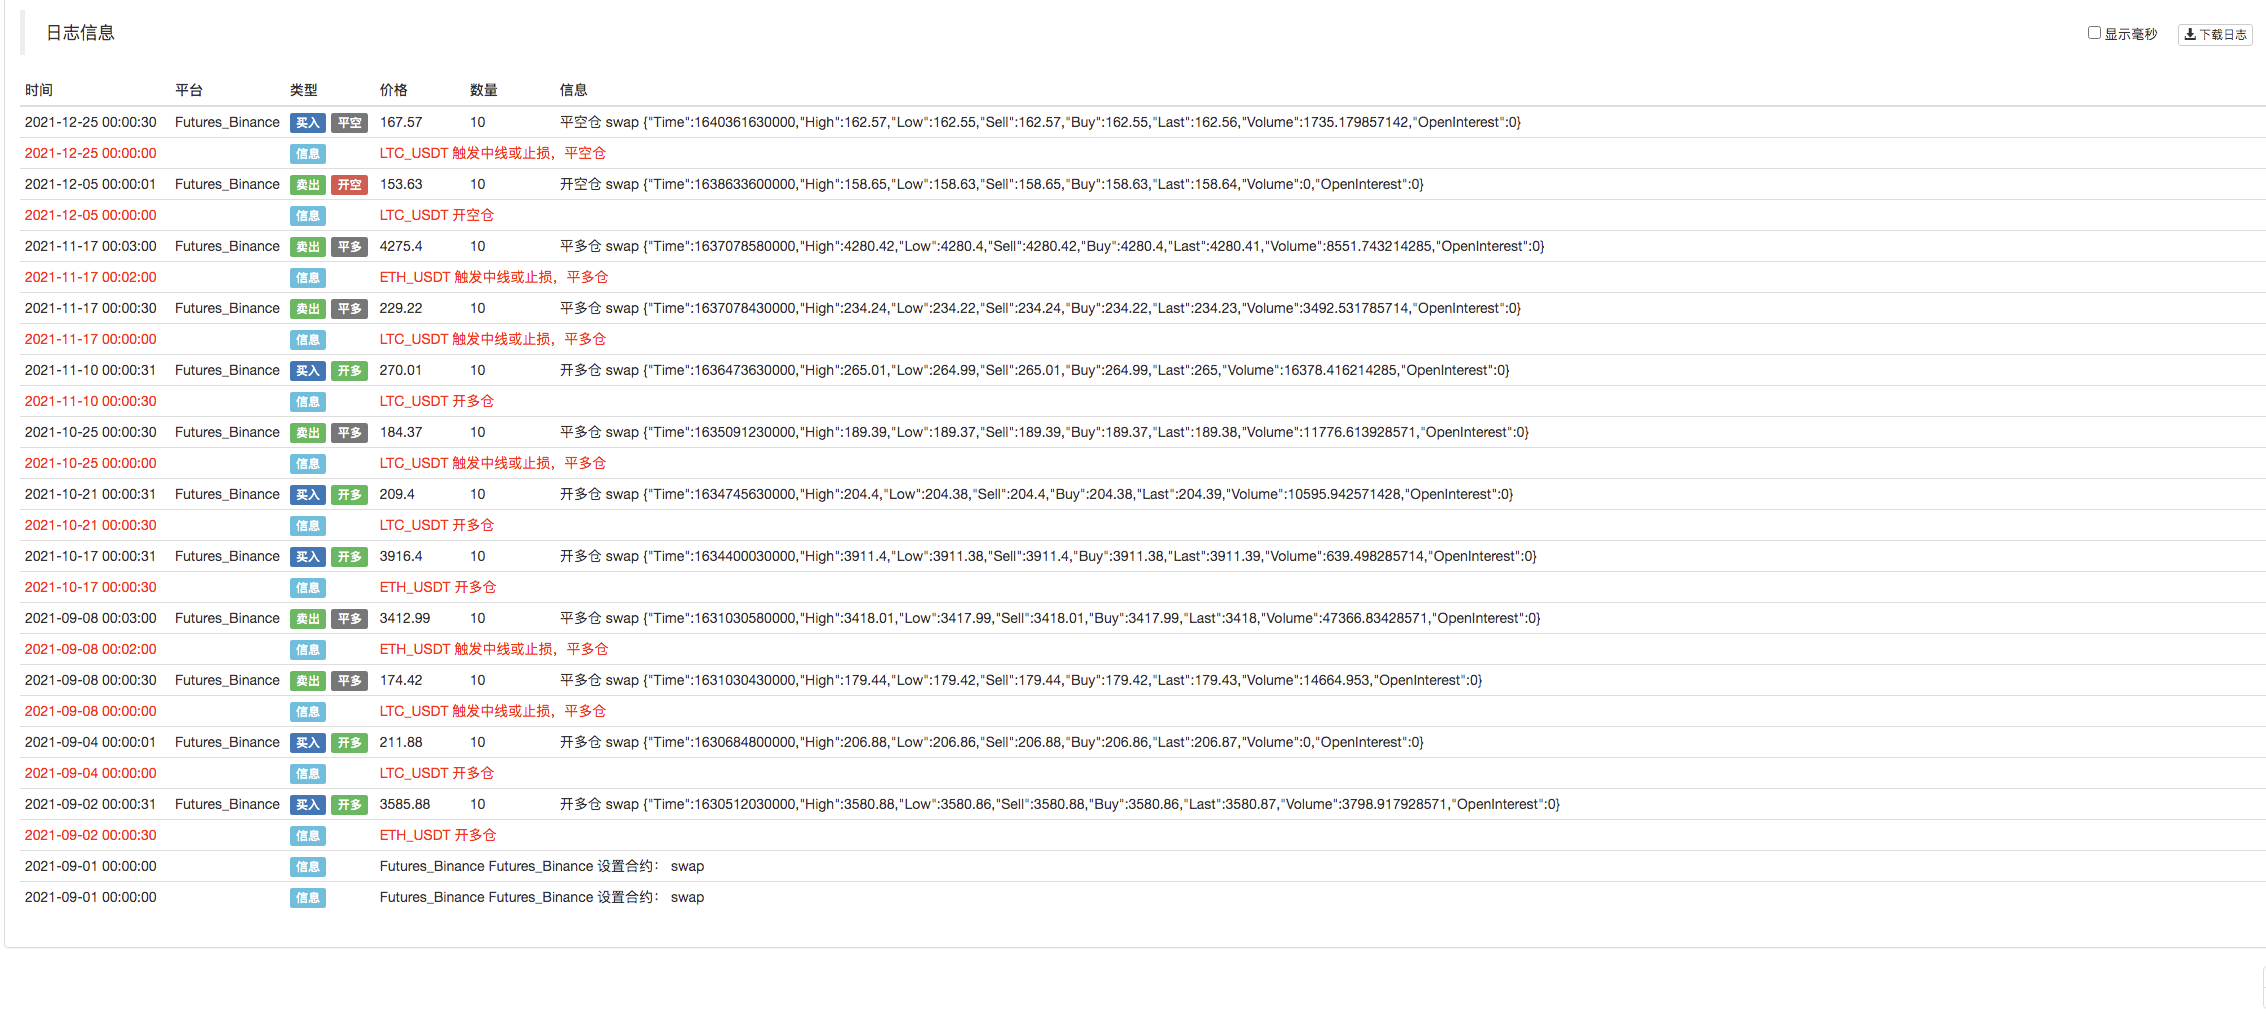
Zurückprüfung


Strategie Quellcode:https://www.fmz.com/strategy/339344
Die Strategie dient nur der Kommunikation und dem Studium; für den praktischen Gebrauch müssen Sie sie selbst modifizieren, anpassen und optimieren.
- Die Frage nach dem Gesichtswert
- dYdX-Strategie-Entwurfsbeispiel
- Erste Erforschung der Anwendung von Python Crawler auf FMZ
Crawling Binance Ankündigungsinhalt - Hedge-Strategie-Design-Forschung & Beispiel für offene Spot- und Futures-Orders
- Aktuelle Situation und empfohlene Anwendung der Finanzierungsrate-Strategie
- Strategie für einen doppelten gleitenden Durchschnitts-Brechpunkt von Kryptowährungs-Futures (Teaching)
- Strategie für einen doppelten gleitenden Durchschnitt mit mehreren Symbolen (Teaching)
- Realisierung von Fisher Indicator in JavaScript und Plotting auf FMZ
- Treuhänder
- 2021 Kryptowährungs-TAQ-Überprüfung & Einfachste verpasste Strategie der 10-fachen Erhöhung
- Aktualisieren! Kryptowährungs Futures Martingale Strategie
- Die Getrecords-Funktion kann keine K-Stringkarte in Sekunden erhalten
- Konstruktion eines FMZ-basierten Auftragsmanagementsystems (2)
- Die Volumen-Daten, die Getticker zurückgegeben hat, sind falsch.
- Gestaltung eines FMZ-basierten Auftragssynchronmanagementsystems (1)
- Entwerfen Sie eine Bibliothek mit mehreren Diagrammen
- Analogische Umgebung
- Ein 60-Zeilen-Code, der einen Gedanken verwirklicht.
- Ankündigung über die Modernisierung und Anpassung des FMZ-Rechnungswesens
- Mitteilung für Ghostwriting-Strategien auf FMZ