Trend nach Strategie auf Basis eines dynamischen Stop-Loss-Systems für den Dual-EMA-Crossover
Schriftsteller:ChaoZhang, Datum: 2024-01-29 09:57:20Tags:

Übersicht
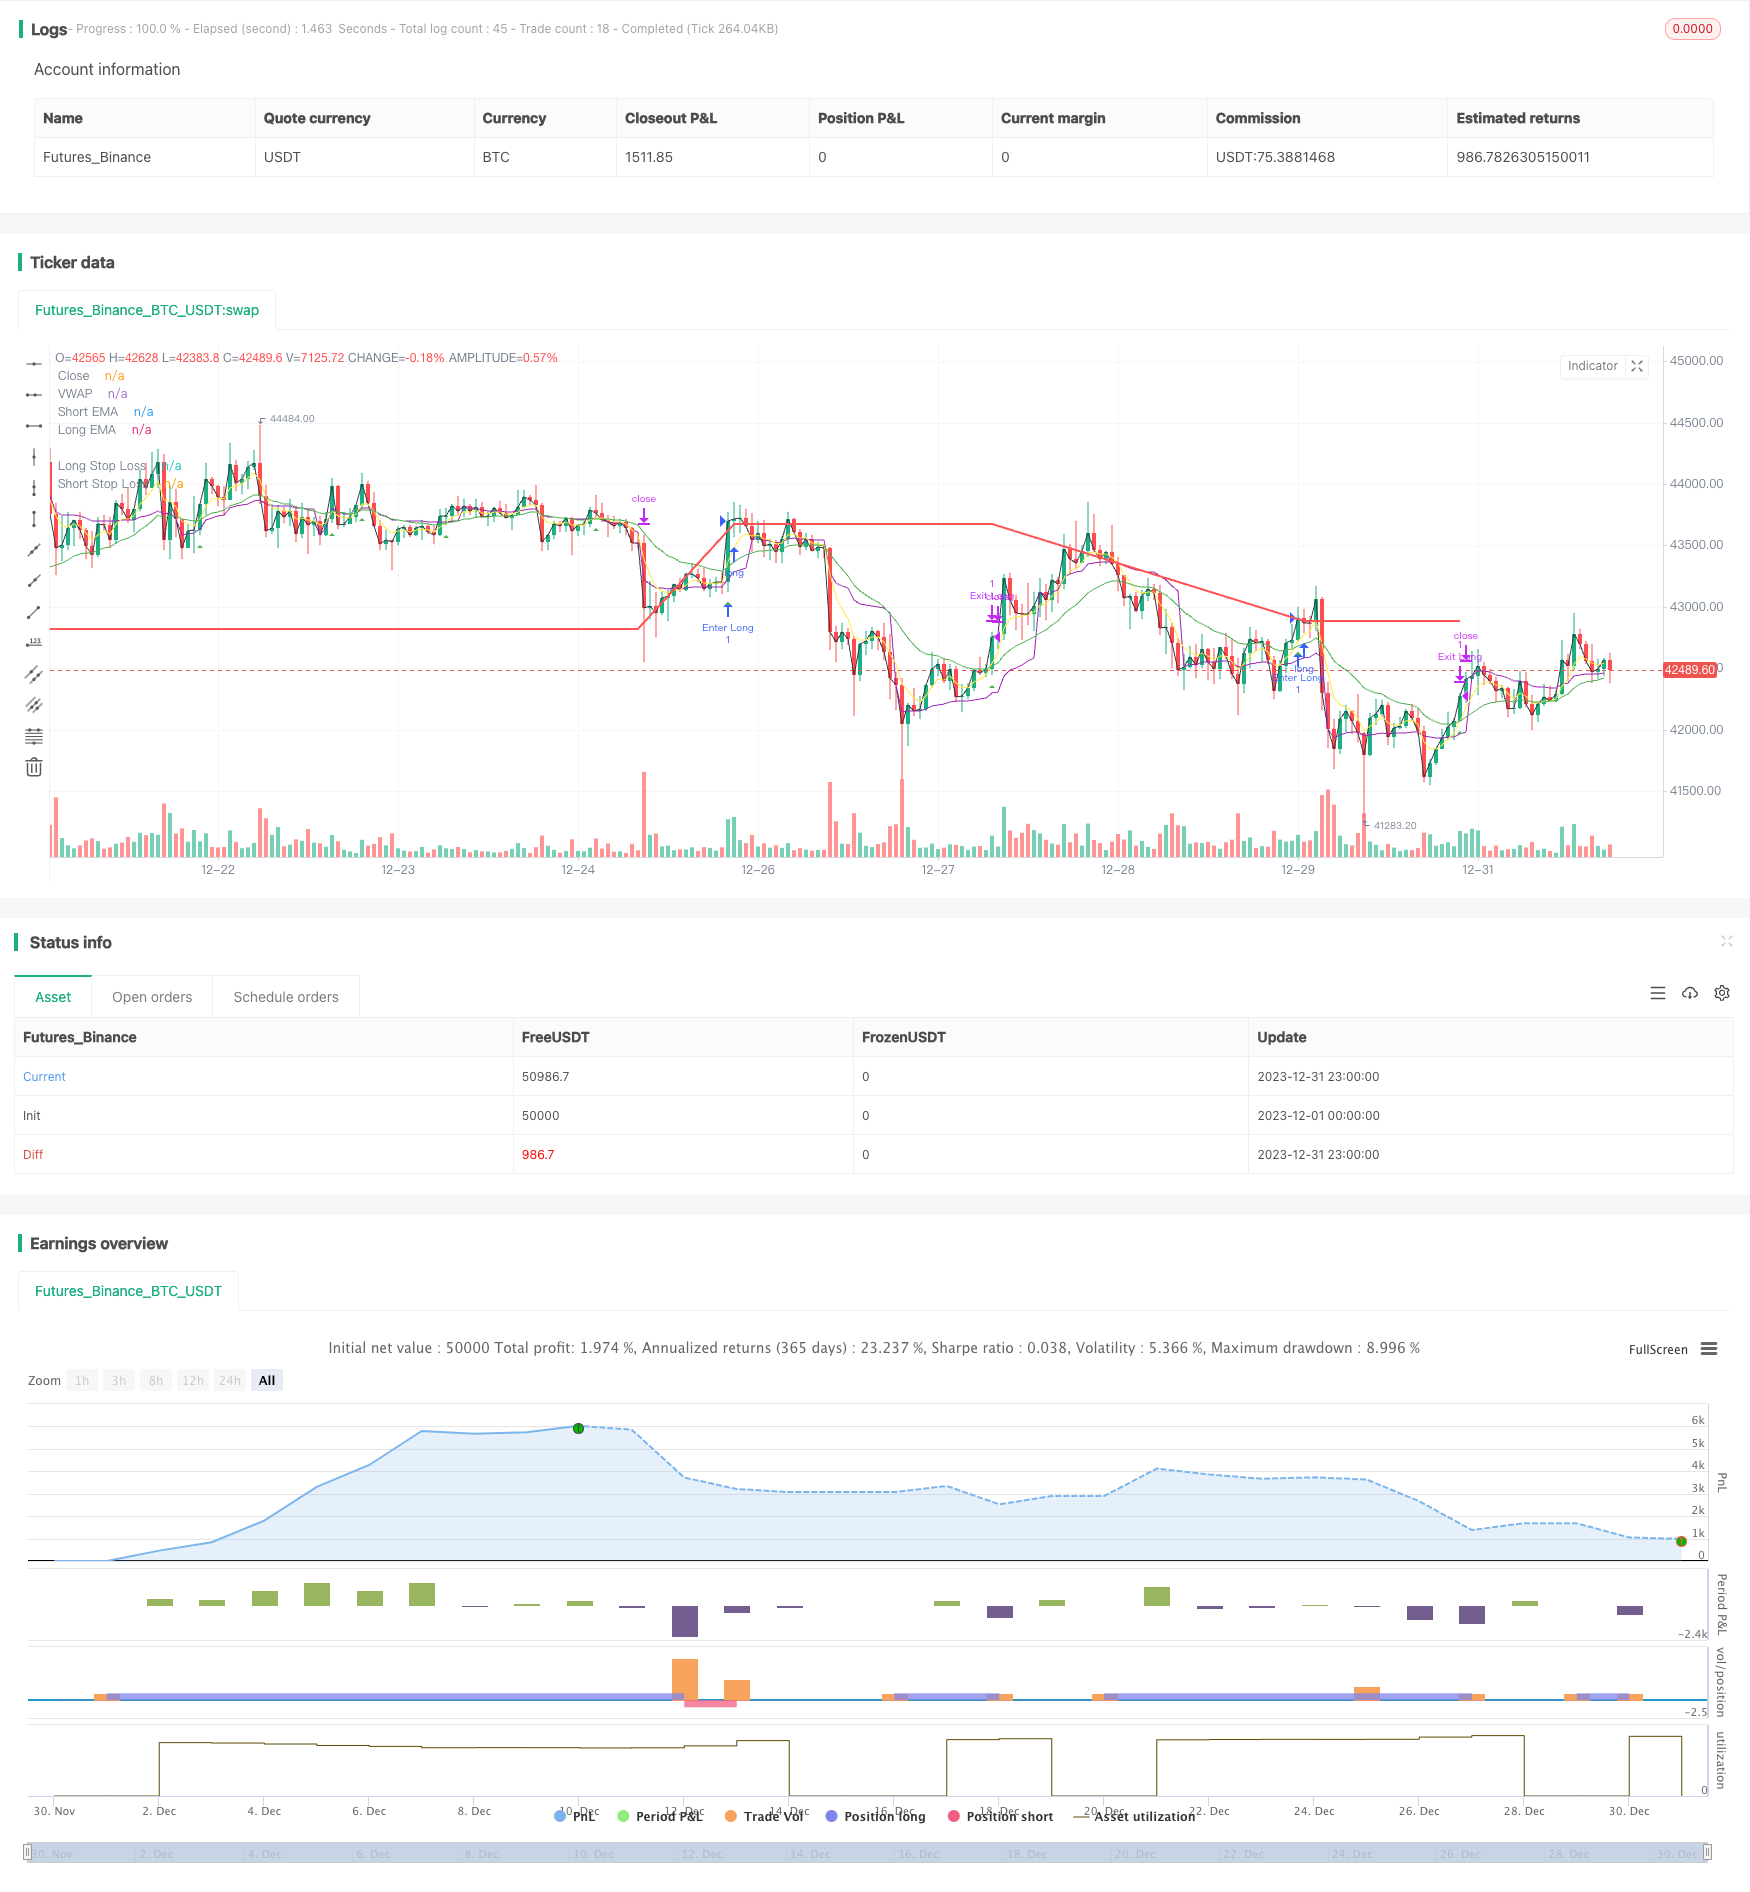
Diese Strategie nutzt das goldene Kreuz und das tote Kreuz der EMA-Linien, um den Trend in zwei Richtungen zu verfolgen, und setzt dynamische Stop-Loss-Linien für Long- und Short-Positionen ein, um die Trendbewegungen auf dem Markt zu erfassen.
Strategie Logik
- Berechnung der schnellen EMA-Linie (5-Tage) und der langsamen EMA-Linie (20-Tage)
- Gehen Sie lang, wenn die schnelle Linie über die langsame Linie von unten kreuzt; Gehen Sie kurz, wenn die schnelle Linie unter die langsame Linie von oben kreuzt
- Nach dem Long-Entry wird ein dynamischer Stop-Loss zum Einstiegspreis festgelegt * (1 - Long-Stop-Loss-Prozent); nach dem Short-Entry wird ein dynamischer Stop-Loss zum Einstiegspreis festgelegt * (1 + Short-Stop-Loss-Prozent)
- Ausgangsposition mit Stop-Loss, sobald der Preis das Stop-Loss-Niveau erreicht
Analyse der Vorteile
- EMA-Linien haben eine stärkere Fähigkeit, Trends zu verfolgen.
- Dynamischer Stop-Loss bewegt sich zusammen mit dem Gewinn, maximiert den Trend-Catching-Gewinn
- Zusätzlicher Filter mit vwap vermeidet, in Whipsaws gefangen zu werden und verbessert die Signalqualität
Risikoanalyse
- Als reine Trendstrategie ist es anfällig für unterschiedliche Märkte mit Schlagsawen.
- Zu lockeres Stop-Loss kann zu vergrößerten Verlusten führen
- Verzögerung der EMA-Crossover-Signale kann die besten Einstiegspunkte verpassen
Verbesserungen wie das ATR-basierte Risikomanagement, die Optimierung von Stop-Loss-Regeln, das Hinzufügen von Filterindikatoren usw. können dazu beitragen, die Strategie zu verbessern.
Anweisungen zur Verbesserung
- Einbeziehung dynamischer Stop-Loss-Indikatoren wie ATR oder DONCH zur besseren Anpassung von Stopps
- Fügen Sie mehr Filterindikatoren wie MACD, KDJ hinzu, um schlechte Trades zu vermeiden
- Optimieren von Parametern zur Suche nach der besten Kombination von EMA-Längen
- Einsatz von Methoden des maschinellen Lernens zur Entdeckung optimaler Parameter
Schlussfolgerung
Dies ist ein sehr typischer Trend nach Strategie. Dual EMA Crossover mit dynamischem Stop Loss kann effektiv in Trendgewinne sperren. In der Zwischenzeit bestehen immer noch Risiken wie verzögerte Signale und überweite Stops. Durch Parameter-Tuning, Risikomanagement, Filterzusätze usw. kann eine weitere Verfeinerung zu besseren Ergebnissen führen.
/*backtest
start: 2023-12-01 00:00:00
end: 2023-12-31 23:59:59
period: 1h
basePeriod: 15m
exchanges: [{"eid":"Futures_Binance","currency":"BTC_USDT"}]
*/

//@version=5

strategy("EMA Crossover Strategy", shorttitle="EMAC", overlay=true,calc_on_every_tick=true)

// Input parameters
shortEmaLength = input(5, title="Short EMA Length")
longEmaLength = input(20, title="Long EMA Length")
priceEmaLength = input(1, title="Price EMA Length")

// Set stop loss level with input options (optional)
longLossPerc = input.float(0.05, title="Long Stop Loss (%)",
     minval=0.0, step=0.1) * 0.01

shortLossPerc = input.float(0.05, title="Short Stop Loss (%)",
     minval=0.0, step=0.1) * 0.01

// Calculating indicators
shortEma = ta.ema(close, shortEmaLength)
longEma = ta.ema(close, longEmaLength)
//priceEma = ta.ema(close, priceEmaLength)
vwap = ta.vwap(close)

// Long entry conditions
longCondition = ta.crossover(shortEma, longEma) and close > vwap
// Short entry conditions
shortCondition = ta.crossunder(shortEma, longEma) and close > vwap

// STEP 2:
// Determine stop loss price
longStopPrice  = strategy.position_avg_price * (1 - longLossPerc)
shortStopPrice = strategy.position_avg_price * (1 + shortLossPerc)


if (longCondition)
    strategy.entry("Enter Long", strategy.long)
    strategy.exit("Exit Long",from_entry = "Enter Long",stop= longStopPrice)
plotshape(series=longCondition, title="Long Signal", color=color.green, style=shape.triangleup, location=location.belowbar)


if (shortCondition)
    strategy.entry("Enter Short", strategy.short)
    strategy.exit("Exit Short", from_entry = "Enter Short",stop = shortStopPrice)
plotshape(series=shortCondition, title="Short Signal", color=color.red, style=shape.triangledown, location=location.abovebar)

// Stop loss levels
//longStopLoss = (1 - stopLossPercent) * close
//shortStopLoss = (1 + stopLossPercent) * close

// Exit conditions
//strategy.exit("Long", from_entry="Long", loss=longStopLoss)
//strategy.exit("Short", from_entry="Short", loss=shortStopLoss)

// Plotting indicators on the chart
plot(shortEma, color=color.yellow, title="Short EMA")
plot(longEma, color=color.green, title="Long EMA")
plot(close, color=color.black, title="Close")
plot(vwap, color=color.purple, title="VWAP")

// Plot stop loss values for confirmation
plot(strategy.position_size > 0 ? longStopPrice : na,
     color=color.red, style=plot.style_line,
     linewidth=2, title="Long Stop Loss")

plot(strategy.position_size < 0 ? shortStopPrice : na,
     color=color.blue, style=plot.style_line,
     linewidth=2, title="Short Stop Loss")
// Plotting stop loss lines
//plot(longStopLoss, color=color.red, title="Long Stop Loss", linewidth=2, style=plot.style_line)
//plot(shortStopLoss, color=color.aqua, title="Short Stop Loss", linewidth=2, style=plot.style_line)
- Zyklusübergreifende Arbitragestrategie auf der Grundlage mehrerer Indikatoren
- Die Bollinger-Band-Breakout-Strategie ist eine langfristige Dynamik-Strategie
- Flawless Victory Quantitative Trading Strategy auf Basis von Double BB Indikatoren und RSI
- Auf RSI basierende Stop-Loss- und Take-Profit-Strategie
- Strategie für den Durchbruch des gleitenden Durchschnittskanals
- Strategie zur Festzeit-Rücklaufprüfung
- Zeit- und Raumoptimierte Multi-Zeitrahmen-MACD-Strategie
- Quantitative Handelsstrategie auf Basis von RSI und MFI
- Multi-Indikator-Gesamthandelsstrategie
- Kurzfristige Handelsstrategie der Crossover EMA
- Auftritt des Bullenmarktes Darvas Box Kaufstrategie
- Die relative Dynamikstrategie
- Wellenentwicklung und VWMA-basierte Entwicklung nach Quant-Strategie
- Strategie zur Kombination von Doppel gleitenden Durchschnitten und Williams-Durchschnitten
- Adaptive Dreifach-Supertrend-Strategie
- Strategie für die Verlagerung des gleitenden Durchschnitts
- Mengenmäßige Handelsstrategie mit mehreren Indikatoren
- Market Cypher Welle B Automatische Handelsstrategie
- Wichtige Strategie zur Umkehrung von Backtests
- Die drei EMA Stochastic RSI Crossover Golden Cross-Strategie