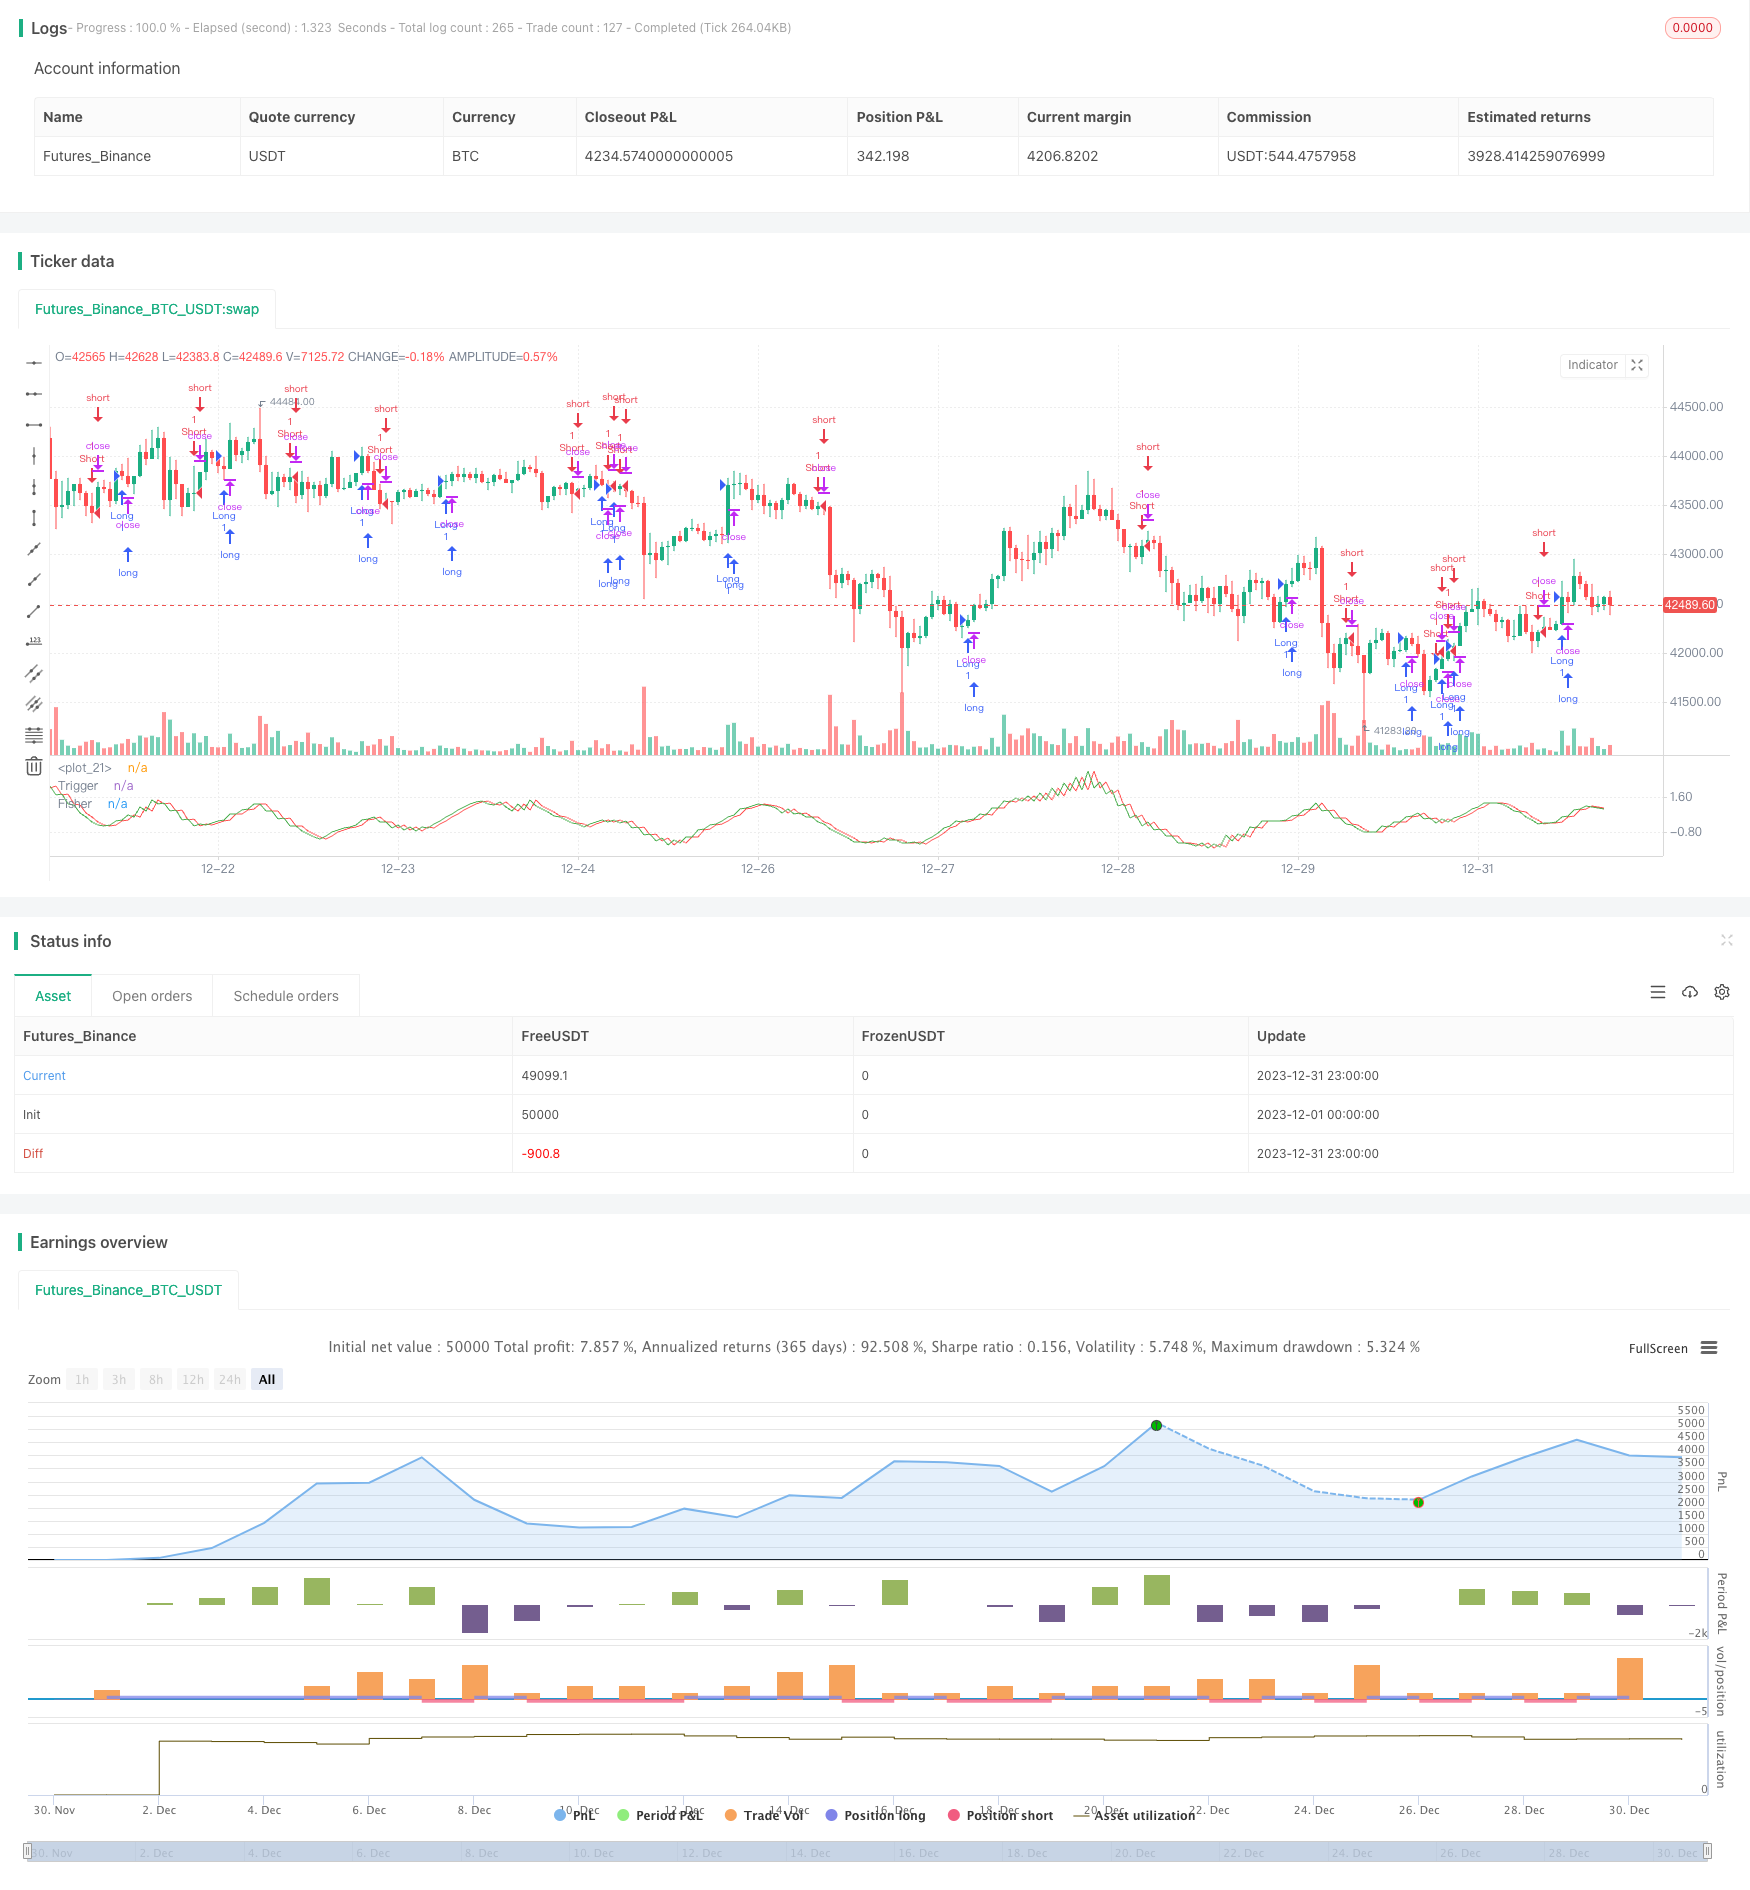
Overview
This strategy is a backtesting strategy based on the Fisher transform indicator. The Fisher transform formula can convert price data into a normal distribution to identify price extremes and turning points. This strategy combines the Fisher transform indicator to determine price trends and achieve automated trading.
Strategy Principle
- Calculate the HL2 indicator
- Calculate the maximum xMaxH and minimum xMinL of HL2 in the most recent Length periods
- Calculate the Fisher transform indicator:
- nValue1 is 0.33×(standardized HL2)+0.67×nValue1 of the previous period
- nValue2 limits nValue1 between -0.99 and 0.99
- nFish is the logarithmic transformation of nValue2
- Determine whether nFish is positive or negative to determine the position direction
- Position signal possig, if reverse trading is set, take the opposite position
- Entry signal: possig=1 for long, possig=-1 for short
Advantage Analysis
- The Fisher transform indicator can identify price extremes and turning points to accurately determine trends
- Filtering fluctuations by combining HL2 indicators increases win rate
- Reverse trading can be set to adapt to different market environments
- Automated trading without manual judgment reduces trading costs
Risk Analysis
- The Fisher transform indicator has lag and may miss short-term price changes
- High risk of stop loss in volatile trends
- Improper reverse trade settings can lead to systemic erroneous trades
- Lack of cross cycle verification, there is a certain false positive risk
Risk Solutions:
- Adjust parameters appropriately to shorten delays
- Increase stop loss range to control single transaction loss
- Optimize reverse trades combined with other indicators for filtering
- Increase multiple verification mechanisms of trends, price levels, cycles etc
Strategy Optimization Directions
- Combine trend indicators to ensure major trends are consistent
- Increase cyclic indicators to improve price reversal judgment accuracy
- Multi-timeframe verification to avoid false positives
- Dynamically adjust stop loss range
- Optimize parameters to maximize win rate and profit factor
The above optimizations can further improve the win rate of the strategy, lock in profits, control risks, and obtain more stable and efficient trading results.
Summary
The Fisher transform indicator backtesting strategy integrates the Fisher transform indicator to determine price reversal points and trend directions. This strategy has accurate judgments and a high degree of automation. Through parameter optimization, stable and efficient trading results can be obtained. But there are also certain risks such as lag and false positives. Further optimization is needed by introducing multiple verification mechanisms and dynamic adjustment methods to make the strategy more flexible and robust.
/*backtest
start: 2023-12-01 00:00:00
end: 2023-12-31 23:59:59
period: 1h
basePeriod: 15m
exchanges: [{"eid":"Futures_Binance","currency":"BTC_USDT"}]
*/

//@version = 2
////////////////////////////////////////////////////////////
//  Copyright by HPotter v2.0 22/12/2016
// 	Market prices do not have a Gaussian probability density function
// 	as many traders think. Their probability curve is not bell-shaped.
// 	But trader can create a nearly Gaussian PDF for prices by normalizing
// 	them or creating a normalized indicator such as the relative strength
// 	index and applying the Fisher transform. Such a transformed output
// 	creates the peak swings as relatively rare events.
// 	Fisher transform formula is: y = 0.5 * ln ((1+x)/(1-x))
// 	The sharp turning points of these peak swings clearly and unambiguously
// 	identify price reversals in a timely manner.
//
//  For signal used zero.
// You can change long to short in the Input Settings
// Please, use it only for learning or paper trading. Do not for real trading.
////////////////////////////////////////////////////////////
strategy(title="Fisher Transform Indicator by Ehlers Backtest", shorttitle="Fisher Transform Indicator by Ehlers")
Length = input(10, minval=1)
reverse = input(false, title="Trade reverse")
hline(1, color=white)
xHL2 = hl2
xMaxH = highest(xHL2, Length)
xMinL = lowest(xHL2,Length)
nValue1 = 0.33 * 2 * ((xHL2 - xMinL) / (xMaxH - xMinL) - 0.5) + 0.67 * nz(nValue1[1])
nValue2 =   iff(nValue1 > .99,  .999,
	         iff(nValue1 < -.99, -.999, nValue1))
nFish = 0.5 * log((1 + nValue2) / (1 - nValue2)) + 0.5 * nz(nFish[1])
pos = iff(nFish > 0, 1,
	   iff(nFish < 0, -1, nz(pos[1], 0)))
possig = iff(reverse and pos == 1, -1,
          iff(reverse and pos == -1, 1, pos))
if (possig == 1)
    strategy.entry("Long", strategy.long)
if (possig == -1)
    strategy.entry("Short", strategy.short)
// barcolor(possig == -1 ? red: possig == 1 ? green : blue )
plot(nFish, color=green, title="Fisher")
plot(nz(nFish[1]), color=red, title="Trigger")