Breakout Trading System
Author: ChaoZhang, Date: 2024-02-21 14:02:28Tags:

Overview
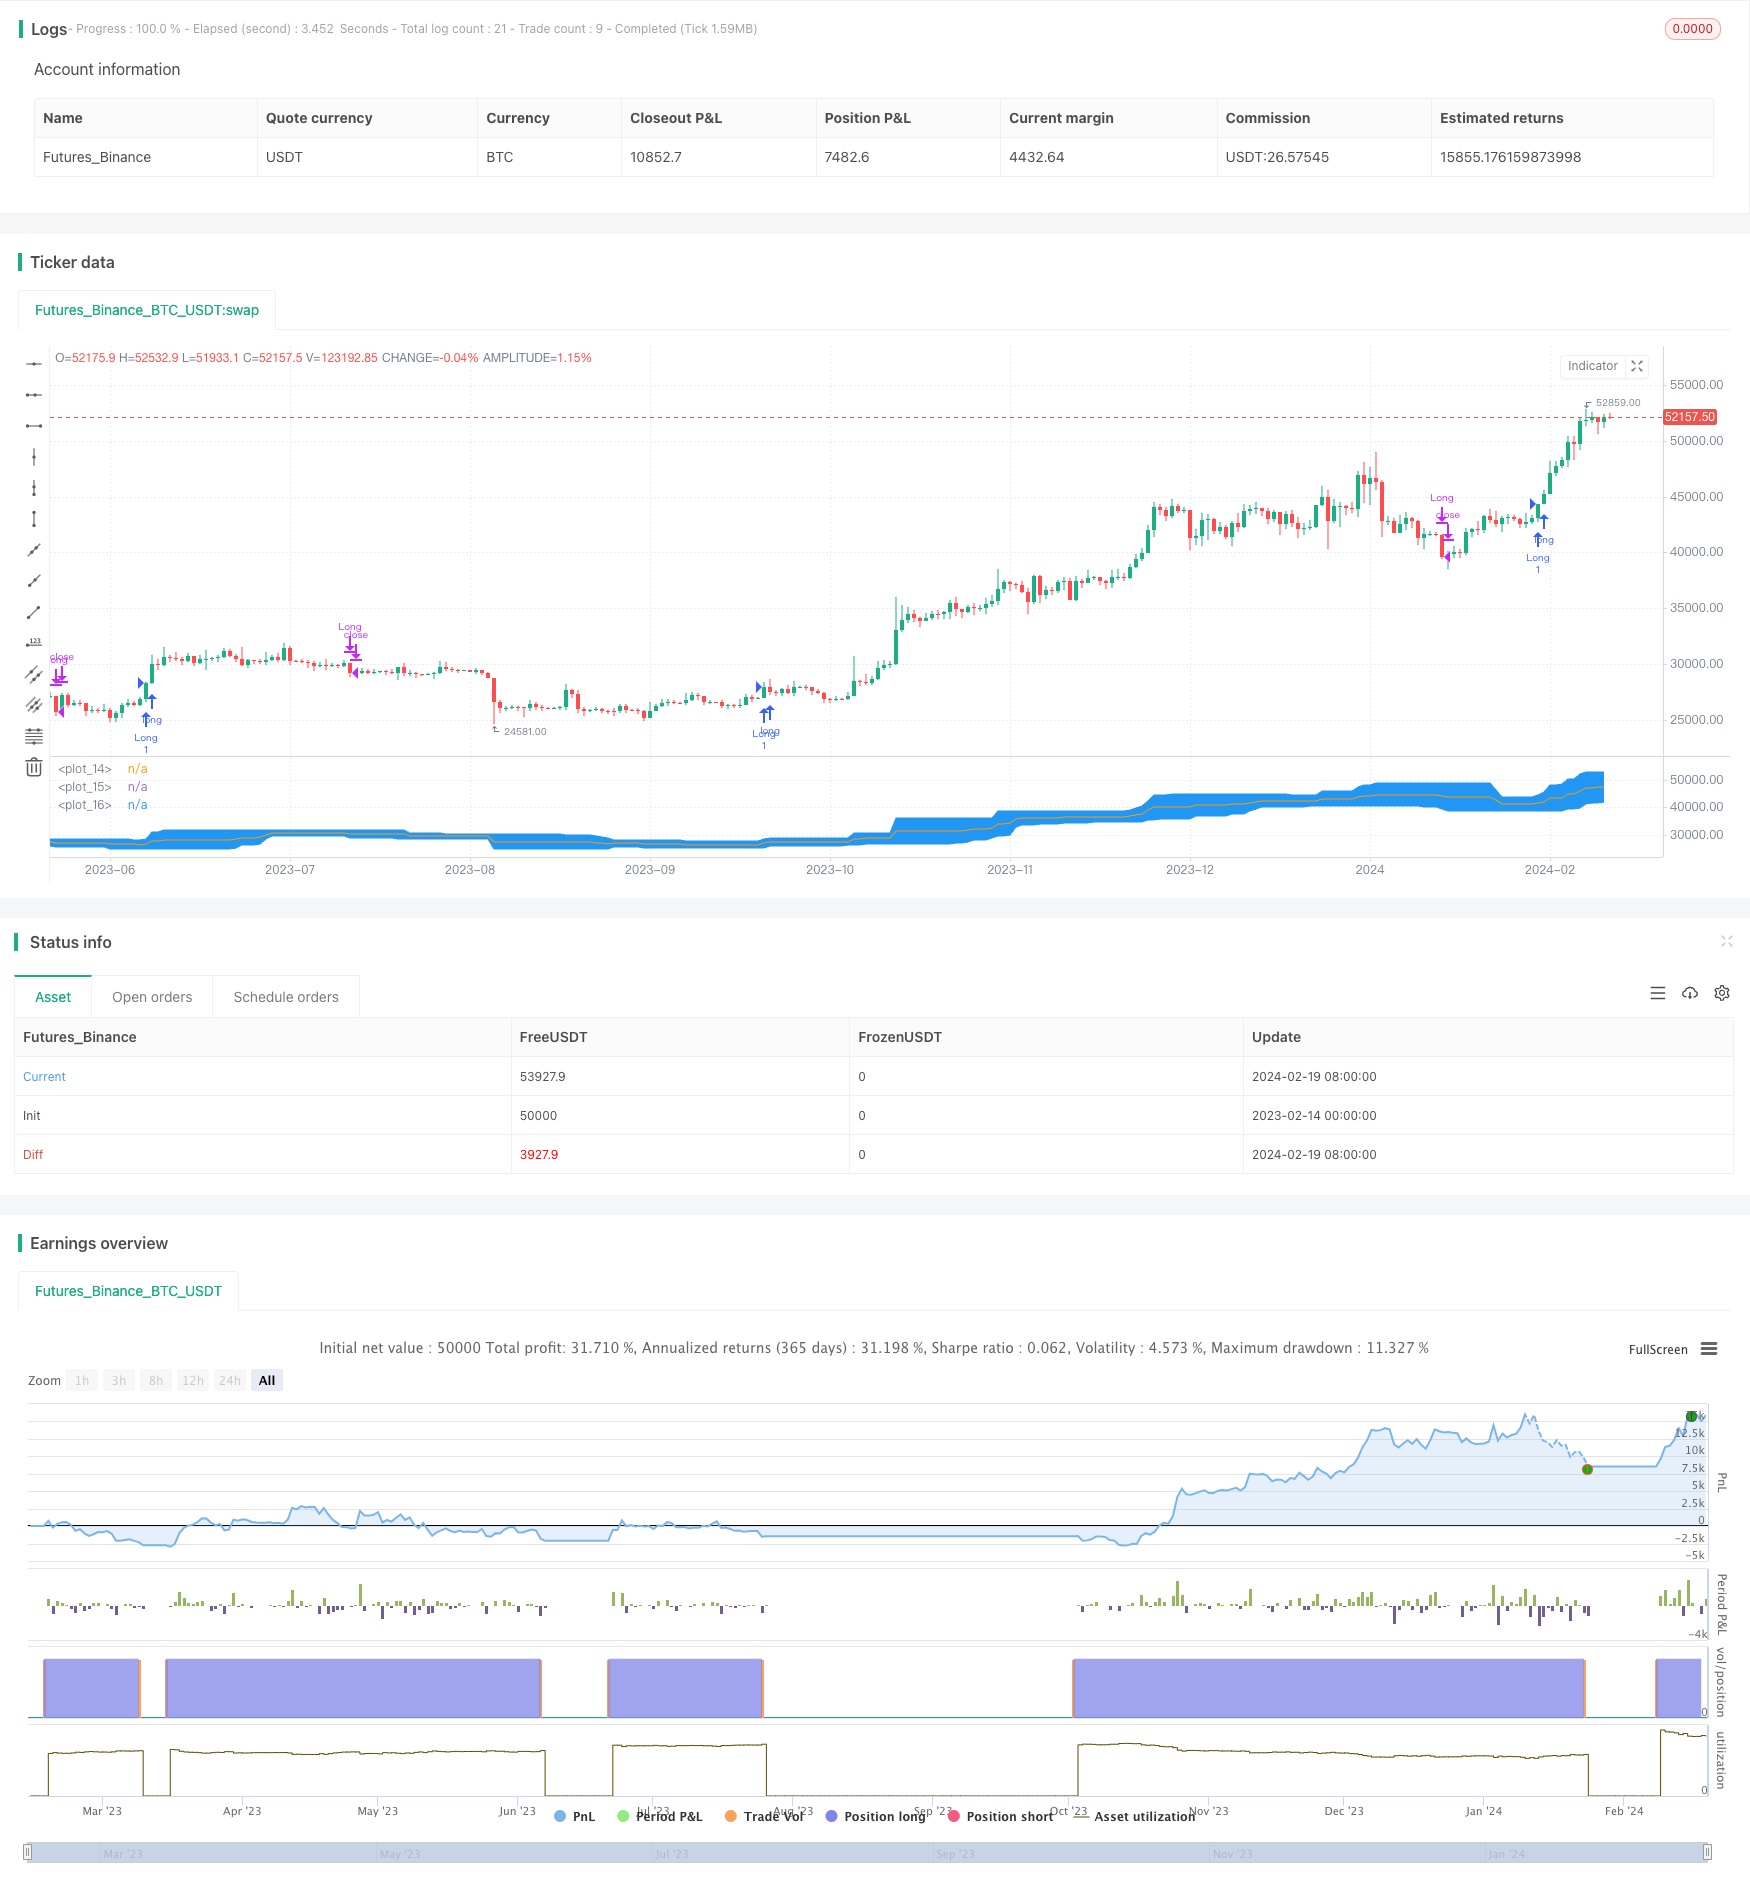
This strategy is a breakout trading system that mainly buys and sells based on the breakthrough of prices. The system uses Bollinger Bands to determine the price breakthrough area. When the price breaks through the lower rail of the Bollinger Band upwards, a buy order will be placed. When the price breaks through the middle rail or lower rail of the Bollinger Band downwards, a sell order will be placed.
Strategy Principle
This strategy uses Bollinger Bands to determine price breakthrough areas. Bollinger Bands consist of a simple moving average line of n days and its standard deviation multiplier. Here we calculate the 20-day moving average of highest price and lowest price to determine the upper and lower rail of Bollinger Bands, as well as the average of upper and lower rail as the baseline.
When the close price breaks through the lower rail upwards, it indicates that the price starts to go up which is a buy signal. When the close price breaks through the middle or lower rail downwards, it indicates that the rising trend ends and positions need to be sold out. This strategy takes advantage of the tendency of prices to continue running up or down after the breakthrough to make profits.
Advantage Analysis
- The strategy makes use of the trending and inertia of prices which is consistent with the essential characteristics of the market
- Bollinger Bands clearly indicate breakthrough prices
- The strategy logic is simple and clear, easy to understand and modify
- Stop loss conditions can be set to control risks
Risk Analysis
- Bollinger Bands cannot completely predict price behavior, prices may fluctuate dramatically
- Breakthrough signals may be wrong, leading to trading losses
- Relying solely on price breakthroughs to determine trading time can easily be affected by market noise
Solutions:
- Combine other indicators to confirm breakthrough signals
- Adjust parameters appropriately to ensure effective breakthrough signals
- Set stop loss to control single loss
Optimization Directions
- Test performances under different parameters and select the optimal parameters
- Incorporate other indicators to filter out false breakouts, such as trading volume
- Combine trend and reversal strategies for trading in different market environments
- Optimize based on parameter settings for different varieties
- Incorporate machine learning algorithms to predict price trends and key price points
Summary
This is a price breakthrough trading strategy based on Bollinger Bands. It takes advantage of the characteristics of price breakthroughs to identify trading opportunities. The advantages are that it is simple, easy to implement; the disadvantages are that there may be false breakouts leading to losses. We can optimize this strategy by adjusting parameters, incorporating other indicators and setting stop loss to achieve good results in backtesting and live trading. In general, this strategy is suitable for market environments that can fully tap the trending tendency of prices.
/*backtest
start: 2023-02-14 00:00:00
end: 2024-02-20 00:00:00
period: 1d
basePeriod: 1h
exchanges: [{"eid":"Futures_Binance","currency":"BTC_USDT"}]
*/

// This source code is subject to the terms of the Mozilla Public License 2.0 at https://mozilla.org/MPL/2.0

//Break out trading system works best in a weekly chart and daily chart of Nifty and BankNifty
//@version=4

strategy("Eswar New",shorttitle = "ESW")
length = input(20, minval=1)
exit = input(1, minval=1, maxval=2,title = "Exit Option") // Use Option 1 to exit using lower band; Use Option 2 to exit using basis line

lower = lowest(length)
upper = highest(length)
basis = avg(upper, lower)

l = plot(lower, color=color.blue)
u = plot(upper, color=color.blue)
plot(basis, color=color.orange)
fill(u, l, color=color.blue)

longCondition = crossover(close,upper[1])
if (longCondition)
    strategy.entry("Long", strategy.long)

if(exit==1)
    if (crossunder(close,lower[1]))
        strategy.close("Long")

if(exit==2)
    if (crossunder(close,basis[1]))
        strategy.close("Long")
- Dual Moving Average Strategy
- Breakout Bollinger Bands Oscillation Trading Strategy
- Trading Psychology Balancing Strategy
- Quantitative Trading Strategy Based on Double Moving Average Crossover
- Best ATR Stop Multiple Strategy
- Bollinger Crossing Death Golden Strategy
- Reversal Trading Strategy with Bollinger Bands, RSI, ADX and ATR
- DEMA Crossover Trend Following Strategy
- Extreme Reversal Setup Strategy
- OBV and CCI Indicators Based Trend Following Strategy
- Multi-timeframe Bollinger Bands Breakout Strategy Incorporating RSI
- Momentum Indicator Aggregation Trading Strategy
- Multi-indicator Quant Trading Strategy
- TradingVMA – Variable Moving Average Trading Strategy
- RSI Divergence Strategy
- Dual Donchian Channel Breakout Strategy
- Bollinger Bands Breakout Trading Strategy
- EMA Breakthrough Trap Strategy
- Golden Cross Dead Cross Trading Strategy
- Supertrend Based Multitimeframe Trend Tracking Strategy