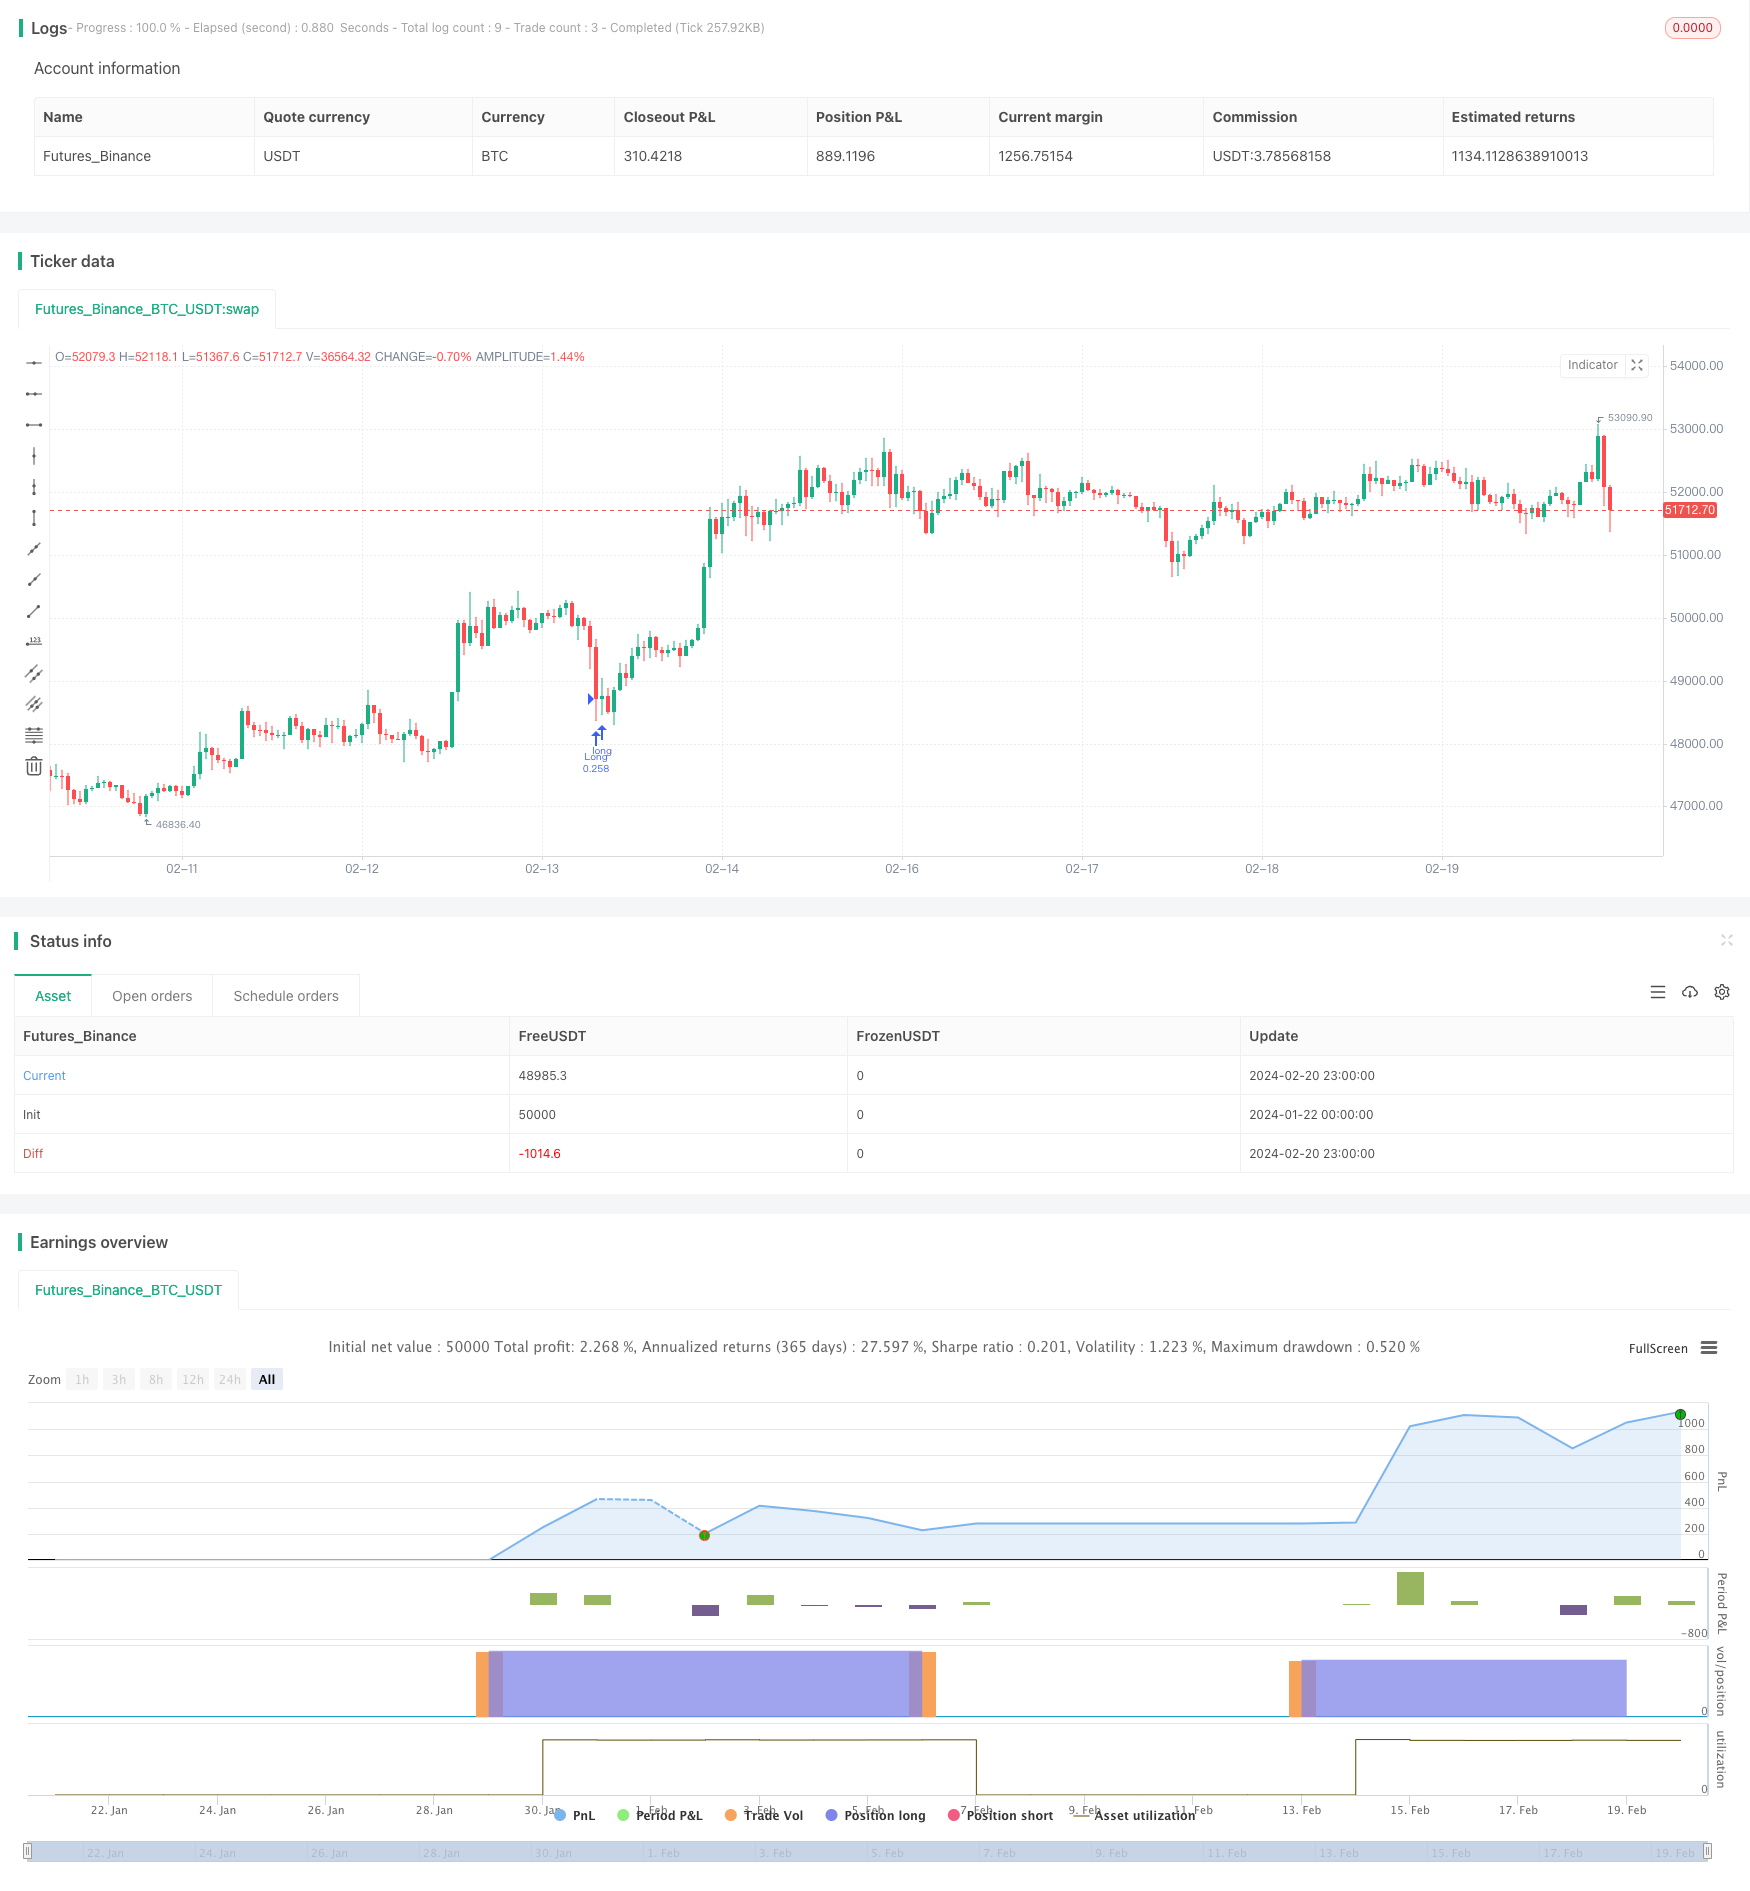
The Oscillating Breakthrough Strategy
Author: ChaoZhang, Date: 2024-02-22 17:15:01Tags:

Overview
The Oscillating Breakthrough Strategy is an active trading strategy for mainstream cryptocurrencies using a 15-minute timeframe. It utilizes technical indicators to identify market trends, discover potential breakthrough points, and effectively manage risks through stop-loss settings.
Strategy Principles
The strategy employs two Simple Moving Averages (SMA50 and SMA200) to determine the market trend direction. When SMA50 crosses above SMA200, it’s a bullish signal, and vice versa for bearish signals.
The Relative Strength Index (RSI) is used to judge overbought/oversold conditions. When the RSI falls below the set oversold region (default 40), it indicates a potential buy signal.
The specific trading logic is:
- RSI below 40 and close price above SMA200 constitutes the buy condition;
- Enter long position;
- Set stop loss at 5% below entry price;
- If SMA50 crosses below SMA200 and RSI goes above 50, close position to lock in profits.
The strategy is simple and straightforward, seeking potential breakthrough points through dual confirmation. The stop loss prevents losing positions from getting out of hands, while SMA crossovers act as exit signals.
Advantage Analysis
The strategy has the following advantages:
- Simple to implement;
- False breakouts filtered through dual moving averages, ensuring validity;
- RSI identifies oversold conditions for opportunities;
- Embedded stop loss to actively control risks;
- SMA crossovers as exit mechanism.
Risk Analysis
There are also some risks:
- Stop loss could be penetrated during violent market swings;
- Improper SMA periods may cause missing trends;
- Excessive time spent out of trades in bull markets impacts profits.
Improvements can be made via:
- Dynamic stop loss levels;
- SMA optimization;
- Considering more factors for holding decisions.
Summary
In summary, the Oscillating Breakthrough Strategy is a simple and practical short-term strategy. With easy operation, controllable risks etc., it suits novice crypto traders. Further optimizations can enable stable profits across more market environments.
/*backtest
start: 2024-01-22 00:00:00
end: 2024-02-21 00:00:00
period: 1h
basePeriod: 15m
exchanges: [{"eid":"Futures_Binance","currency":"BTC_USDT"}]
*/

// This source code is subject to the terms of the Mozilla Public License 2.0 at https://mozilla.org/MPL/2.0/
// © Wielkieef


//@version=5
strategy("Crypto Sniper [15min]", shorttitle="ST Strategy", overlay=true, pyramiding=1, initial_capital=10000, default_qty_type=strategy.percent_of_equity, default_qty_value=25, calc_on_order_fills=false, slippage=0, commission_type=strategy.commission.percent, commission_value=0.03)

sma50Length = input(90, title=" SMA50 Length", group="Simple Moving Average")
sma200Length = input(170, title=" SMA200 Length", group="Simple Moving Average")
rsiLength = input(14, title=" RSI Length", group="Relative Strenght Index")
overSoldLevel = input(40, title=" Oversold Level", group="Relative Strenght Index")
sl = input.float(5.0, '% Stop Loss', step=0.1)

rsi = ta.rsi(close, rsiLength)
sma50 = ta.sma(close, sma50Length)
sma200 = ta.sma(close, sma200Length)

longCondition = rsi < overSoldLevel and close > sma200

if (longCondition)
    strategy.entry("Long", strategy.long)

stopLossPrice = strategy.position_avg_price * (1 - sl / 100)
strategy.exit("Stop Loss", stop=stopLossPrice)

if (ta.crossunder(sma200, sma50) and rsi >= 50)
    strategy.close("Long")

Bar_color = ta.crossunder(sma200, sma50) and rsi >= 50 ? color.orange : rsi < overSoldLevel ? color.maroon : strategy.position_avg_price != 1 ? color.green : color.gray

barcolor(color=Bar_color)


//by wielkieef
- Momentum Breakout EMA Crossover Strategy
- Trading Dynamic Trend Tracking Strategy
- MACD Momentum with MA Strategy
- EMA Crossover Trading Strategy
- Simple Cryptocurrency Trading Strategy Based on RSI
- Quantitative Trading Strategy Based on Price Crossover with SMA
- Dual Moving Average Crossover Strategy with Stop Loss and Take Profit
- The Momentum Tracking and Trend Strategy
- Trend Following Strategy Based on MA Lines
- Trend Following Strategy Based on Bollinger Bands
- Adaptive Moving Average Trading Strategy
- RSI Golden Cross Short Strategy
- Dual Moving Average and Bollinger Band Combination Trend Tracking Strategy
- Adaptive Fluctuation Strategy Based on Quantitative Range Breakthrough
- Bull Flag Breakout Strategy
- The Moving Average Crossover Trading Strategy
- Moving Average Crossover Gold Trading Strategy
- EMA and MACD Trend Following Strategy
- Moving Average Crossover MACD Trading Strategy
- Super Trend Daily Reversal Strategy