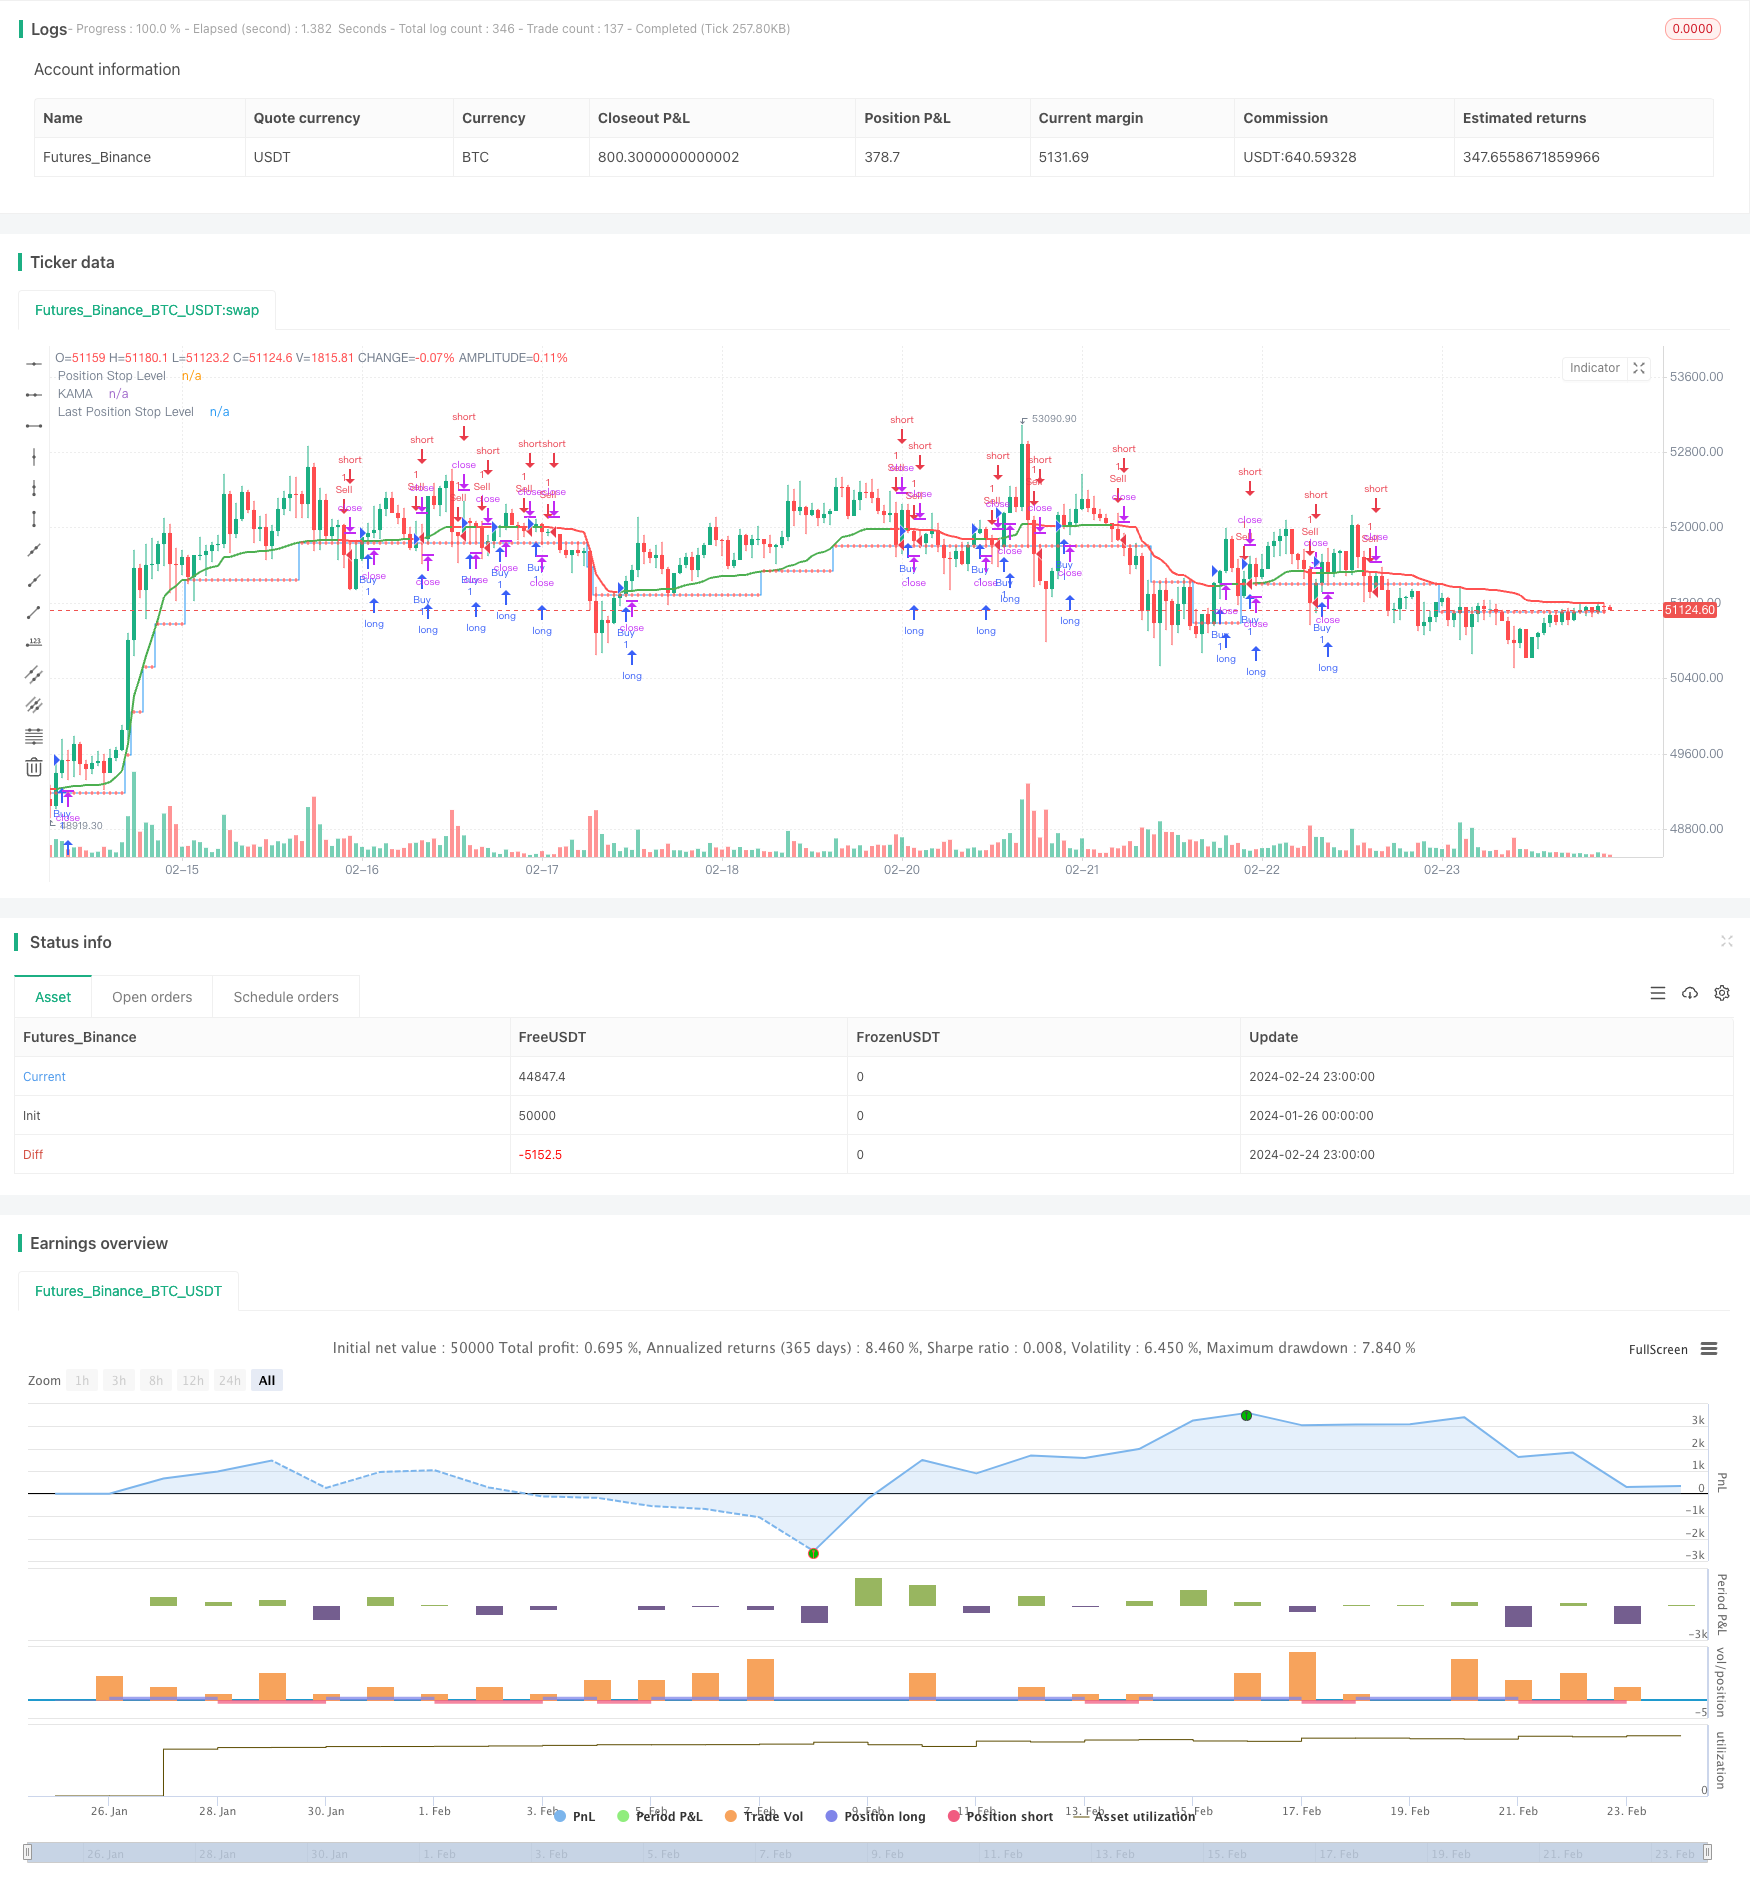
Overview
This strategy is designed based on the Kaufman Adaptive Moving Average (KAMA) to dynamically adjust trading positions and automatically track market trends. The main functions of the strategy include:
- Dynamically calculate trading step size (in pips) and adapt to market volatility
- Generate buy and sell signals based on the direction of KAMA
- Set a stop loss distance after signal is triggered, and adjust it accordingly as price moves
- Optional confirmation of bar close to filter fake signals
Through the application of these functions, the strategy tries to obtain additional profits from trends while controlling risks.
Strategy Logic
The strategy works based on the Kaufman Adaptive Moving Average indicator. KAMA calculates the ratio of price momentum to volatility to dynamically adjust the weight and smoothness of the moving average, allowing it to respond faster to price changes.
When KAMA crosses above the downside stop loss line, it indicates a trend reversal and triggers a buy signal. When KAMA crosses below the upside stop loss line, it suggests a trend reversal and triggers a sell signal. After entering a position, the strategy calculates a dynamic stop loss distance based on ATR and sets a stop loss line. As KAMA moves in a favorable direction, the stop loss line also adjusts accordingly, moving to a more favorable position to lock in more profits.
In this way, the strategy can track the trend, gradually move the stop loss line until it is triggered or a reverse signal is triggered to close the position.
Advantages
Compared with traditional moving average strategies, this strategy has the following advantages:
- KAMA has high sensitivity and can capture price trends faster;
- Dynamic stop loss distance locks more profits as it adjusts with the trend;
- Optional bar close confirmation filters fake signals and reduces unnecessary entries.
In general, the strategy is responsive, controllable, and a typical trend tracking system.
Risks
The strategy also carries some risks:
- Trend reversal risk. KAMA can adapt flexibly to price fluctuations but may not respond timely enough to sudden trend reversals.
- Overly aggressive stop loss. If the dynamic stop loss distance is set too wide, it may be too aggressive and fail to lock profits in time.
- Fake signal risk. Using bar close confirmation helps reduce fake signals but cannot eliminate them completely.
To manage these risks, methods like optimizing the stop loss distance and setting a maximum stop loss percentage can be used. Combining other indicators for confirmation also avoids mistaken trades.
Optimization Directions
Possible directions to optimize the strategy include:
- Optimize KAMA parameters: adjust moving average lengths, fine-tune smoothness;
- Optimize dynamic stop loss: test optimum stop loss distances and step sizes based on different products;
- Add filtering indicators: incorporate other trend indicators to confirm trading signals and improve reliability.
For example, MACD can be added as an auxiliary confirmation indicator, requiring MACD Dif to be positive and expanding alongside KAMA’s golden cross. This can filter out some fake signals and avoid unnecessary repeated entries.
Conclusion
The overall operation of this strategy is smooth. By using a dynamic stop loss to track trends and maximize trend profits, coupled with the adaptiveness of the KAMA indicator to swiftly respond to rapid market changes, this strategy can become an efficient trend tracking system after some optimization, suitable for medium- to long-term trading.
/*backtest
start: 2024-01-26 00:00:00
end: 2024-02-25 00:00:00
period: 1h
basePeriod: 15m
exchanges: [{"eid":"Futures_Binance","currency":"BTC_USDT"}]
*/

//@version=5
strategy("THMA - Bharath Vc Improved", overlay=true, process_orders_on_close=true)

// Function to calculate pips with higher precision
getPips(price) =>
    difc = syminfo.mintick
    hlpips = price / difc
    math.round(hlpips / syminfo.mintick) * syminfo.mintick

// Inputs
buyMess = input.string("Buy Message","Buy Alert Message")
sellMess = input.string("Sell Message","Sell Alert Message")
buyExitMessage = input.string("Buy Exit","Buy Exit Alert Message" )
sellExitMessage = input.string("Sell Exit","Sell Exit Alert Message" )

tmf = input.timeframe("", "Timeframe")
length = input(title='Length', defval=14)
fastLength = input(title='Fast EMA Length', defval=2)
slowLength = input(title='Slow EMA Length', defval=30)
src = input(title='Source', defval=close)
highlight = input(title='Highlight ?', defval=true)
awaitBarConfirmation = input(title='Await Bar Confirmation ?', defval=true)

// Function to calculate the TMA
gettma() =>
    mom = math.abs(ta.change(src, length))
    volatility = math.sum(math.abs(ta.change(src)), length)
    er = volatility != 0 ? mom / volatility : 0
    fastAlpha = 2 / (fastLength + 1)
    slowAlpha = 2 / (slowLength + 1)
    alpha = math.pow(er * (fastAlpha - slowAlpha) + slowAlpha, 2)
    kama = 0.0
    kama := alpha * src + (1 - alpha) * nz(kama[1], src)
    await = awaitBarConfirmation ? barstate.isconfirmed : true
    maColor = highlight ? kama > kama[1] and await ? color.green : color.red : color.new(color.purple, 0)
    thma = kama
    hma_dif = (thma - thma[2])/2
    colour = hma_dif > 0 ? color.green : color.red
    isGreen = hma_dif > 0
    [thma, isGreen, colour]

// Dynamic pip size based on ATR to adapt better to smaller timeframes
pips = ta.atr(14) * 0.1

// Main execution logic
var float psl = na
var int lastSignal = 0
var float lastPsl = na

[thma, isGreen, colour] = request.security(syminfo.tickerid, tmf, gettma(), gaps=barmerge.gaps_off, lookahead=barmerge.lookahead_off)

plot(thma, title='KAMA', linewidth=2, color=colour)

if ta.crossover(thma, psl) and strategy.position_size < 0
    strategy.exit("Sell Exit", stop=thma, alert_message=sellExitMessage)

if ta.crossunder(thma, psl) and strategy.position_size > 0
    strategy.exit("Buy Exit", stop=thma, alert_message=buyExitMessage)

if isGreen and strategy.position_size <= 0
    if na(psl)
        psl := close + getPips(pips)
    strategy.entry("Buy", strategy.long, alert_message=buyMess)
    lastSignal := 1

if not isGreen and strategy.position_size >= 0
    if na(psl)
        psl := close - getPips(pips)
    strategy.entry("Sell", strategy.short, alert_message=sellMess)
    lastSignal := -1

if (thma >= lastPsl or na(lastPsl)) and thma > psl
    psl := psl + getPips(pips)
    lastPsl := psl

if (thma <= lastPsl or na(lastPsl)) and thma < psl
    psl := psl - getPips(pips)
    lastPsl := psl

plot(psl, title="Position Stop Level", style=plot.style_stepline, color=color.blue)
plot(lastPsl, title="Last Position Stop Level", style=plot.style_cross, color=color.red)