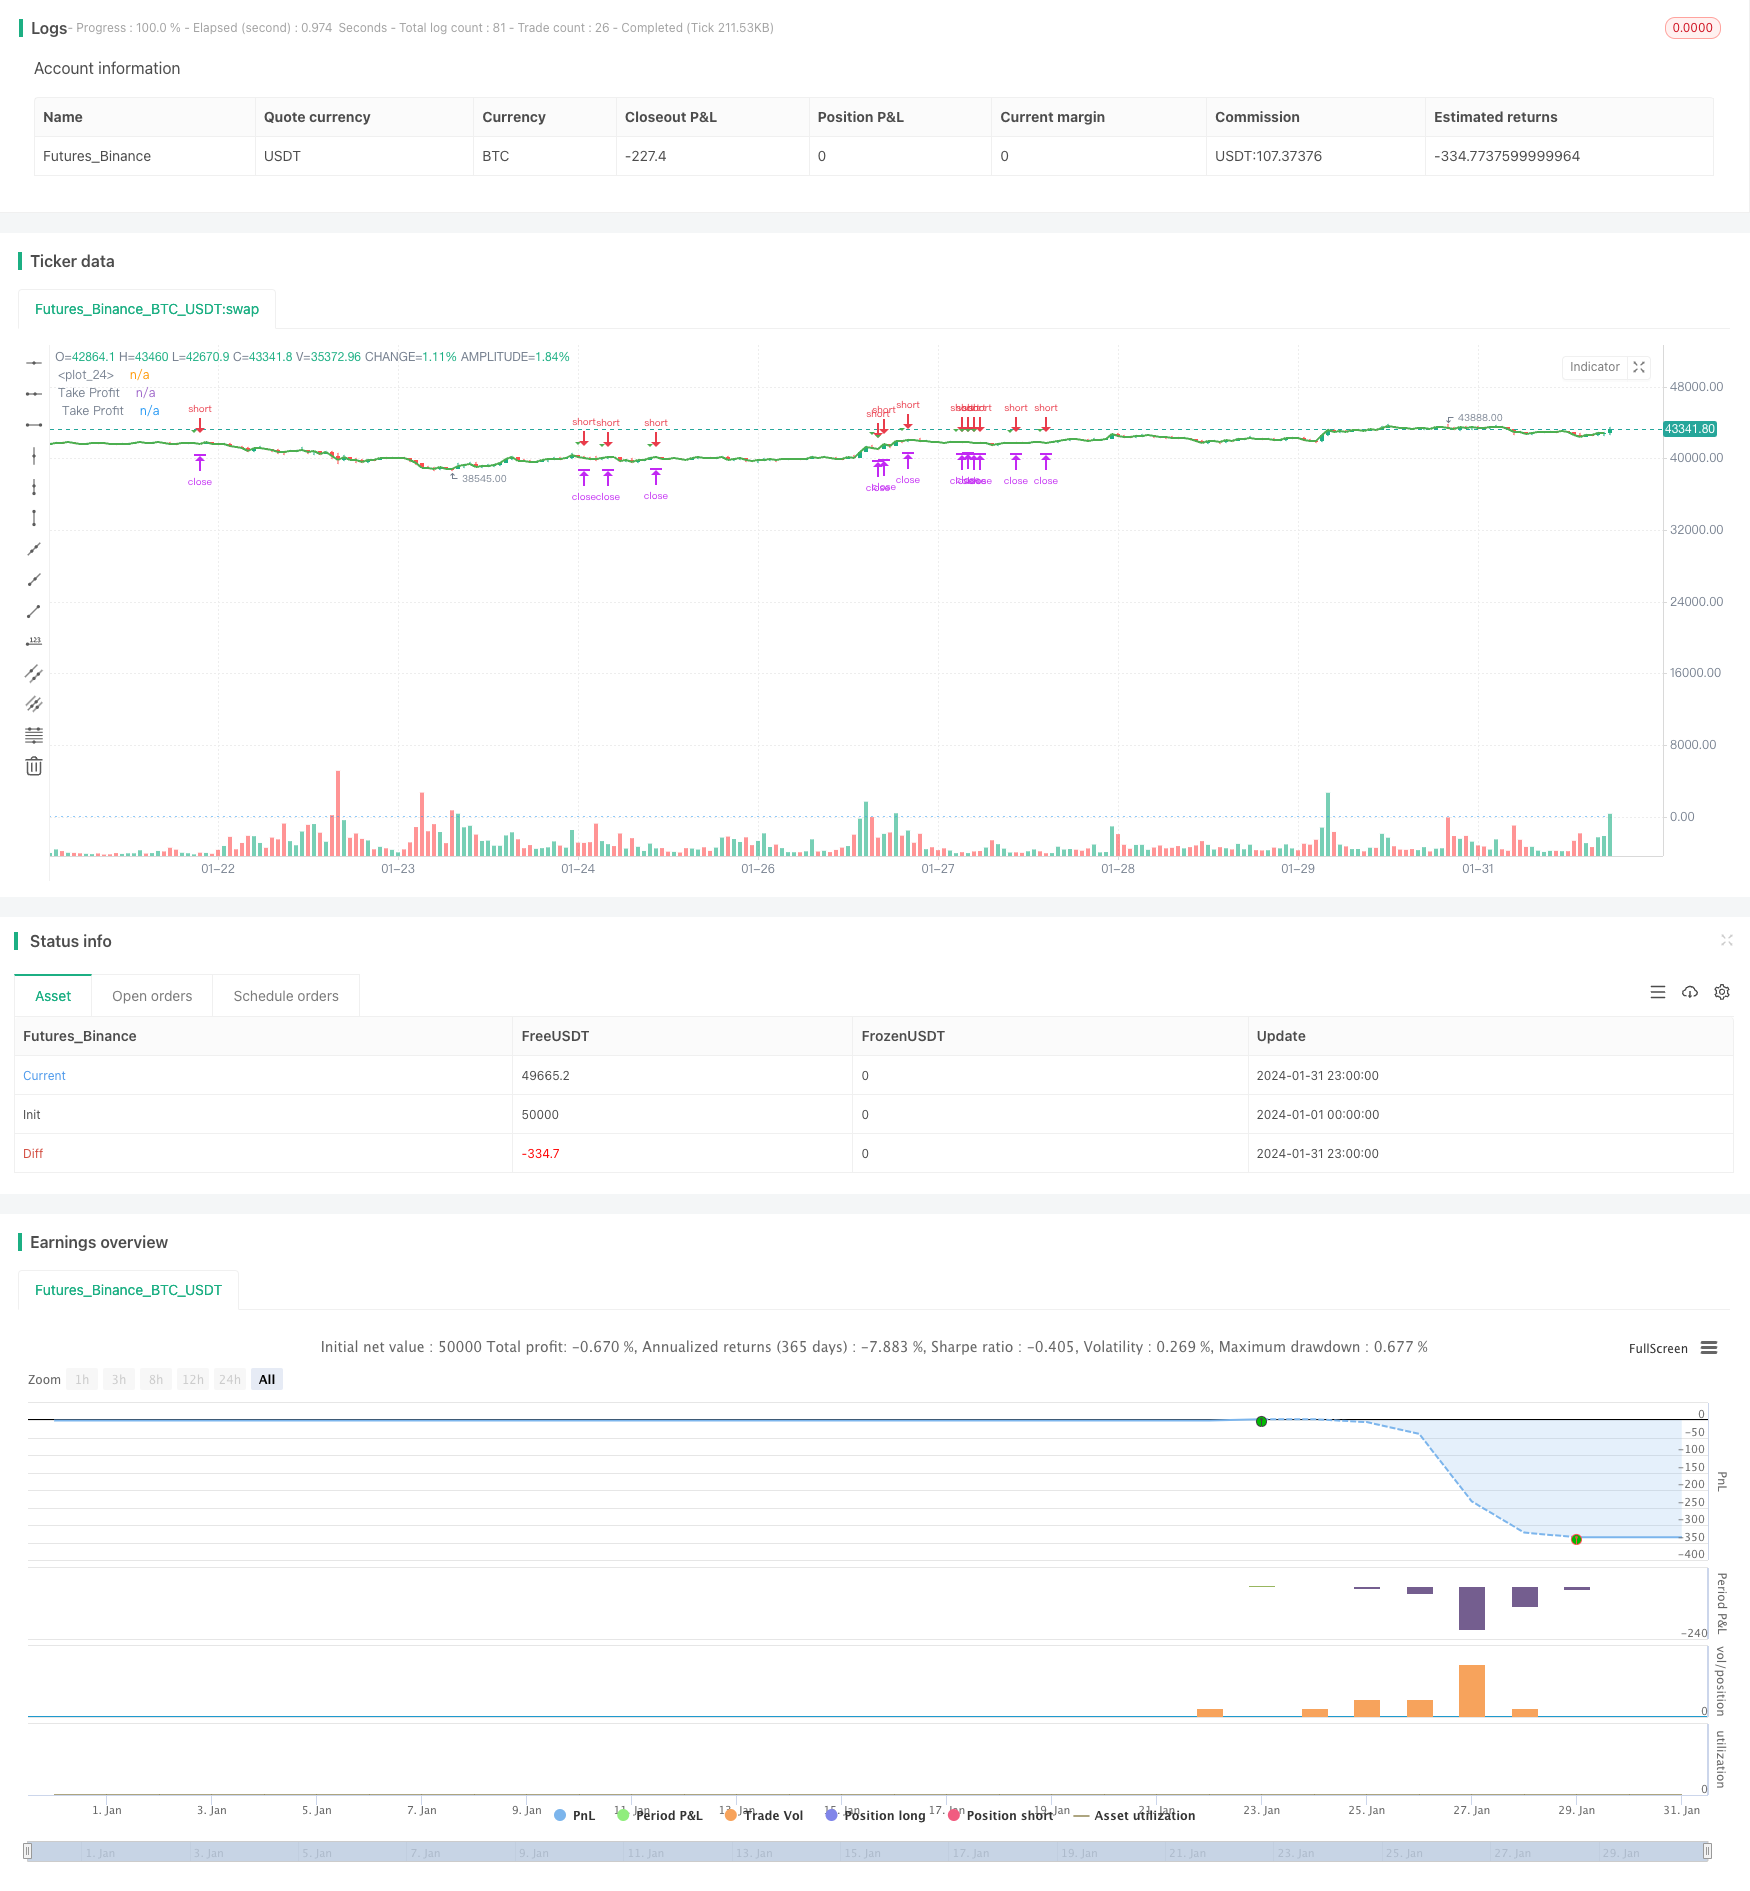
概述
20水平突破策略是一种趋势追踪策略。它的核心思想是,当价格突破某一关键水平时,表明趋势发生反转,这时可以根据突破的方向建立做多或做空仓位。
本策略选择20日均线作为关键水平。当收盘价从上方突破20日均线时,做多;当收盘价从下方突破20日均线时,做空。
策略原理
20水平突破策略使用20日均线作为判断趋势突破的标准。当价格从上方向下突破20日均线时,表明行情处在下行趋势,这时做空;当价格从下方向上突破20日均线时,表明行情处在上行趋势,这时做多。
该策略同时结合MACD指标判定行情。只有当MACD为红柱时才会发出做空信号;只有当MACD为绿柱时才会发出做多信号。这可以避免在盘整时产生错误信号。
具体来说,策略逻辑是:
- 定义20日均线为基准线;
- 当收盘价高于基准线+0.2%时且满足MACD条件时,在突破日的次日开盘价附近做多;
- 当收盘价低于基准线-0.2%时且满足MACD条件时,在突破日的次日开盘价附近做空;
- 做多止损为基准线下方0.5%,止盈为上方1%;
- 做空止损为基准线上方0.5%,止盈为下方1%。
通过这样的设定,本策略可以在趋势发生转换时及时捕捉机会,达到跟踪市场趋势的目的。
优势分析
20水平突破策略具有以下优势:
操作简单,容易实施。20日均线的计算及判断规则非常简单直接。
回撤相对较小。采用价格突破作为建仓信号,可以有效避免无谓的反向操作。
跟踪趋势能力较强。20日均线可以很好地反映中短期趋势的转变。结合MACD指标进行过滤,避免了趋势震荡时错误建仓。
风险分析
20水平突破策略也存在以下风险:
当价格出现剧烈波动时,20日均线方法将产生滞后,可能错过最佳入场时机。
在盘整行情下,价格可能出现频繁的上下突破。如果没有很好的指标过滤,将出现过多无效交易。
策略并没有考虑股价波动的幅度因素。如果不结合波动率指标,将面临亏损过大的风险。
固定的止损止盈位置也会影响策略的顺利进行。这需要根据不同标的调整参数。
优化方向
20水平突破策略可从以下方面进行优化:
尝试不同的均线周期,如10日、30日等,看哪个周期能更好地把握趋势。
加入波动率指标,根据股价波动幅度动态调整仓位。这可以有效控制风险。
优化止损止盈位置。可以根据历史回测数据计算出最优参数。
尝试结合其它指标,如KDJ、布林线等进行ormapSignal滤。这可以减少无效交易。
开发改进版本,在更高的时间框架上寻找更大的趋势,然后在较低的时间框架上进行入场。
总结
20水平突破策略通过价格突破判断趋势转折点,具有操作简单、跟踪趋势能力较强的优点。但也存在一些风险,需要进一步优化以适应市场的复杂性。总的来说,20水平突破策略作为一种较为基础的趋势追踪策略,仍有较大的改进空间。投资者可以在此基础上不断优化,使其能够在多种市场环境下获得稳定收益。
/*backtest
start: 2024-01-01 00:00:00
end: 2024-01-31 23:59:59
period: 1h
basePeriod: 15m
exchanges: [{"eid":"Futures_Binance","currency":"BTC_USDT"}]
*/

//@version=5


//@version=4
strategy("20 Level Breakout", overlay=true)

baseLevel = math.floor(close * 100) /100
eigthylevel = baseLevel - 0.002
twentyLevel = baseLevel + 0.002
takeprofitL = baseLevel - 0.01
stoplossL = baseLevel + 0.02
takeprofitS = baseLevel + 0.015
stoplossS = baseLevel - 0.02

isPriceAboveLevel(price, level) =>
    price > level

breakout = close > twentyLevel and close > baseLevel
breakoutl = close < eigthylevel and close < baseLevel
// Entry condition: Only enter if there are no open trades and the close is between baseLevel and baseLevel + 0.01
isLong = breakout and close > baseLevel and close <= (baseLevel + 0.01) and ta.rsi(close, 14) > 40 and ta.ema(close,50)<close
isShort = breakoutl and close < baseLevel and close >= (baseLevel - 0.01)
// Debugging
plot(isLong ? 1 : 0, color=color.blue, style=plot.style_histogram)
plotshape(isLong, style=shape.triangledown, color=color.green, size=size.small)
plotshape(isShort, style = shape.triangleup, color =  color.red, size = size.small)
// Plotting the stop loss line
plot(stoplossL, color=color.red, linewidth=2, title="Take Profit")
plot(stoplossS, color=color.green, linewidth = 2, title = " Take Profit")
strategy.entry("Short", strategy.short, when=isLong, stop =twentyLevel)
strategy.exit("Stop Loss/Profit", "Short", stop = stoplossL , limit = takeprofitL)

strategy.entry("Long",strategy.long, when=isShort , stop = eigthylevel )
strategy.exit("Stop loss/Profit", "Long", stop = stoplossS , limit = takeprofitS)