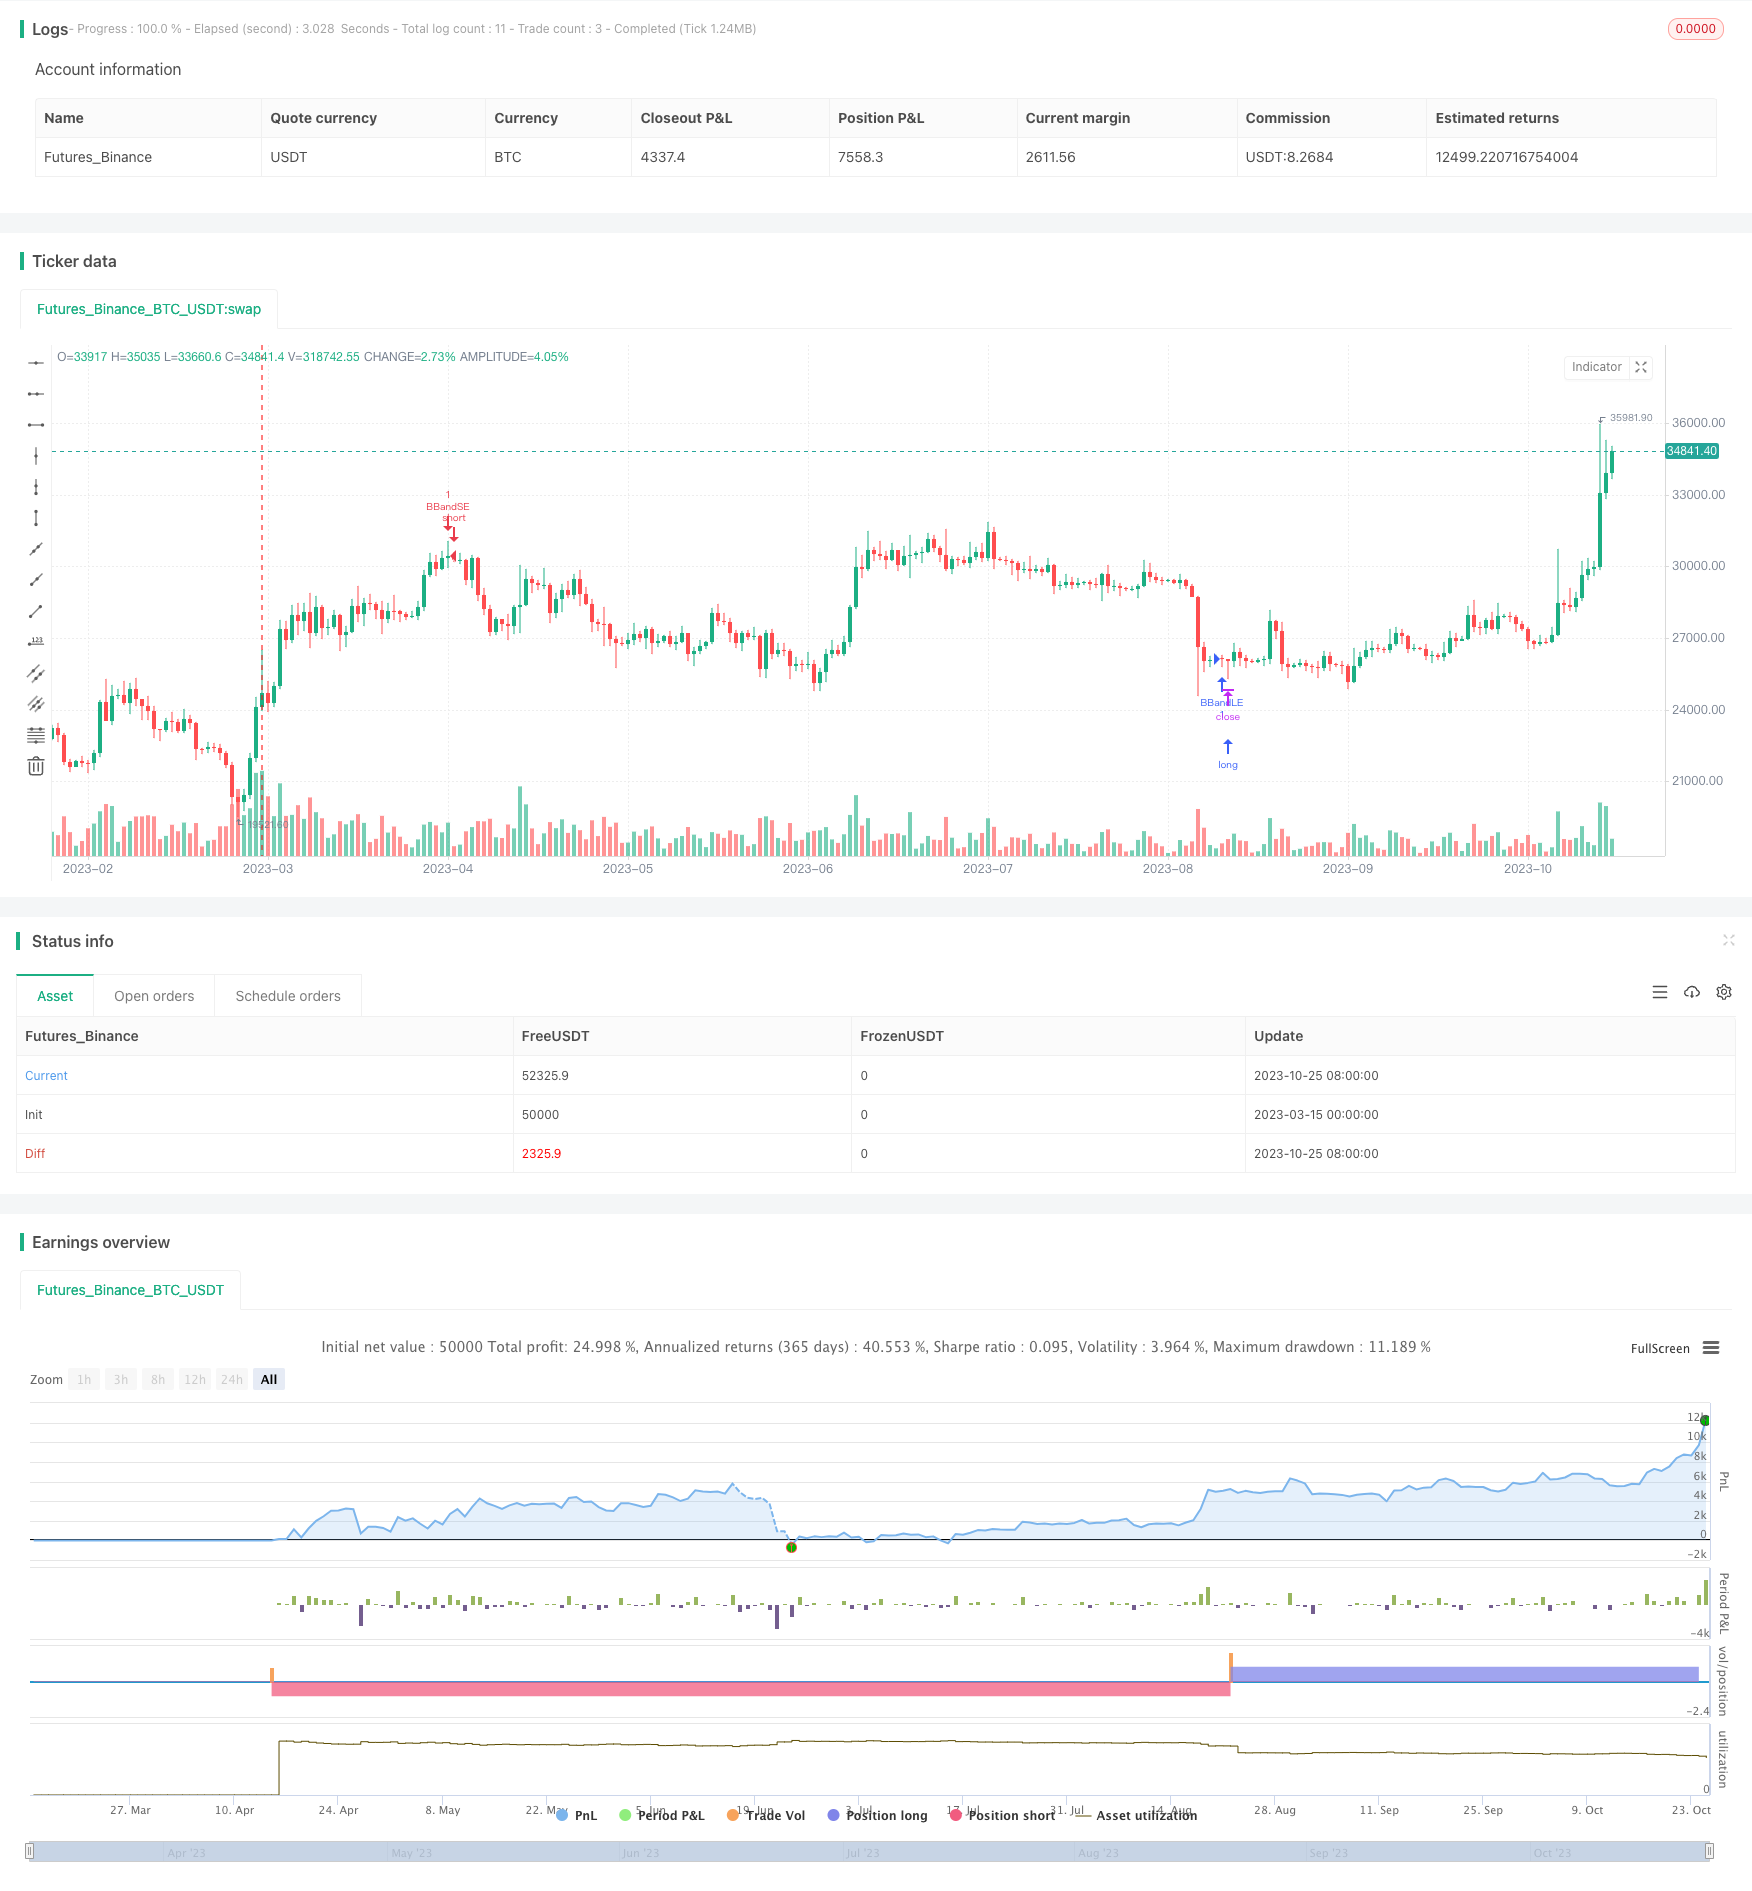
Bollinger Bands & RSI Combination Strategy
Author: ChaoZhang, Date: 2024-03-15 16:28:53Tags:

Strategy Overview
The Bollinger Bands & RSI Combination Strategy is a technical analysis strategy that combines two popular technical indicators: Bollinger Bands and the Relative Strength Index (RSI), to make entry and exit decisions in the market. The strategy uses price breakouts above or below the Bollinger Bands, along with overbought and oversold signals from the RSI, to identify trading opportunities.
Strategy Principles
The strategy employs two technical indicators to generate trading signals:
Bollinger Bands consist of three lines: the middle band (moving average), upper band (middle band plus standard deviations), and lower band (middle band minus standard deviations). Trading signals are generated when the price breaks through the upper or lower Bollinger Bands.
RSI measures the speed and magnitude of price movements by comparing the number of up days to down days over a period of time. RSI is used to filter the trading signals generated by the Bollinger Bands: long positions are only taken when the RSI is below the oversold level, and short positions are only taken when the RSI is above the overbought level.
Specifically, the trading signals of the strategy are as follows:
- Long Entry: When the price breaks down through the lower Bollinger Band and the RSI is below the oversold level, open a long position.
- Short Entry: When the price breaks up through the upper Bollinger Band and the RSI is above the overbought level, open a short position.
- Exit: Close the position when the price breaks through the opposite Bollinger Band.
Strategy Advantages
- Combines two widely used and recognized technical indicators, making the strategy logic simple and straightforward.
- Uses RSI to filter the trading signals generated by the Bollinger Bands, improving the quality of trading decisions and reducing misleading signals.
- Strategy parameters can be optimized according to different market characteristics and trading styles, providing some flexibility and adaptability.
Strategy Risks
- Like all trading strategies, this strategy may perform poorly in certain market environments, such as when trends are unclear or volatility is extremely low.
- The choice of strategy parameters has a significant impact on strategy performance, and inappropriate parameters may lead to a large number of false trading signals.
- The strategy does not consider fundamental factors of the market and relies entirely on price behavior, which may be ineffective in some event-driven market environments.
Optimization Directions
- Combine with other confirmation indicators, such as volume, trend indicators, etc., to further filter trading signals and improve signal quality.
- Introduce stop-loss and take-profit mechanisms to control single-trade risk and profit targets, improving the risk-return characteristics of the strategy.
- Optimize strategy parameters, such as the period and deviation multiplier of the Bollinger Bands, the period and overbought/oversold thresholds of the RSI, to find the parameter combination that best suits the current market.
- Consider performance in different market states, such as trending markets, oscillating markets, etc., and adopt different strategy parameters or rules for different markets.
Summary
The Bollinger Bands & RSI Combination Strategy is a simple and practical technical trading strategy that combines two classic indicators, Bollinger Bands and RSI, to generate relatively reliable trading signals. The strategy’s advantage lies in its clear logic, ease of understanding and implementation, and the use of the RSI indicator to filter Bollinger Band signals, improving signal quality. However, the strategy also has some limitations, such as insufficient adaptability to market environments and lack of consideration for fundamental factors. Therefore, in practical application, it is necessary to optimize and improve the strategy according to specific market characteristics and trading styles, such as combining other technical indicators, introducing risk control measures, and optimizing parameter selection. Overall, the Bollinger Bands & RSI Combination Strategy provides technical traders with a reference trading idea and framework, but the success of the strategy depends on the trader’s understanding of the market and accumulation of experience.
/*backtest
start: 2023-03-15 00:00:00
end: 2023-10-26 00:00:00
period: 1d
basePeriod: 1h
exchanges: [{"eid":"Futures_Binance","currency":"BTC_USDT"}]
*/

//@version=5
strategy("Bollinger Bands & RSI Strategy", overlay=true)

// Bollinger Bands Parameters
source = close
length = input.int(20, minval=1)
mult = input.float(2.0, minval=0.001, maxval=50)

// RSI Parameters
rsi_length = input.int(14, minval=1)
rsi_oversold = input.int(30, minval=1, maxval=100)
rsi_overbought = input.int(70, minval=1, maxval=100)

// Strategy Entry
basis = ta.sma(source, length)
dev = mult * ta.stdev(source, length)
upper = basis + dev
lower = basis - dev

rsi = ta.rsi(source, rsi_length)

if (ta.crossover(source, lower) and rsi < rsi_oversold)
    strategy.entry("BBandLE", strategy.long, comment="BBandLE")
else
    strategy.cancel(id="BBandLE")

if (ta.crossunder(source, upper) and rsi > rsi_overbought)
    strategy.entry("BBandSE", strategy.short, comment="BBandSE")
else
    strategy.cancel(id="BBandSE")
- Dual Moving Average Crossover Quantitative Trading Strategy
- EMA 200 Crossover with Volume and Trend Strategy
- RSI Dynamic Stop Loss and Take Profit Strategy
- Ichimoku Cloud Local Trend Identification Strategy
- 9EMA Dynamic Position Sizing Strategy with Two 5-Minute Close Breakouts
- A Long-Short Adaptive Dynamic Grid Strategy Based
- ATR Chandelier Exit Strategy with Relative Strength Index
- High/Low Automatic Forecasting and Trading Strategy
- Intraday Hammer Reversal Pattern Long Strategy
- CVD Divergence Quantitative Trading Strategy
- Ichimoku Oscillator with Stochastic Momentum Index Strategy
- AI Trend Predictor Trading Strategy
- TrendHunter w/MF Multi-Timeframe Trend Strategy
- Bollinger Bands and Fibonacci Retracement Strategy
- The RSI and MACD Crossover Strategy
- A Trading Strategy Based on Dual Moving Average Crossover
- Dynamic RSI and Dual Moving Average Buy/Sell Strategy
- Multiple Exponential Moving Average Trading Strategy
- The RSI Crossover Trading Strategy
- The Dual Moving Average Crossover Strategy