AI Trend Predictor Trading Strategy
Author: ChaoZhang, Date: 2024-03-15 16:06:00Tags:
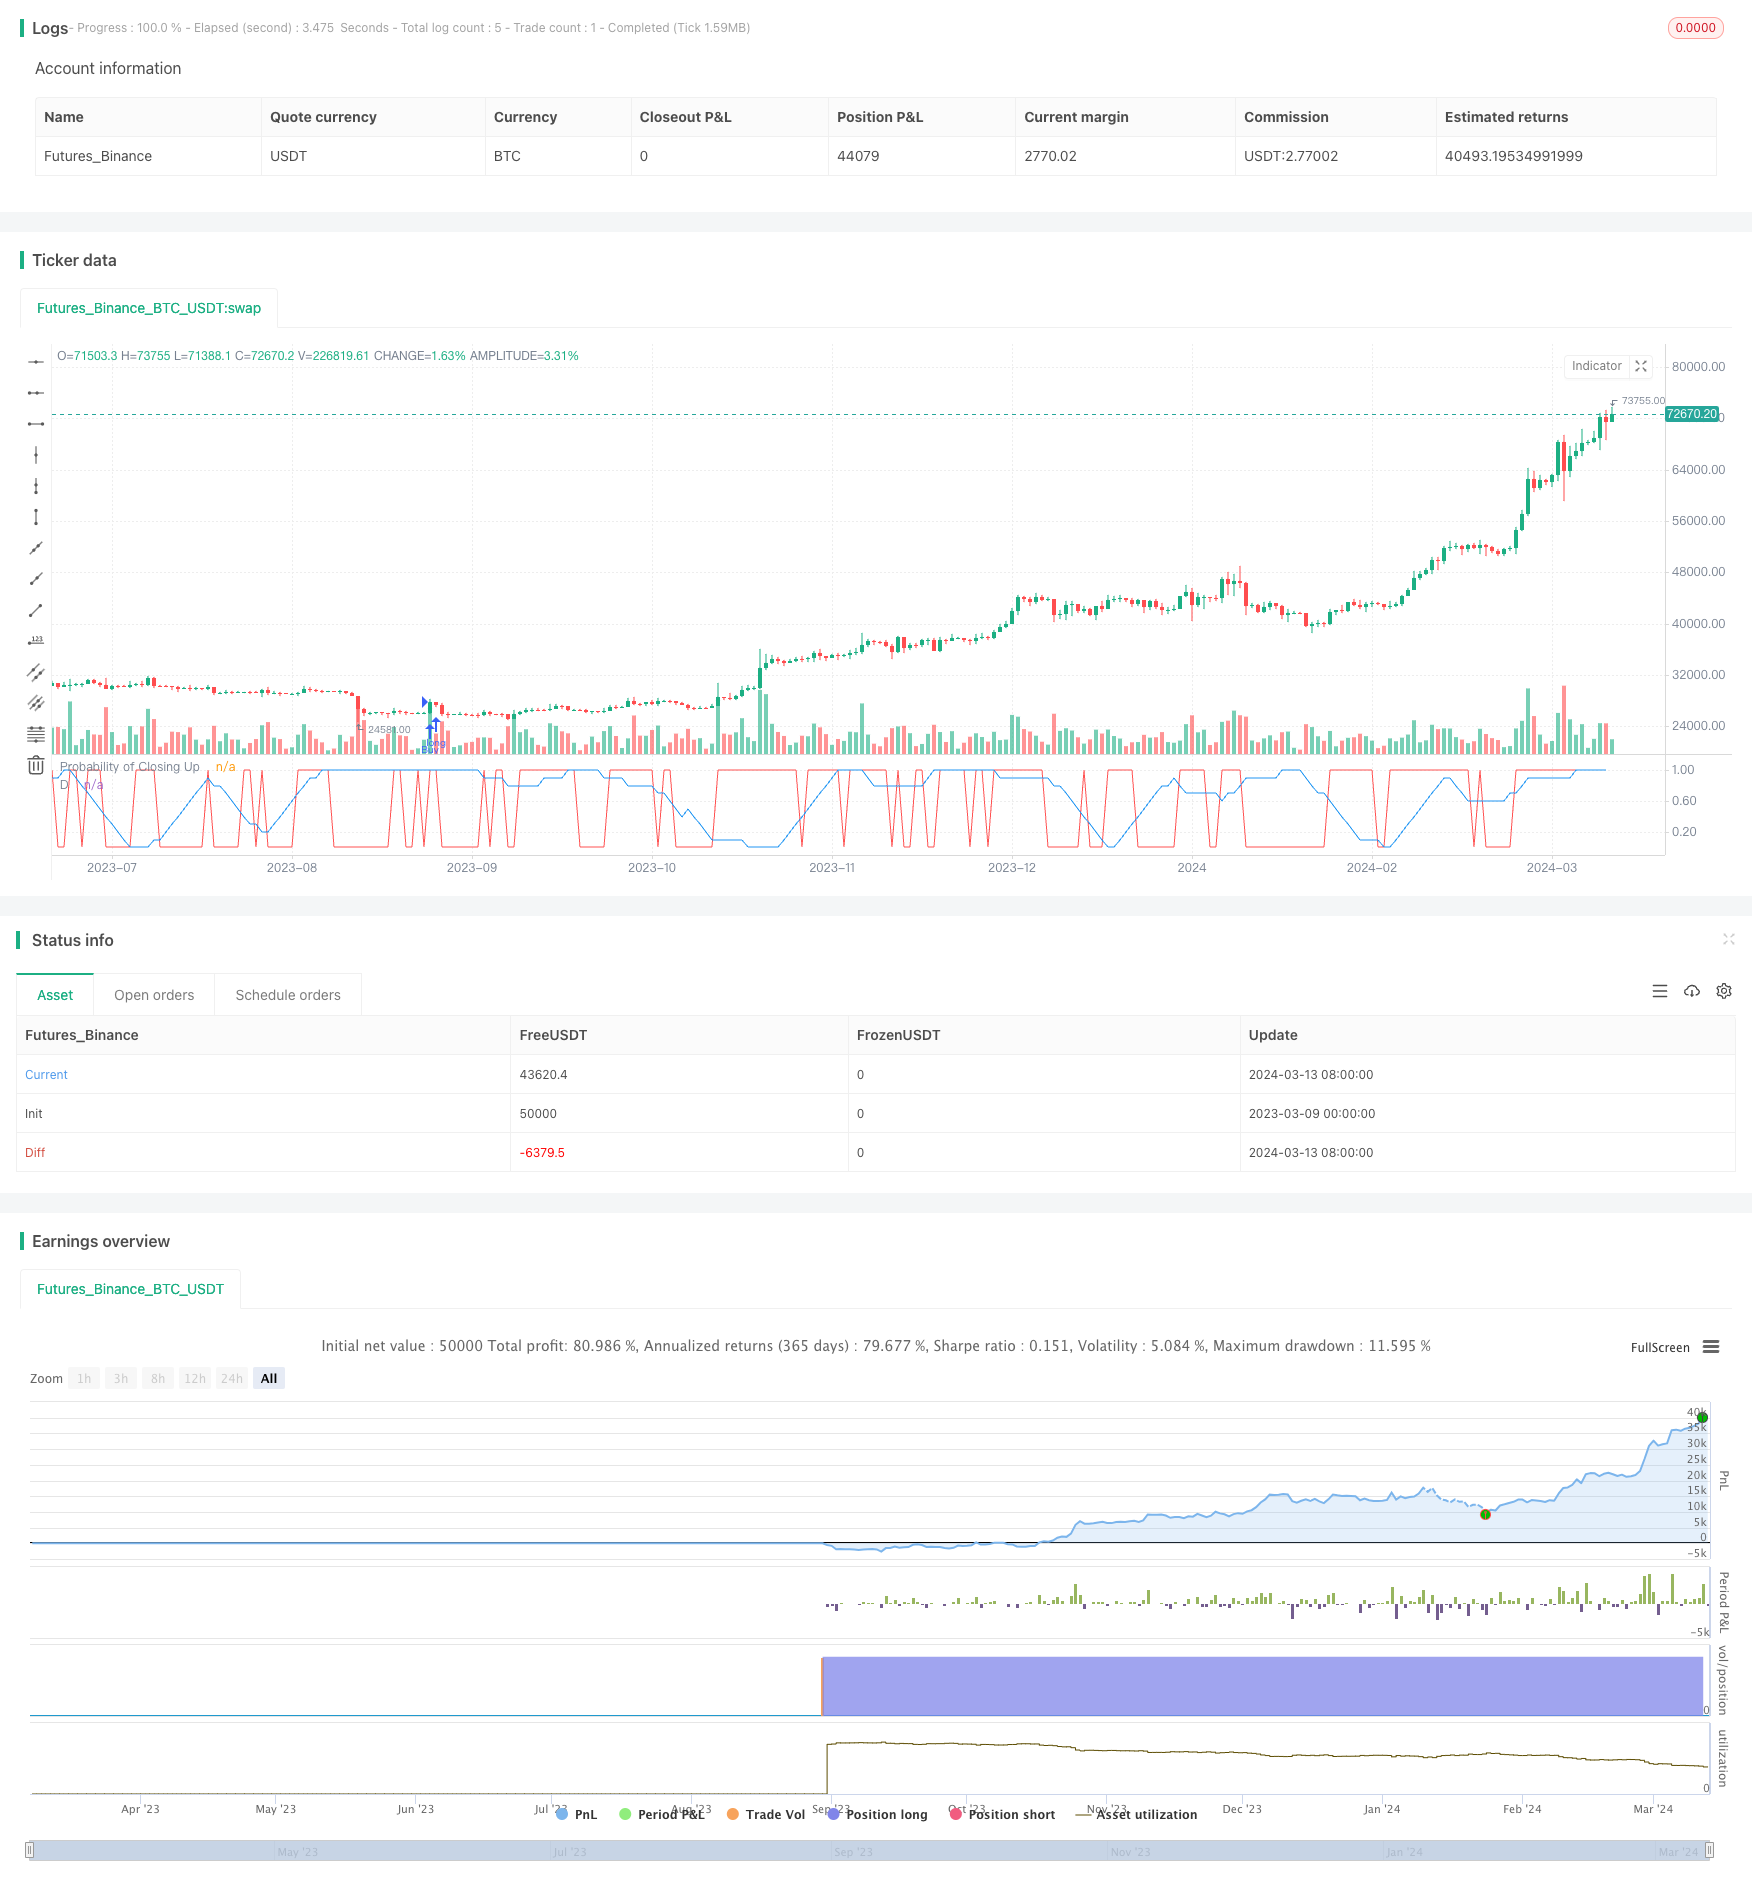
Strategy Overview
The AI Trend Predictor Trading Strategy is a quantitative trading strategy driven by artificial intelligence. This strategy utilizes advanced AI algorithms to analyze market data and identify potential trading opportunities. By analyzing the correlation of K-line amplitude differences across different time periods and combining dynamic probability indicators, it predicts future price trends and makes optimal trading decisions.
Strategy Principle
The core principle of this strategy is to predict the probability of future closing prices within a certain period (future_length) by analyzing the amplitude differences and correlations of K-lines across different time periods (A, B, C). The specific steps are as follows:
-
Calculate the closing prices of three different K-line periods: A, B, and C. A represents the current closing price, B represents the long-period (length_B) moving average, and C represents the medium-period (length_C) moving average.
-
Calculate the amplitude differences (highest price - lowest price) of the three K-line periods: A, B, and C.
-
Calculate the moving average value (C_avg_diff) of the amplitude differences in the C period.
-
Calculate the correlation coefficient (correlation) between the amplitude differences of the current C period and the previous C period.
-
Generate a dynamic probability indicator (probability) based on the condition that the correlation coefficient is greater than 0.
-
Calculate the medium-period moving average value (D) of the dynamic probability indicator.
-
Obtain the closing price (future_close) of a certain future period (future_length) and generate the probability of the future closing price rising (probability_up) based on the relationship between the current closing price and the future closing price.
-
When D is greater than 0.51 and the current closing price crosses above the B-period moving average, execute a buy operation; when D is less than 0.51 and the current closing price crosses below the B-period moving average, execute a sell operation.
Through the above steps, this strategy can predict future price trends based on the correlation of K-line amplitude differences across different time periods, combined with dynamic probability indicators, and perform buy and sell operations based on the prediction results to obtain optimal returns.
Strategy Advantages
-
Utilizes AI algorithms to fully mine the patterns and trends contained in market data, improving prediction accuracy.
-
Employs multi-period K-line analysis to comprehensively consider price amplitude characteristics at different time scales, enhancing the adaptability and robustness of the strategy.
-
Introduces dynamic probability indicators to dynamically adjust trading signals based on changes in market conditions, increasing the flexibility of the strategy.
-
Establishes risk management mechanisms to strictly control trading risks and ensure capital safety.
-
Optimizes parameters to adjust strategy parameters for different market environments and trading instruments, maximizing the potential of the strategy.
Strategy Risks
-
Market Risk: The uncertainty and volatility of financial markets may expose the strategy to the risk of losses. Solution: Set reasonable stop-loss and take-profit mechanisms to control the risk exposure of individual trades.
-
Parameter Risk: Improper parameter settings may affect the performance of the strategy. Solution: Conduct rigorous backtesting and parameter optimization to select the optimal parameter combination.
-
Overfitting Risk: The strategy performs well on training data but fails to replicate the performance in actual trading. Solution: Use methods such as cross-validation to assess the generalization ability of the strategy and prevent overfitting.
-
Unknown Risks: AI models may have unknown defects or limitations. Solution: Continuously monitor and evaluate the performance of the strategy to promptly identify and correct potential issues.
Strategy Optimization
-
Introduce more technical indicators and market features to enrich the information sources of the strategy and improve prediction accuracy.
-
Optimize the structure and training methods of the AI model to enhance its learning ability and generalization ability.
-
Dynamically adjust strategy parameters to optimize strategy performance in real-time based on changes in market conditions.
-
Strengthen risk management by introducing more advanced risk control methods, such as portfolio optimization and dynamic stop-loss.
-
Expand the applicability of the strategy by adapting and optimizing it for different markets and trading instruments.
Strategy Summary
The AI Trend Predictor Trading Strategy predicts future price trends by analyzing the correlation of K-line amplitude differences across multiple time periods and combining dynamic probability indicators to make trading decisions. This strategy fully utilizes AI technology to mine patterns and trends in market data, demonstrating good adaptability and flexibility. At the same time, the strategy emphasizes risk management and ensures capital safety through rigorous parameter optimization and risk control measures. In the future, this strategy can be further optimized in terms of technical indicators, AI models, parameter tuning, risk management, and other aspects to achieve more robust and outstanding trading performance. In summary, the AI Trend Predictor Trading Strategy represents a new direction and approach in the field of quantitative trading, providing investors with an intelligent and adaptive trading tool that helps them seize opportunities and achieve steady profits in the volatile financial market.
/*backtest
start: 2023-03-09 00:00:00
end: 2024-03-14 00:00:00
period: 1d
basePeriod: 1h
exchanges: [{"eid":"Futures_Binance","currency":"BTC_USDT"}]
*/

//@version=5
strategy('AI Trend Predictor', overlay=false)


length_A = input(24, title='Length of K-line A')
length_B = input(192, title='Length of K-line B')
length_C = input(10, title='Length of K-line C')
future_length = input(5, title='Length of future K-line')


A_close = close
B_close = ta.sma(close, length_B)
C_close = ta.sma(B_close, length_C)


A_diff = high - low
B_diff = high - low
C_diff = high - low


C_avg_diff = ta.sma(C_diff, length_C)


correlation = ta.correlation(C_diff, C_diff[1], length_C)


probability = correlation > 0 ? 1 : 0


D = ta.sma(probability, length_C)


future_close = close[future_length]
probability_up = close > future_close ? 1 : 0


plot(D, color=color.new(color.blue, 0), title='D')
plot(probability_up, color=color.new(color.red, 0), title='Probability of Closing Up')


strategy.entry('Buy', strategy.long, when=D > 0.51 and ta.crossover(close, B_close))
strategy.entry('Sell', strategy.short, when=D < 0.51 and ta.crossunder(close, B_close))
- RSI Dynamic Stop Loss and Take Profit Strategy
- Ichimoku Cloud Local Trend Identification Strategy
- 9EMA Dynamic Position Sizing Strategy with Two 5-Minute Close Breakouts
- A Long-Short Adaptive Dynamic Grid Strategy Based
- ATR Chandelier Exit Strategy with Relative Strength Index
- High/Low Automatic Forecasting and Trading Strategy
- Intraday Hammer Reversal Pattern Long Strategy
- CVD Divergence Quantitative Trading Strategy
- Bollinger Bands & RSI Combination Strategy
- Ichimoku Oscillator with Stochastic Momentum Index Strategy
- TrendHunter w/MF Multi-Timeframe Trend Strategy
- Bollinger Bands and Fibonacci Retracement Strategy
- The RSI and MACD Crossover Strategy
- A Trading Strategy Based on Dual Moving Average Crossover
- Dynamic RSI and Dual Moving Average Buy/Sell Strategy
- Multiple Exponential Moving Average Trading Strategy
- The RSI Crossover Trading Strategy
- The Dual Moving Average Crossover Strategy
- Dynamic Trailing Stop Strategy Based on ATR and SMA
- Bullish Swing Trading Strategy Based on Bollinger Bands and RSI