概述
一目均衡动力指数策略是一个结合了一目均衡指标(Ichimoku)和随机动量指数(Stochastic Momentum Index)的交易策略。该策略通过计算一目均衡震荡指标(Ichimoku Oscillator)和随机动量指数,产生交易信号,适用于股票、商品、指数等多个市场和多个时间周期。
策略原理
该策略的核心是计算一目均衡震荡指标(IO)和随机动量指数(SMI)。其中,IO指标通过9日、26日、52日的不同周期EMA以及14日SMA计算得出,反映了市场的超买超卖情况。SMI指标通过计算一定周期内价格相对于最高最低价的位置,并用嵌套的EMA平滑处理,同样反映了市场的超买超卖情况。
策略的交易信号如下:
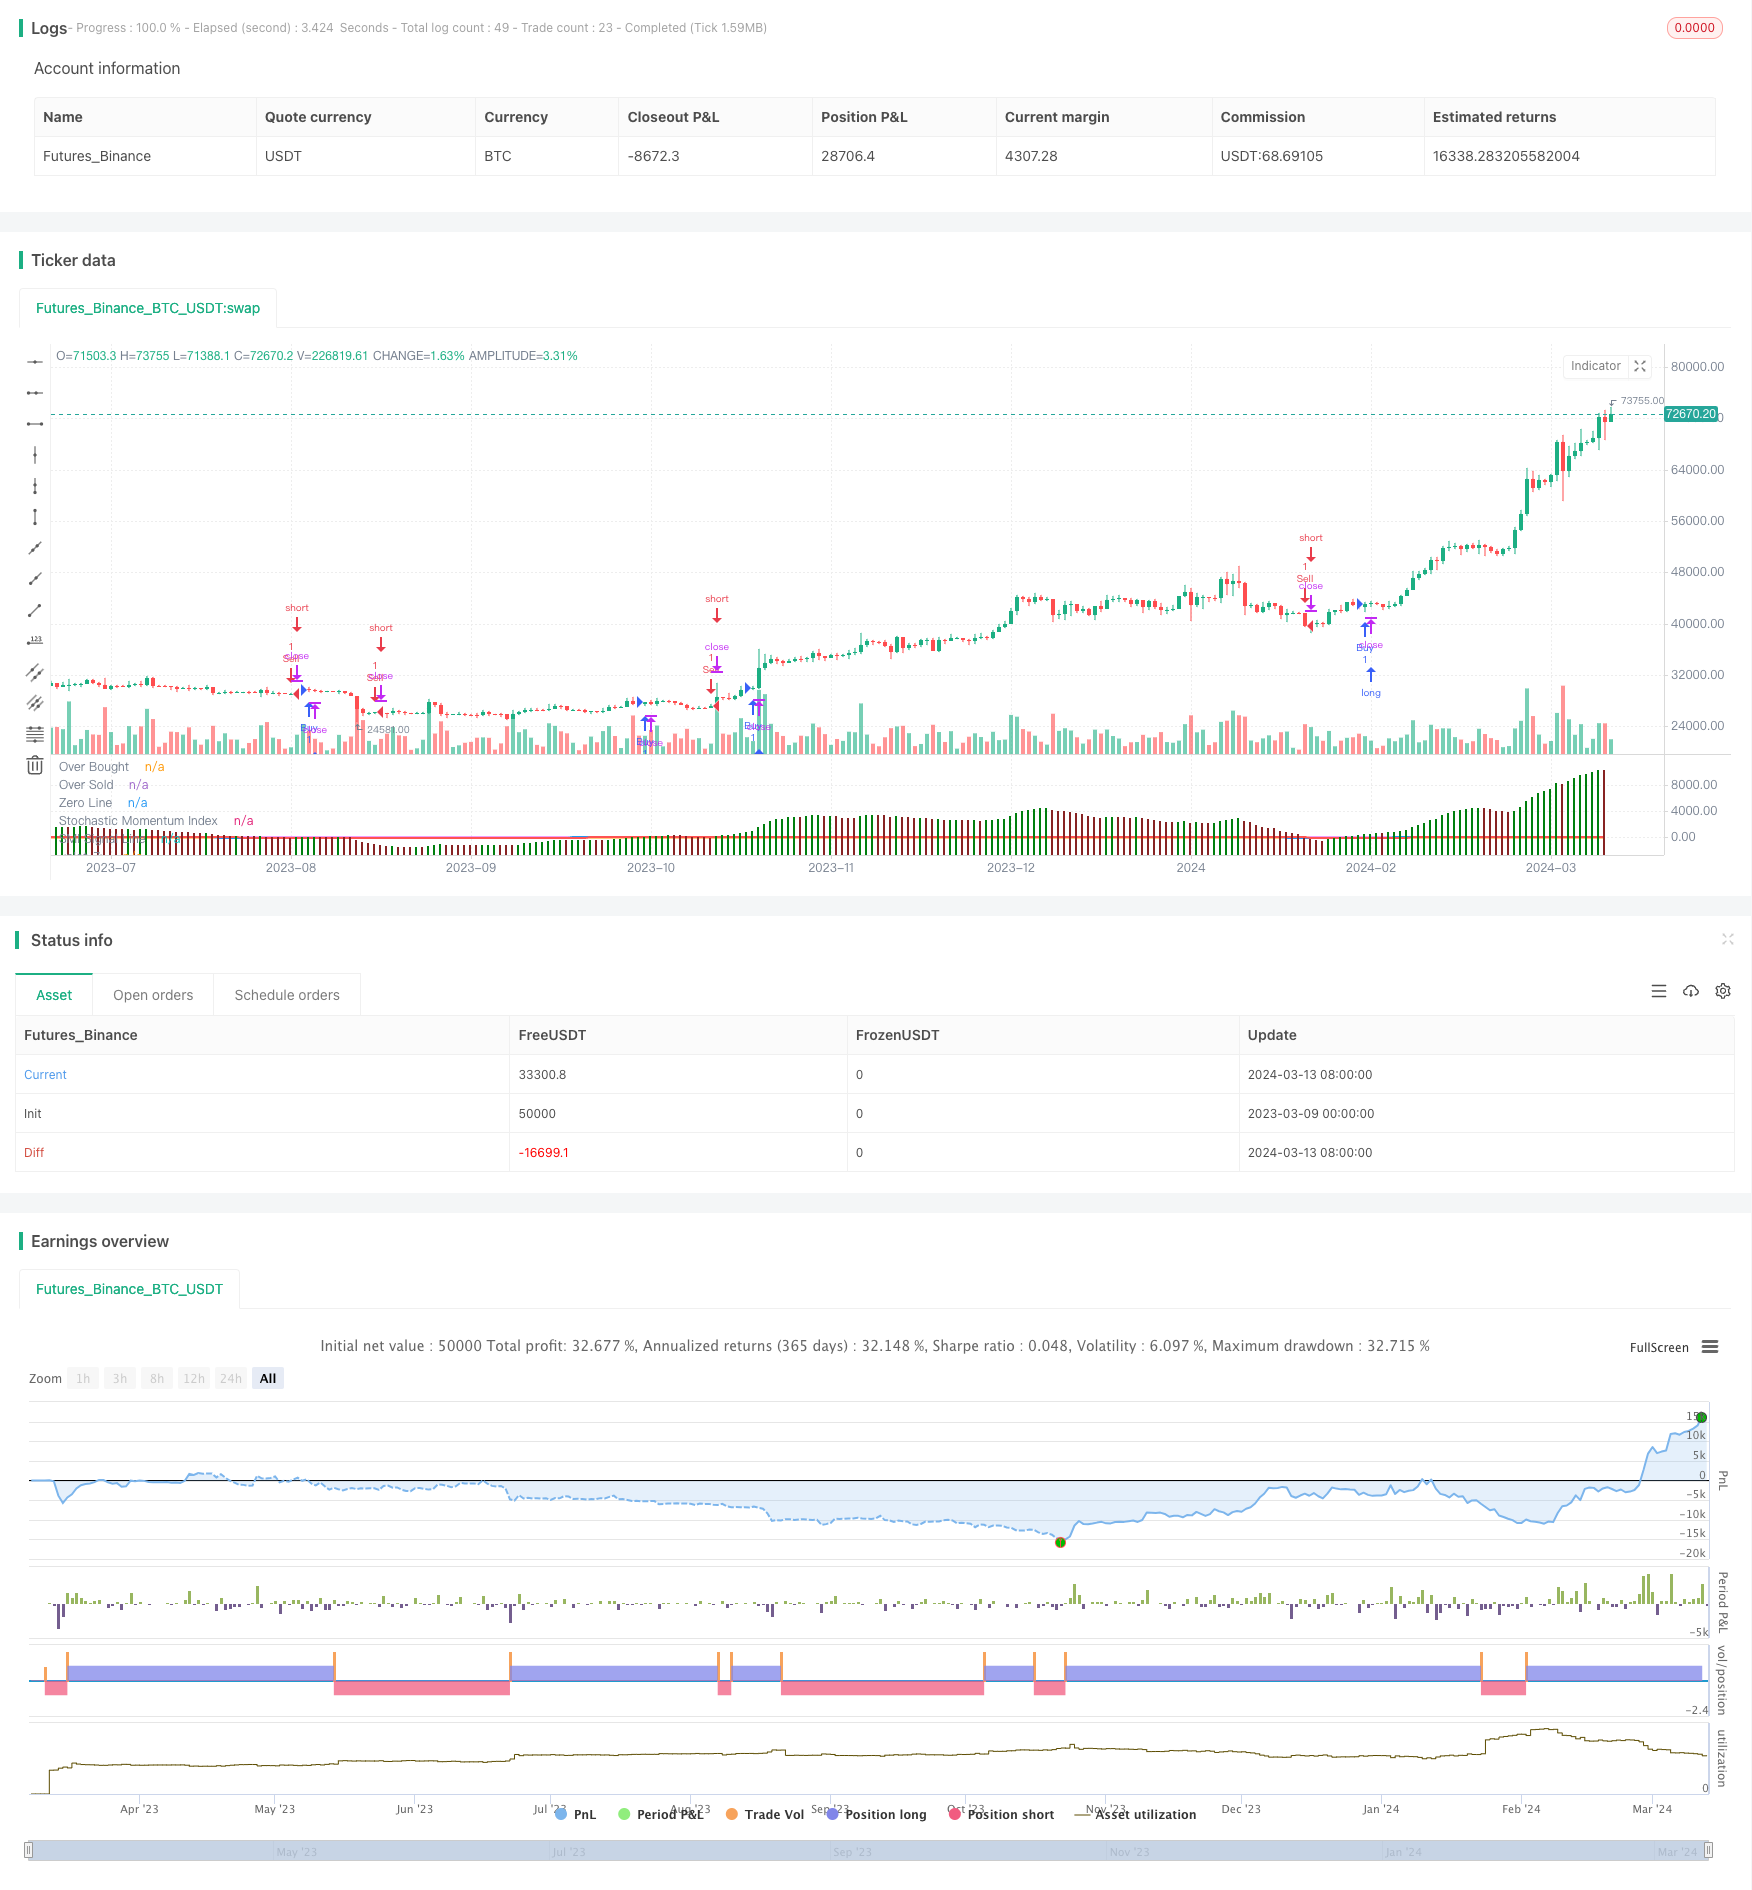
- 当SMI上穿其信号线,且IO大于0时,开多仓
- 当SMI下穿其信号线,且IO小于0时,开空仓
这样的交易信号结合了IO和SMI两个指标,可以更好地捕捉市场转折点,提高交易准确率。
优势分析
一目均衡动力指数策略具有以下优势:
- 结合了一目均衡指标和随机动量指数两个有效的技术指标,互为补充,可以更全面地分析市场趋势和走势。
- IO指标采用了多个周期的EMA和SMA,可以平滑价格波动,减少噪音干扰。
- SMI指标在随机指标的基础上进行了优化,使用嵌套的EMA使曲线更加平滑,避免了随机指标的掉头问题。
- 交易信号同时考虑了IO和SMI的情况,可以有效过滤假信号,提高胜率。
- 适用于多个市场和多个时间周期,具有良好的适应性和稳定性。
风险分析
尽管一目均衡动力指数策略具有诸多优势,但仍然存在一些潜在风险:
- 该策略依赖于历史数据进行计算和分析,对未来市场的适应性可能会下降。
- IO和SMI指标本质上还是滞后指标,在市场快速变化时,可能出现信号延迟的情况。
- 该策略并未考虑市场的基本面因素,如重大利好利空消息等,遇到这些情况可能失效。
- 在市场震荡区间内,该策略可能出现频繁交易的情况,增加了交易成本。
针对这些风险,可以采取以下措施:
- 定期检测和调整策略参数,提高适应性。
- 结合其他领先指标或市场信息进行分析,弥补滞后性。
- 设置适当的止盈止损,控制单次交易风险。
- 针对震荡市可以增大IO和SMI指标的周期参数,减少交易频率。
优化方向
该策略还有以下几个可以优化的方向:
- 对于IO指标,可以尝试更多不同的周期组合,找到更有代表性的参数。
- 对于SMI指标,可以研究不同的平滑方法,如考虑使用威尔德平滑法等,进一步降低指标的滞后性。
- 可以适当纳入交易量等其他指标,丰富交易信号的纬度。
- 针对不同的市场特点,可以设置不同的参数和阈值,提高策略的适应性。
- 可以将该策略与其他策略进行组合,如趋势策略、均值回归策略等,建立策略体系,提高整体收益。
通过以上优化,可以进一步提升一目均衡动力指数策略的表现和稳定性。
总结
一目均衡动力指数策略是一个有效的技术分析策略。它巧妙地结合了一目均衡指标和随机动量指数两个经典指标,互为补充,可以比较全面地分析市场的超买超卖情况和趋势转折点,为交易决策提供依据。该策略logic清晰,适用性广,具有较强的实用价值。当然,任何策略都有其局限性和风险,在实际应用中需要进一步优化和改进,并结合其他分析手段和风控措施,才能更好地发挥效用。总的来说,一目均衡动力指数策略为量化交易提供了一个新的思路和方法,值得进一步探索和研究。
策略源码
/*backtest
start: 2023-03-09 00:00:00
end: 2024-03-14 00:00:00
period: 1d
basePeriod: 1h
exchanges: [{"eid":"Futures_Binance","currency":"BTC_USDT"}]
*/

// This Pine Script™ code is subject to the terms of the Mozilla Public License 2.0 at https://mozilla.org/MPL/2.0/
// © manoharbauskar

//@version=5
strategy(title='Ichimoku Oscillator with SMI', shorttitle='IOSMI', overlay = false)
io = ta.ema(hl2, 9) / 2 + ta.ema(hl2, 26) / 2 + ta.sma(close, 14) - ta.ema(hl2, 52) - ta.sma(open, 14)
plot(io, color=ta.change(io) <= 0 ? #872323 : #007F0E, style=plot.style_columns)
a = input(21, 'Percent K Length')
b = input(9, 'Percent D Length')
// Range Calculation
ll = ta.lowest(low, a)
hh = ta.highest(high, a)
diff = hh - ll
rdiff = close - (hh + ll) / 2
// Nested Moving Average for smoother curves
avgrel = ta.ema(ta.ema(rdiff, b), b)
avgdiff = ta.ema(ta.ema(diff, b), b)
// SMI calculations
SMI = avgdiff != 0 ? avgrel / (avgdiff / 2) * 100 : 0
SMIsignal = ta.ema(SMI, b)
//All PLOTS
plot(SMI, color = color.blue , title='Stochastic Momentum Index', linewidth = 2)
plot(SMIsignal, color=color.new(#FF5252, 0), title='SMI Signal Line', linewidth = 2)
plot(60, color=color.new(#00E676, 0), title='Over Bought')
plot(-60, color=color.new(#FF9800, 0), title='Over Sold')
plot(0, color=color.new(#E040FB, 0), title='Zero Line')

longCondition = SMI > SMIsignal and io > 0
if (longCondition)
    strategy.entry("Buy", strategy.long)

shortCondition = SMI < SMIsignal and io < 0
if (shortCondition)
    strategy.entry("Sell", strategy.short)