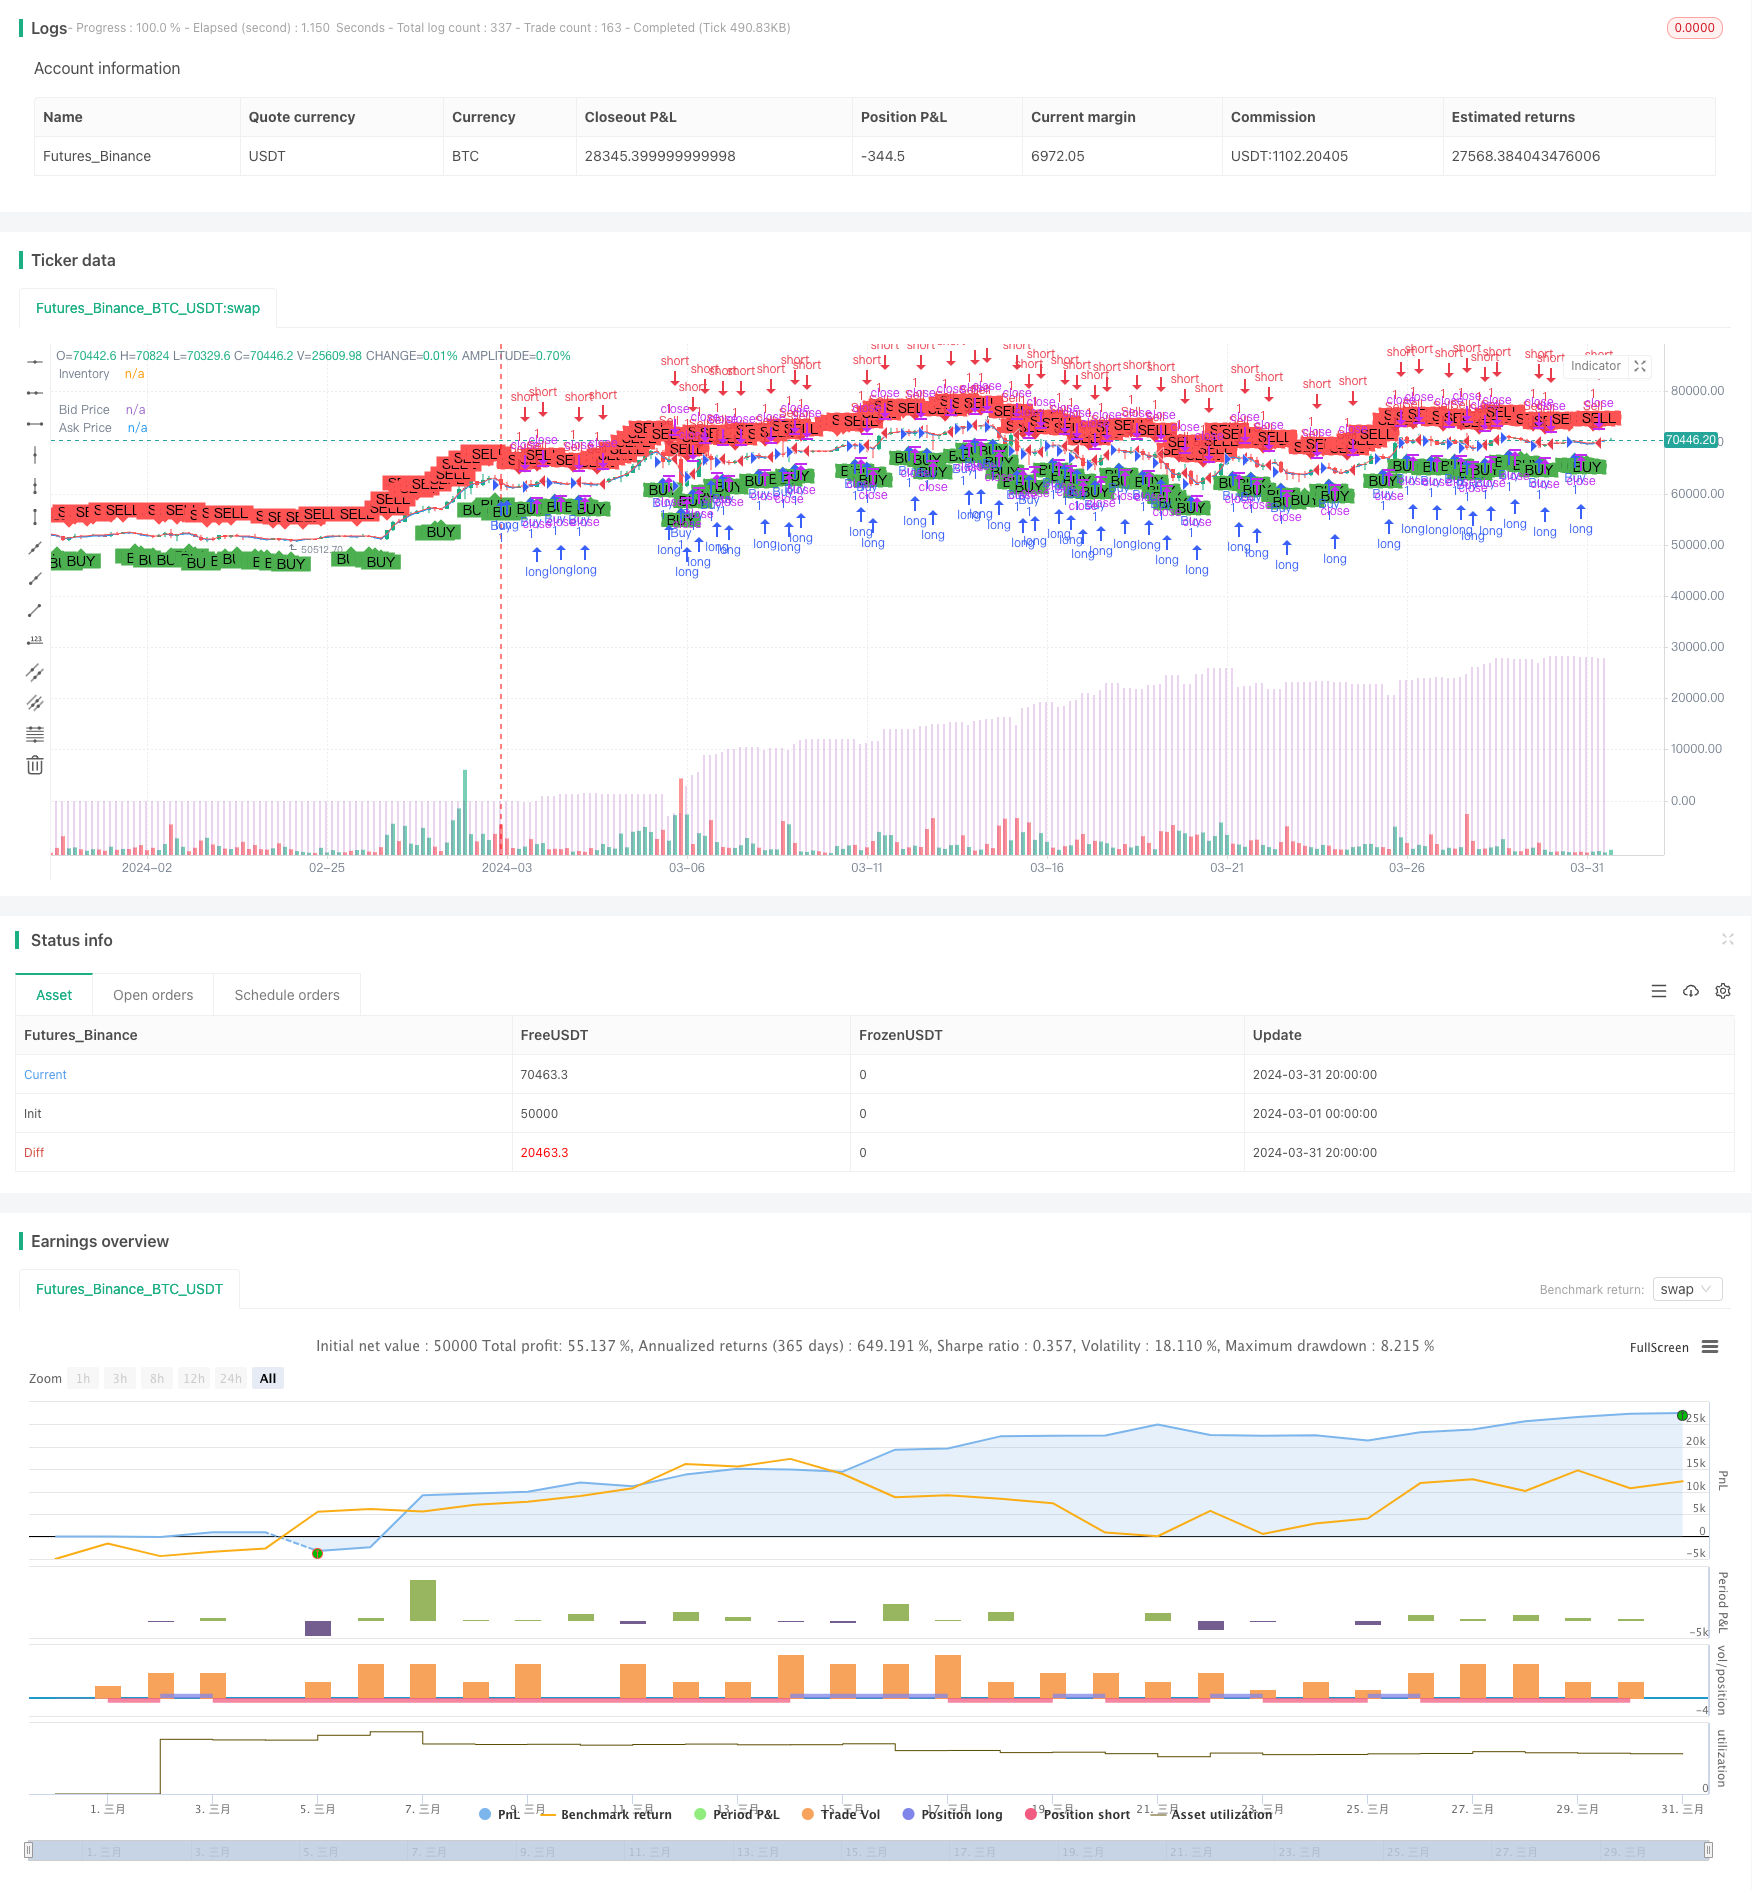
Khaled Tamim's Avellaneda-Stoikov Strategy
Author: ChaoZhang, Date: 2024-04-30 15:54:23Tags:

Overview
Khaled Tamim’s Avellaneda-Stoikov Strategy is a quantitative trading strategy based on the Avellaneda-Stoikov model. The strategy determines buy and sell signals by calculating the mid-price, bid price, and ask price while considering transaction costs. The main idea of the strategy is to buy when the price is below the bid price by a certain threshold and sell when the price is above the ask price by a certain threshold, thereby capturing the spread profit.
Strategy Principle
The core of this strategy is the Avellaneda-Stoikov model, which calculates the bid and ask prices through the following steps: 1. Calculate the mid-price, which is the average of the current price and the previous price. 2. Calculate the bid price by subtracting a square root term containing Gamma, Sigma, T, and k from the mid-price, and then subtracting the transaction cost. 3. Calculate the ask price by adding a square root term containing Gamma, Sigma, T, and k to the mid-price, and then adding the transaction cost. 4. Generate a buy signal when the price is below the bid price minus the threshold M; generate a sell signal when the price is above the ask price plus the threshold M.
Strategy Advantages
- This strategy is based on the Avellaneda-Stoikov model, which is a classic market-making strategy with a solid theoretical foundation.
- The strategy takes into account the impact of transaction costs, making it more realistic to actual trading situations.
- By setting the threshold M, the sensitivity of the strategy can be flexibly adjusted to adapt to different market environments.
- The strategy logic is clear and easy to understand and implement.
Strategy Risks
- The performance of the strategy depends on the choice of parameters such as Gamma, Sigma, T, k, and M. Improper parameter settings may lead to poor strategy performance.
- The strategy does not consider the impact of market liquidity. In cases of insufficient liquidity, it may not be possible to trade at the expected price.
- This strategy is a high-frequency trading strategy that requires low trading latency and high execution efficiency, making it difficult to implement.
Strategy Optimization Directions
- Introduce machine learning algorithms to dynamically adjust strategy parameters to adapt to different market conditions.
- Combine other technical indicators or market microstructure information to improve signal accuracy.
- Optimize the trading execution algorithm to reduce transaction costs and improve strategy returns.
- Consider introducing a risk management module to control strategy drawdowns and risk exposure.
Summary
Khaled Tamim’s Avellaneda-Stoikov Strategy is a quantitative trading strategy based on the classic market-making model. It generates trading signals by calculating bid and ask prices while considering transaction costs. The strategy’s advantages lie in its solid theoretical foundation, clear logic, and consideration of transaction costs. However, the strategy’s performance depends on parameter selection and requires high execution efficiency. In the future, the strategy can be further optimized by introducing machine learning algorithms, optimizing trade execution, introducing risk management, and other methods.
/*backtest
start: 2024-03-01 00:00:00
end: 2024-03-31 23:59:59
period: 4h
basePeriod: 15m
exchanges: [{"eid":"Futures_Binance","currency":"BTC_USDT"}]
*/

//@version=5
strategy("Khaled Tamim's Avellaneda-Stoikov Strategy", overlay=true)

// Avellaneda-Stoikov model logic
avellanedaStoikov(src, gamma, sigma, T, k, M) =>
    midPrice = (src + src[1]) / 2
    sqrtTerm = gamma * sigma * sigma * T
    // Add 0.1% fee to bid and ask quotes
    fee = 0 // 0.1% fee
    bidQuote = midPrice - k * sqrtTerm - (midPrice * fee)
    askQuote = midPrice + k * sqrtTerm + (midPrice * fee)
    longCondition = src < bidQuote - M
    shortCondition = src > askQuote + M
    [bidQuote, askQuote]

// Define strategy parameters
gamma = input.float(2, title="Gamma")
sigma = input.float(8, title="Sigma")
T = input.float(0.0833, title="T")
k = input.float(5, title="k")
M = input.float(0.5, title="M")

// Calculate signals
[bidQuote, askQuote] = avellanedaStoikov(close, gamma, sigma, T, k, M)
longCondition = close < bidQuote - M
shortCondition = close > askQuote + M

// Plot signals
plotshape(series=longCondition ? low : na, title="Buy Signal", location=location.belowbar, color=color.green, style=shape.labelup, text="BUY")
plotshape(series=shortCondition ? high : na, title="Sell Signal", location=location.abovebar, color=color.red, style=shape.labeldown, text="SELL")

// Plot bid and ask prices
plot(bidQuote, title="Bid Price", color=color.blue, linewidth=1)
plot(askQuote, title="Ask Price", color=color.red, linewidth=1)

// Plot inventory level as bars in a separate graph
plot(strategy.netprofit, title="Inventory", color=color.new(color.purple, 80), style=plot.style_columns)


// Strategy logic
if (longCondition)
    strategy.entry("Buy", strategy.long)

if (shortCondition)
    strategy.entry("Sell", strategy.short)
- Bollinger Bands Standard Deviation Breakout Strategy
- Stochastic Oscillator and Moving Average Strategy
- Pivot and Momentum Strategy
- Triple EMA Crossover Strategy
- Moving Average and RSI Comprehensive Trading Strategy
- Exponential Moving Average Crossover Leverage Strategy
- Price Action, Pyramiding, 5% Profit Target, 3% Stop Loss
- Turnaround Tuesday Strategy (Weekend Filter)
- Bollinger Bands Double Standard Deviation Filtering 5-Minute Quantitative Trading Strategy
- Pivot Reversal Strategy with Pivot Exit
- GM-8 & ADX Dual Moving Average Strategy
- Multi-Timeframe Bitcoin, Binance Coin, and Ethereum Pullback Trading Strategy
- Enhanced EMA Crossover Strategy with RSI/MACD/ATR
- Fibonacci Golden Ratio Retracement Buying Strategy
- Z-Score Trend Following Strategy
- MA99 Touch and Dynamic Stop-Loss Strategy
- Donchian Breakout Trading Strategy
- Ichimoku Leading Span B Breakout Strategy
- Long Entry on EMA Cross with Risk Management Strategy
- MACD and RSI Combined Long-term Trading Strategy