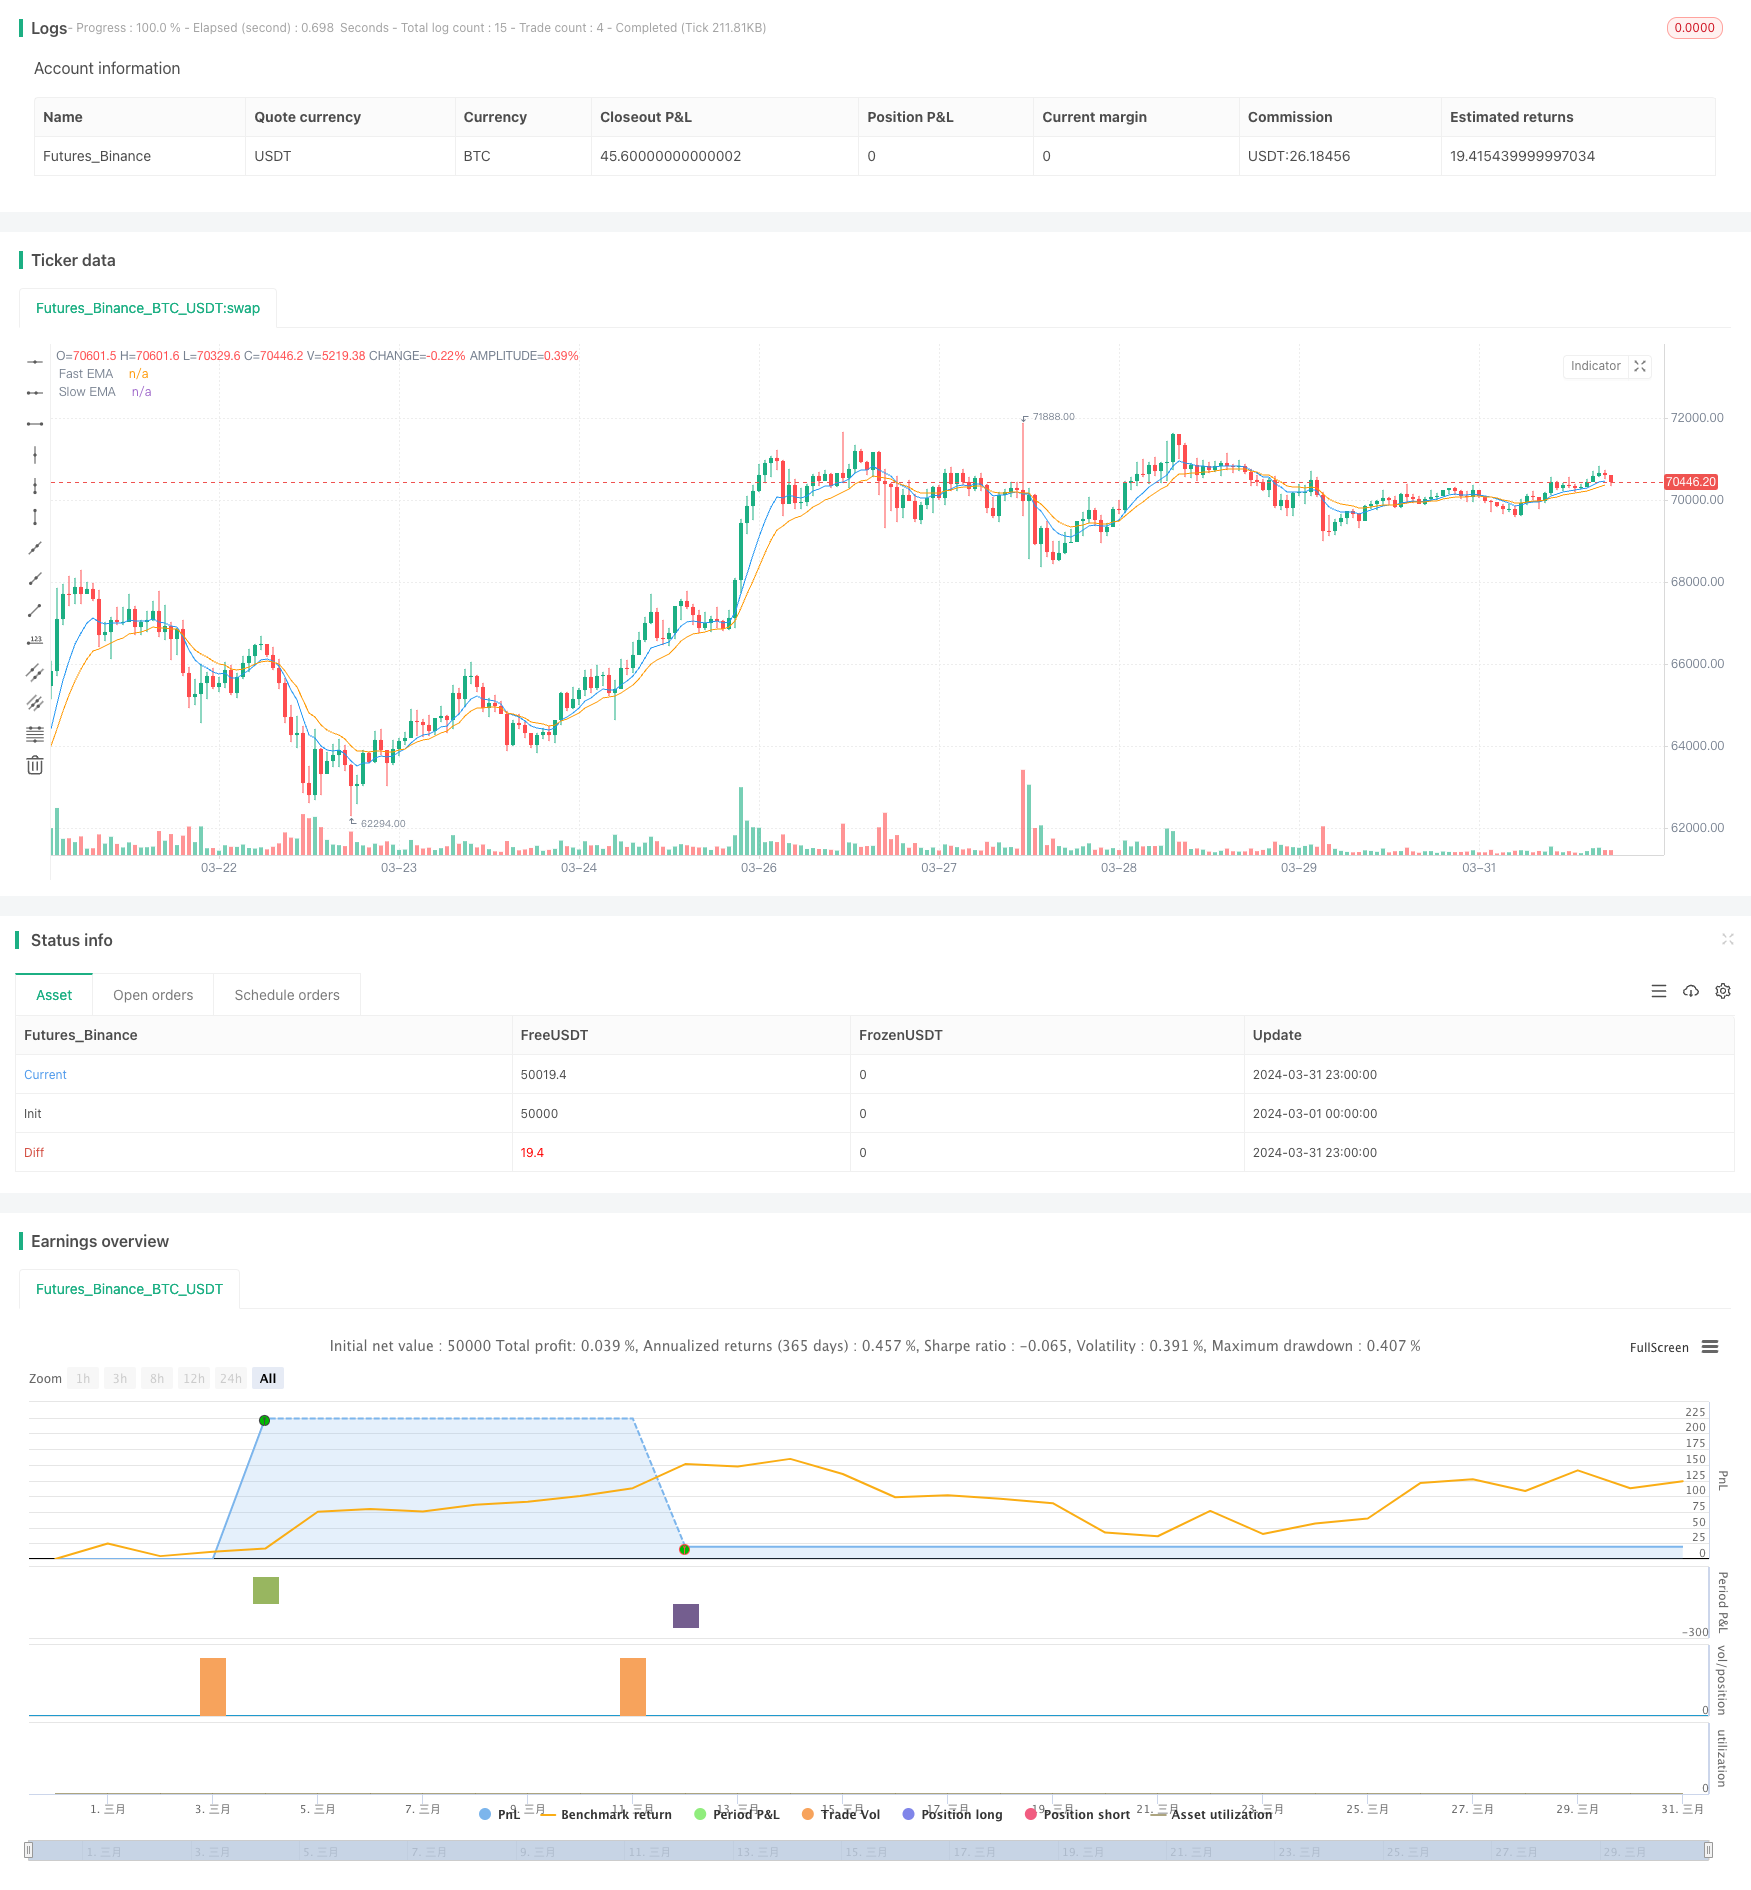
概述
这个策略使用两条指数移动平均线(EMA)的交叉作为主要的交易信号,同时结合了相对强弱指数(RSI)、移动平均线聚散指标(MACD)和平均真实波幅(ATR)作为辅助指标,以提高交易信号的可靠性。当快速EMA上穿慢速EMA,且RSI低于70,MACD线在信号线之上,ATR值比前一周期上涨10%以上时,产生做多信号;反之,当快速EMA下穿慢速EMA,且RSI高于30,MACD线在信号线之下,ATR值比前一周期上涨10%以上时,产生做空信号。该策略还设置了固定点数的止损和止盈,以控制风险。
策略原理
- 计算8周期和14周期的EMA,作为快速线和慢速线。
- 计算14周期的RSI和MACD指标,MACD使用12、26、9作为参数。
- 计算14周期的ATR值。
- 当快速EMA上穿慢速EMA,RSI低于70,MACD线在信号线之上,且ATR值比前一周期上涨10%以上时,产生做多信号。
- 当快速EMA下穿慢速EMA,RSI高于30,MACD线在信号线之下,且ATR值比前一周期上涨10%以上时,产生做空信号。
- 设置100点的止损和200点的止盈。
- 根据交易信号执行交易,并按照止损止盈设置退出交易。
策略优势
- 结合了多个技术指标,提高了交易信号的可靠性。
- 使用ATR作为过滤条件,只在市场波动加大时进行交易,避免了在波动较小的区间内频繁交易。
- 设置了固定点数的止损和止盈,有效控制了风险。
- 代码简洁易懂,易于理解和优化。
策略风险
- 在某些市场条件下,如震荡市或趋势反转初期,该策略可能会产生较多的虚假信号。
- 固定点数的止损和止盈可能无法适应不同的市场波动情况,有时可能导致止损过早或止盈过晚。
- 该策略没有考虑市场的基本面因素,完全依赖技术指标,在某些情况下可能会出现与市场脱节的现象。
策略优化方向
- 可以考虑引入更多的技术指标或者市场情绪指标,如布林带、成交量等,以进一步提高信号的可靠性。
- 可以优化止损和止盈的设置,如采用动态止损止盈或者基于波动率的止损止盈,以更好地适应市场的变化。
- 可以结合基本面分析,如经济数据、重大事件等,对交易信号进行过滤,以避免在某些特殊情况下出现错误信号。
- 可以对参数进行优化,如EMA的周期、RSI和MACD的参数等,以找到最适合当前市场的参数组合。
总结
该策略通过结合EMA、RSI、MACD和ATR等多个技术指标,生成较为可靠的交易信号,同时通过设置固定点数的止损止盈来控制风险。虽然该策略还有一些不足之处,但通过进一步的优化和改进,如引入更多指标、优化止损止盈、结合基本面分析等,可以提高该策略的表现。总的来说,该策略思路清晰,易于理解和实现,适合初学者学习和使用。
策略源码
/*backtest
start: 2024-03-01 00:00:00
end: 2024-03-31 23:59:59
period: 1h
basePeriod: 15m
exchanges: [{"eid":"Futures_Binance","currency":"BTC_USDT"}]
*/

//@version=4
strategy("Enhanced EMA Crossover Strategy", overlay=true)

// Indicators
ema_fast = ema(close, 8)
ema_slow = ema(close, 14)
rsi = rsi(close, 14)

// Correcting the MACD variable definitions
[macd_line, signal_line, _] = macd(close, 12, 26, 9)
atr_value = atr(14)

// Entry conditions with additional filters
long_condition = crossover(ema_fast, ema_slow) and rsi < 70 and (macd_line > signal_line) and atr_value > atr_value[1] * 1.1
short_condition = crossunder(ema_fast, ema_slow) and rsi > 30 and (macd_line < signal_line) and atr_value > atr_value[1] * 1.1

// Adding debug information
plotshape(series=long_condition, color=color.green, location=location.belowbar, style=shape.xcross, title="Long Signal")
plotshape(series=short_condition, color=color.red, location=location.abovebar, style=shape.xcross, title="Short Signal")

// Risk management based on a fixed number of points
stop_loss_points = 100
take_profit_points = 200

// Order execution
if (long_condition)
    strategy.entry("Long", strategy.long, comment="Long Entry")
    strategy.exit("Exit Long", "Long", stop=close - stop_loss_points, limit=close + take_profit_points)

if (short_condition)
    strategy.entry("Short", strategy.short, comment="Short Entry")
    strategy.exit("Exit Short", "Short", stop=close + stop_loss_points, limit=close - take_profit_points)

// Plotting EMAs for reference
plot(ema_fast, color=color.blue, title="Fast EMA")
plot(ema_slow, color=color.orange, title="Slow EMA")
相关推荐