布林带标准差突破策略
Author: ChaoZhang, Date: 2024-04-30 16:51:34Tags: SMA
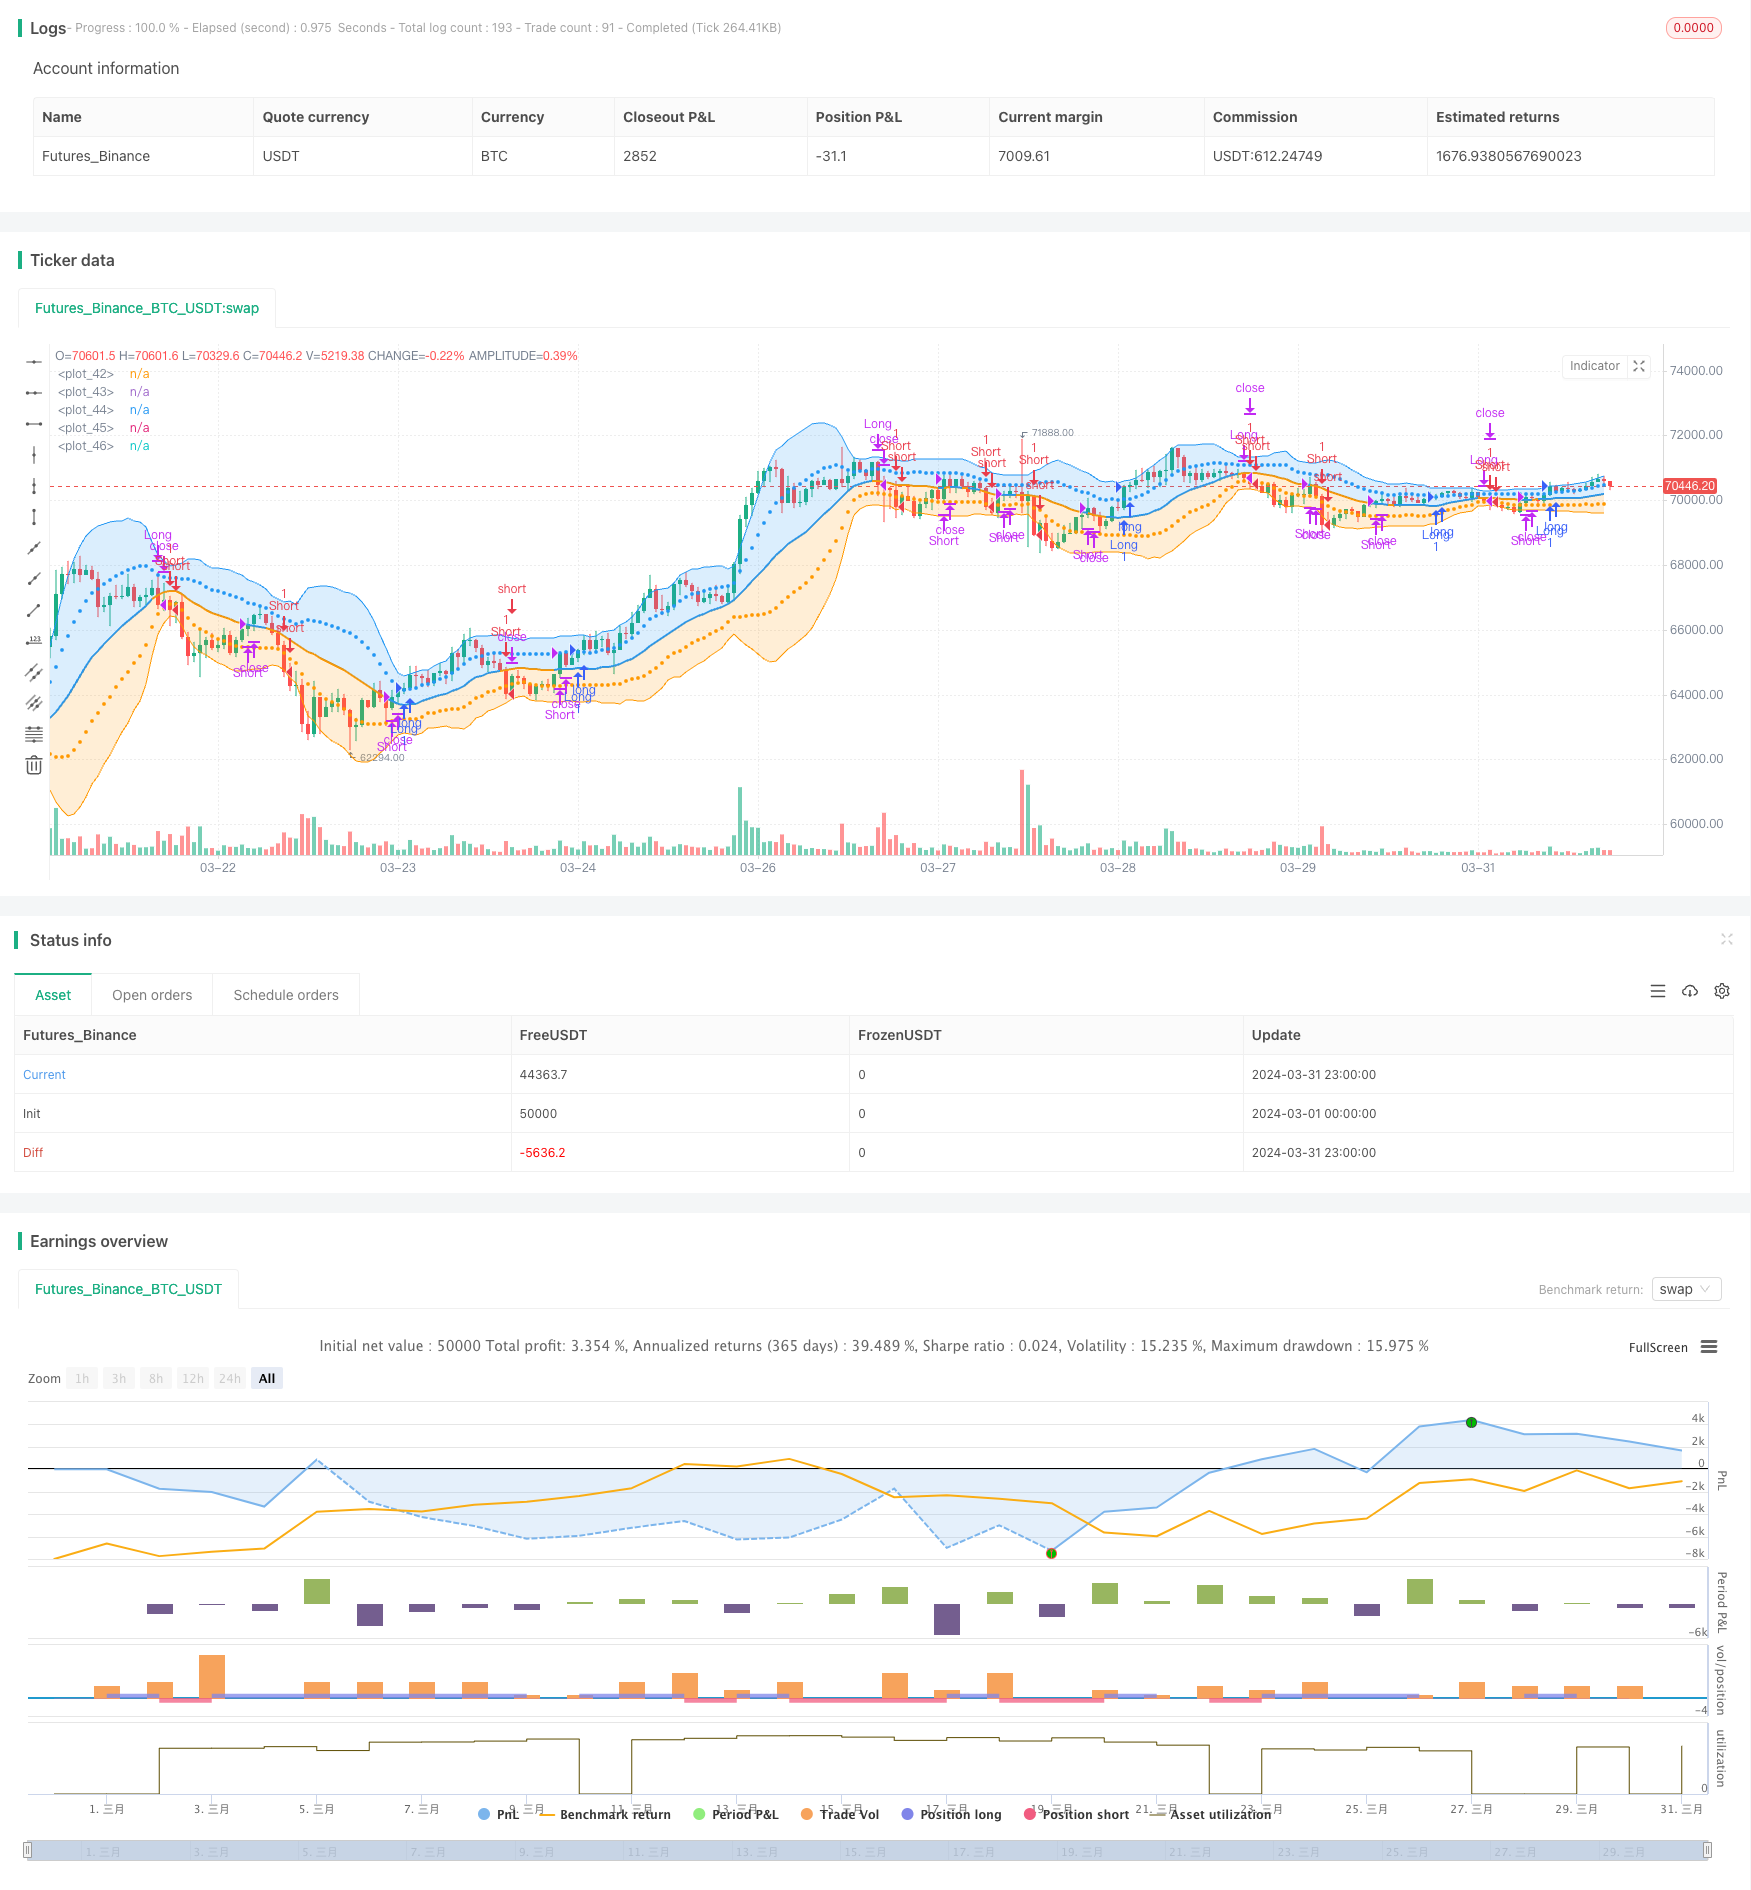
概述
该策略基于布林带指标,当收盘价突破上轨时开多头仓位,当收盘价跌破下轨时开空头仓位。多头平仓条件为价格跌破中轨,空头平仓条件为价格突破中轨。该策略利用价格相对于布林带上下轨的位置来判断趋势方向和开平仓时机。
策略原理
- 计算布林带上中下轨。中轨为收盘价的简单移动平均线,上下轨为中轨加减一定倍数的标准差。
- 当收盘价突破上轨时,开多头仓位。
- 当收盘价跌破下轨时,开空头仓位。
- 当持有多头仓位时,如果收盘价跌破中轨,则平多头仓位。
- 当持有空头仓位时,如果收盘价突破中轨,则平空头仓位。
策略优势
- 布林带能够有效反映价格的波动范围和趋势方向,利用价格相对于布林带的位置开平仓,能够捕捉趋势行情。
- 上下轨距离中轨一定标准差,能够自适应价格波动率的变化,标准差越大,上下轨距离中轨越远。
- 平仓条件使用中轨,而不是反向突破上下轨,可以尽早止损止盈。
- 参数可调整,可以优化布林带周期、标准差倍数等参数来适应不同品种和周期。
策略风险
- 震荡市中,价格在上下轨附近反复波动,可能会发生频繁开平仓,导致交易成本增加。
- 当价格加速趋势运动时,开仓点相对滞后,跟风能力较弱。
- 趋势转折初期,回撤触及中轨平仓,而趋势继续发展时,会错失后续行情。
策略优化方向
- 可以结合ATR等止损指标,控制回撤。
- 可以使用多空仓位动态比例调整,根据趋势强度灵活配置仓位。
- 开仓条件可以结合更多过滤条件,如量价指标,以提高开仓信号可靠性。
总结
该策略是一个经典的趋势追踪型策略,通过布林带来捕捉趋势行情。策略逻辑清晰,优势明显,同时也存在一定风险。通过优化止损止盈、仓位管理和开仓过滤等,可以改进策略绩效,提高适应性。但是任何策略都有其局限性,需要结合实际市场状况灵活运用。
/*backtest
start: 2024-03-01 00:00:00
end: 2024-03-31 23:59:59
period: 1h
basePeriod: 15m
exchanges: [{"eid":"Futures_Binance","currency":"BTC_USDT"}]
*/

//@version=5
// Bollinger Bands: Madrid : 14/SEP/2014 11:07 : 2.0
// This displays the traditional Bollinger Bands, the difference is
// that the 1st and 2nd StdDev are outlined with two colors and two
// different levels, one for each Standard Deviation

strategy(shorttitle='MBB', title='Bollinger Bands', overlay=true)
src = input(close)
length = input.int(20, minval=1, title = "Length")
mult = input.float(2.0, minval=0.001, maxval=50, title = "Multiplier")

basis = ta.sma(src, length)
dev = ta.stdev(src, length)
dev2 = mult * dev

upper1 = basis + dev
lower1 = basis - dev
upper2 = basis + dev2
lower2 = basis - dev2

// Strategy
long_condition = ta.crossover(close, upper1)
short_condition = ta.crossunder(close, lower1)

if (long_condition)
    strategy.entry("Long", strategy.long)
if (short_condition)
    strategy.entry("Short", strategy.short)

// Exit conditions
exit_long_condition = ta.crossunder(close, basis)
exit_short_condition = ta.crossover(close, basis)

if (exit_long_condition)
    strategy.close("Long")
if (exit_short_condition)
    strategy.close("Short")


colorBasis = src >= basis ? color.blue : color.orange

pBasis = plot(basis, linewidth=2, color=colorBasis)
pUpper1 = plot(upper1, color=color.new(color.blue, 0), style=plot.style_circles)
pUpper2 = plot(upper2, color=color.new(color.blue, 0))
pLower1 = plot(lower1, color=color.new(color.orange, 0), style=plot.style_circles)
pLower2 = plot(lower2, color=color.new(color.orange, 0))

fill(pBasis, pUpper2, color=color.new(color.blue, 80))
fill(pUpper1, pUpper2, color=color.new(color.blue, 80))
fill(pBasis, pLower2, color=color.new(color.orange, 80))
fill(pLower1, pLower2, color=color.new(color.orange, 80))
相关内容
- 多维度趋势判断与ATR动态止盈止损策略
- 自适应布林带趋势反转量化交易策略
- 高级多指标趋势确认交易策略
- 双均线-RSI多重信号趋势交易策略
- 自适应趋势跟踪与多重确认交易策略
- 动态调整止损的大象柱形态趋势跟踪策略
- 多均线交叉辅助RSI动态参数量化交易策略
- 多维度K近邻算法与烛台形态的量价分析交易策略
- 基于移动平均线和日内模式的智能追踪止损策略
- 自适应多策略动态切换系统:融合趋势跟踪与区间震荡的量化交易策略
- 多指标多维度趋势交叉高级量化策略
更多内容
- 基于三根连续阴线和均线的动态止盈止损交易策略
- MOST与双均线交叉策略
- 布林带随机振荡器策略
- MACD RSI 一目均衡Ichimoku动量趋势多头策略
- 双均线交叉开仓策略
- 移动平均交叉策略
- RSI变动方向改变策略
- 基于连续MACD金叉死叉的交易策略
- 布林带突破策略
- 增强型布林带相对强弱指标交易策略
- 随机震荡指标与移动平均线策略
- 枢轴动量策略
- 三重EMA交叉策略
- 移动平均线与RSI综合交易策略
- 指数移动平均线交叉杠杆策略
- 价格行为, 金字塔加仓, 5%止盈, 3%止损
- 周二反转策略(周末过滤)
- 布林带标准差双层过滤五分钟量化交易策略
- 基于枢轴点反转和退出的交易策略
- Khaled Tamim's Avellaneda-Stoikov Strategy