Support and Resistance Strategy with Dynamic Risk Management System
Author: ChaoZhang, Date: 2024-07-29 14:01:49Tags: ATR
Overview
This quantitative trading strategy is based on the concept of support and resistance levels, combined with a dynamic risk management system. It utilizes Pivot Points to determine potential support and resistance levels, and executes trades when the price touches these key levels. The strategy also incorporates the Adaptive True Range (ATR) indicator to dynamically adjust stop-loss and take-profit levels, adapting to changes in market volatility. Additionally, the strategy considers money management and risk control by limiting the maximum amount per trade and using leverage to optimize capital utilization.
Strategy Principles
Support and Resistance Identification:
- Uses Pivot Point calculation method to determine potential support and resistance levels.
- Pivot Point formula: (Previous Day High + Previous Day Low + Previous Day Close) / 3
Entry Signals:
- Generates a long signal when the price touches or breaks through the support level.
- Generates a short signal when the price touches or breaks through the resistance level.
Risk Management:
- Uses the ATR indicator to dynamically set stop-loss and take-profit levels.
- Stop-loss is set at current price +/- (2 * ATR).
- Take-profit target is set at current price +/- (3 * ATR).
Position Sizing:
- Calculates position size based on risk percentage and maximum trade amount.
- Considers leverage factor to optimize capital utilization.
Trade Execution:
- Uses strategy.entry() function to execute trades.
- Uses strategy.exit() function to manage stop-loss and take-profit.
Strategy Advantages
Dynamic Adaptability: By using the ATR indicator, the strategy can automatically adjust stop-loss and take-profit levels based on market volatility, making it effective under different market conditions.
Risk Management: The strategy incorporates multiple layers of risk control measures, including dynamic stop-loss, fixed risk percentage, and maximum trade amount limit, helping to protect capital safety.
Leverage Optimization: Through reasonable use of leverage, the strategy can improve capital efficiency while controlling risk.
Technical Indicator Combination: The strategy combines classic technical analysis concepts (support and resistance) with modern quantitative indicators (ATR), forming a comprehensive trading system.
Flexibility: Strategy parameters can be adjusted according to different markets and personal risk preferences, showing good adaptability.
Strategy Risks
False Breakout Risk: In range-bound markets, prices may frequently touch support and resistance levels without forming true breakouts, leading to frequent false signals.
Performance in Trending Markets: In strong trend markets, the strategy may close positions too early, missing out on significant price movements.
Money Management Risk: Although the strategy limits the maximum amount per trade, it may still face significant drawdowns in case of consecutive losses.
Leverage Risk: Using high leverage can amplify losses, especially during extreme market volatility.
Slippage and Trading Costs: The strategy does not consider slippage and trading costs, which may affect actual trading results.
Strategy Optimization Directions
Trend Filtering: Introduce trend indicators (such as moving averages) to filter trade signals, only trading in the direction of the trend to reduce false breakouts.
Multi-Timeframe Analysis: Incorporate support and resistance levels from higher timeframes to improve the reliability of trading signals.
Dynamic Parameter Adjustment: Use adaptive algorithms to dynamically adjust ATR multipliers and risk percentages to adapt to different market states.
Add Trading Filters: Include additional conditions such as volume confirmation and volatility filters to improve trade quality.
Optimize Money Management: Implement a dynamic money management strategy, adjusting risk levels based on account performance.
Add Reversal Trades: While going long at support levels, consider going short at resistance levels to fully utilize market opportunities.
Consider Fundamental Factors: Integrate economic calendar data to avoid trading before and after important news releases.
Conclusion
The Support and Resistance Strategy with Dynamic Risk Management System is a comprehensive quantitative trading strategy that cleverly combines traditional technical analysis with modern quantitative methods. By using Pivot Points to identify key price levels and utilizing ATR for dynamic risk management, the strategy demonstrates potential to adapt to different market conditions. However, to further improve the strategy’s robustness and profitability, it is recommended to implement various optimizations, including adding trend filters, multi-timeframe analysis, and more sophisticated money management techniques. Through continuous improvement and backtesting, this strategy has the potential to become a reliable trading system, providing value for quantitative traders.
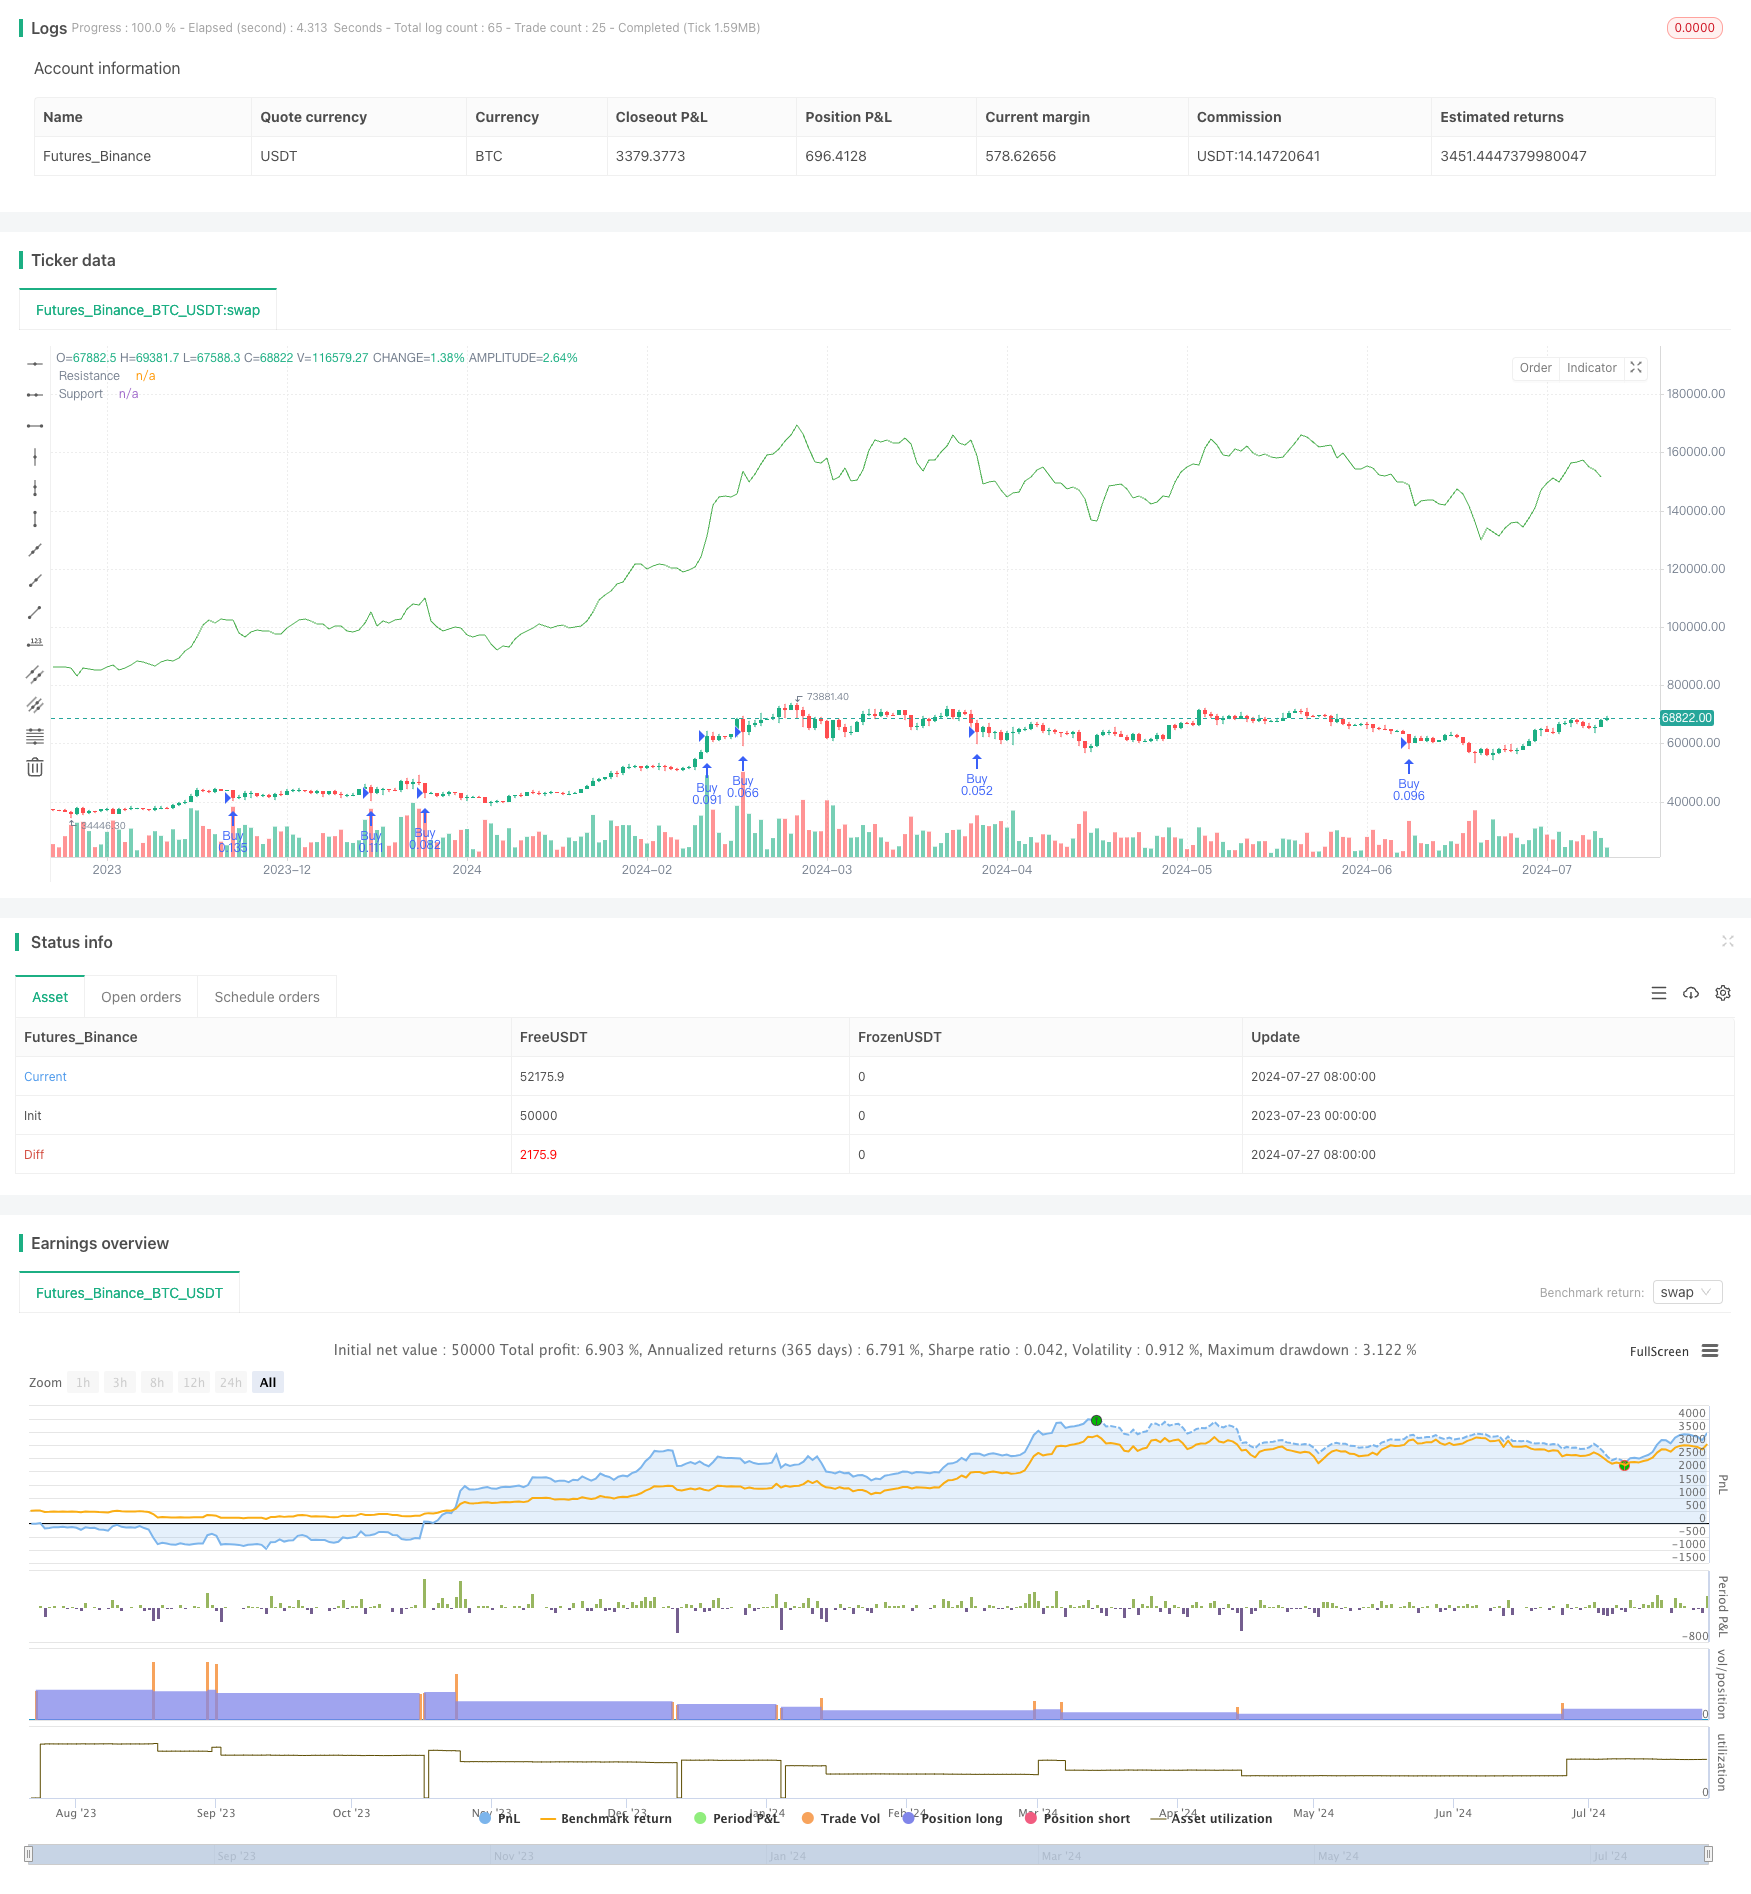
/*backtest
start: 2023-07-23 00:00:00
end: 2024-07-28 00:00:00
period: 1d
basePeriod: 1h
exchanges: [{"eid":"Futures_Binance","currency":"BTC_USDT"}]
*/

//@version=5
strategy('Mon Robot de Trading', overlay=true)

// Paramètres
capital = 2000  // Capital initial de 2000 euros
maxAmountPerTrade = 2000  // Montant maximum à utiliser par trade
leverage = 20  // Effet de levier de 1:20
spread = 0.5  // Spread moyen en pips
riskPerTrade = 0.2  // 20% du capital initial par transaction
atrLength = 14  // Longueur de l'ATR pour le trailing stop

// Calcul des points de pivot
pivotHigh = high[1] + low[1] + close[1] / 3
pivotLow = high[1] + low[1] + close[1] / 3

// Plot des points de pivot sur le graphique
plot(pivotHigh, color=color.new(color.red, 0), linewidth=1, title='Resistance')
plot(pivotLow, color=color.new(color.green, 0), linewidth=1, title='Support')

// Calcul de l'ATR pour la gestion du risque et du trailing stop
atrValue = ta.atr(atrLength)

// Calcul de la taille de la position basée sur le pourcentage de risque du capital et le montant maximum par trade
riskAmount = capital * riskPerTrade
positionSize = math.min(maxAmountPerTrade * leverage / (atrValue * 2), riskAmount / (atrValue * 2))  // Taille de la position en lots limitée par le montant maximum par trade et le risque autorisé

// Implémentation de la stratégie avec trailing stop et take-profit
if low <= pivotLow
    strategy.entry('Buy', strategy.long, qty=positionSize)

    // Définition de l'exit pour les achats (longs)
    stopLossPrice = close - (atrValue * 2 + spread / 10)
    takeProfitPrice = close + atrValue * 3 - spread / 10
    strategy.exit('Exit Buy', 'Buy', stop=stopLossPrice, limit=takeProfitPrice)

if high >= pivotHigh
    strategy.entry('Sell', strategy.short, qty=positionSize)

    // Définition de l'exit pour les ventes (courts)
    stopLossPrice = close + atrValue * 2 + spread / 10
    takeProfitPrice = close - (atrValue * 3 - spread / 10)
    strategy.exit('Exit Sell', 'Sell', stop=stopLossPrice, limit=takeProfitPrice)
- Dynamic Dual-Indicator Momentum Trend Quantitative Strategy System
- Multi-Dimensional Trend Analysis with ATR-Based Dynamic Stop Management Strategy
- Advanced Multi-Indicator Trend Confirmation Trading Strategy
- SMA-Based Intelligent Trailing Stop Strategy with Intraday Pattern Recognition
- Multi-Factor Regression and Dynamic Price Band Quantitative Trading System
- Multi-Smoothed Moving Average Dynamic Crossover Trend Following Strategy with Multiple Confirmations
- Advanced Dynamic Stop-Loss Strategy Based on Large Candles and RSI Divergence
- Multi-Indicator Synergistic Trend Reversal Quantitative Trading Strategy
- Multi-Channel Dynamic Support Resistance Keltner Channel Strategy
- Machine Learning Adaptive SuperTrend Quantitative Trading Strategy
- Volatility Stop Based EMA Trend Following Trading Strategy
- Multi-Timeframe Hull Moving Average Crossover Strategy
- Dynamic Trailing Stop Dual Target Moving Average Crossover Strategy
- Dynamic Adaptive Momentum Breakout Strategy
- Adaptive Moving Average Crossover with Trailing Stop-Loss Strategy
- EMA Trend-Following Automated Trading Strategy
- Darvas Box Breakout and Risk Management Strategy
- Multi-Timeframe Exponential Moving Average Crossover Strategy with Risk-Reward Optimization
- SMA Crossover Long-Short Strategy with Peak Drawdown Control and Auto-Termination
- High-Frequency Flip Percentage Tracking Momentum Strategy
- SMI and Pivot Point Momentum Crossover Strategy
- RSI-Bollinger Bands Integration Strategy: A Dynamic Self-Adaptive Multi-Indicator Trading System
- Multi-Timeframe Trend Following and Order Block Quantitative Trading Strategy
- Technical Support and Resistance Indicator Precision Trading Strategy
- Multi-Moving Average Crossover Trend Following Strategy with Volatility Filter
- MACD Crossover Momentum Strategy with Dynamic Take Profit and Stop Loss Optimization
- Big Red Candle Breakout Buy Strategy
- Adaptive Multi-Moving Average Crossover Dynamic Trading Strategy
- Dynamic Low-Price Entry and Stop-Loss Strategy Based on RSI
- Cloud Momentum Crossover Strategy with Moving Averages and Volume Confirmation
- ATR-RSI Enhanced Trend Following Trading System