Multi-Timeframe Exponential Moving Average Crossover Strategy with Risk-Reward Optimization
Author: ChaoZhang, Date: 2024-07-29 14:20:16Tags: EMAATRRSIRR
Overview
This strategy is a multi-timeframe exponential moving average (EMA) crossover system combined with risk-reward ratio optimization. It utilizes crossover signals from fast and slow EMAs across different timeframes while incorporating the Average True Range (ATR) indicator for dynamic stop-loss and take-profit levels. This approach aims to capture market trends while managing trade risk through a predefined risk-reward ratio.
Strategy Principles
The core principles of this strategy include the following key elements:
-
Multi-timeframe analysis: The strategy considers EMA crossovers on both the current timeframe and a higher timeframe (4-hour) to confirm stronger trend signals.
-
EMA crossover: It uses 9-period and 21-period EMAs as fast and slow lines. A buy signal is generated when the fast line crosses above the slow line, and vice versa for sell signals.
-
Trend confirmation: Trades are only executed when the current price is above (for longs) or below (for shorts) the higher timeframe EMA.
-
Risk management: ATR is used to set dynamic stop-loss levels, with the stop distance set at 1.5 times the ATR.
-
Risk-reward optimization: Take-profit levels are automatically set based on a user-defined risk-reward ratio (default 5.0).
-
Visualization: The strategy plots various EMA lines and trade signals on the chart for intuitive market analysis.
Strategy Advantages
-
Multi-dimensional analysis: By combining information from multiple timeframes, the strategy can more accurately identify strong market trends and reduce false signals.
-
Dynamic risk management: Using ATR to set stop-losses allows for adaptive adjustment based on market volatility, increasing the strategy’s flexibility and robustness.
-
Optimized risk-reward ratio: Allows traders to set an ideal risk-reward ratio based on their risk preferences, contributing to long-term profitability.
-
Clear visualization: Intuitive display of various indicators and signals on the chart helps traders better understand and analyze market dynamics.
-
Flexibility: Strategy parameters can be adjusted for different markets and trading styles, offering high adaptability.
Strategy Risks
-
Over-reliance on technical indicators: The strategy is primarily based on EMAs and ATR, potentially overlooking other important market factors such as fundamentals and market sentiment.
-
Lag: EMAs are inherently lagging indicators, which may lead to delayed entries or exits in rapidly changing markets.
-
False breakout risk: In ranging markets, EMA crossovers may produce frequent false signals, leading to overtrading.
-
Limitations of fixed risk-reward ratio: While the risk-reward ratio can be set, a fixed ratio may not be suitable for all market conditions.
-
Lack of market state identification: The strategy doesn’t explicitly distinguish between trending and ranging markets, which may lead to suboptimal performance in certain market environments.
Strategy Optimization Directions
-
Incorporate momentum indicators: Consider adding RSI or MACD to confirm trend strength and potential reversal signals.
-
Implement volatility filters: Introduce an ATR-based volatility filter to avoid trading during low volatility periods, reducing false signals.
-
Dynamic risk-reward ratio adjustment: Develop a mechanism to dynamically adjust the risk-reward ratio based on market conditions.
-
Add market state identification: Introduce a market state classification algorithm to switch strategy parameters or trading logic between trending and ranging markets.
-
Optimize parameter selection: Use historical data for backtesting to find optimal parameter combinations for different market conditions.
-
Integrate volume analysis: Incorporate volume indicators to validate price movements’ validity and strength.
Conclusion
The Multi-Timeframe Exponential Moving Average Crossover Strategy with Risk-Reward Optimization is a comprehensive trading system that combines trend following with risk management. By fusing EMA signals from multiple timeframes and implementing dynamic risk control mechanisms, the strategy aims to capture strong, sustained market trends while effectively managing trading risk. While the strategy shows promising characteristics, it still has some inherent limitations and risks. Through further optimization and improvements, such as integrating additional technical indicators, introducing market state identification, and dynamic parameter adjustments, the strategy has the potential to become a more comprehensive and robust trading system. However, traders should still exercise caution in practical application, conduct thorough backtesting and forward testing, and adjust strategy parameters according to individual risk tolerance and market insights.
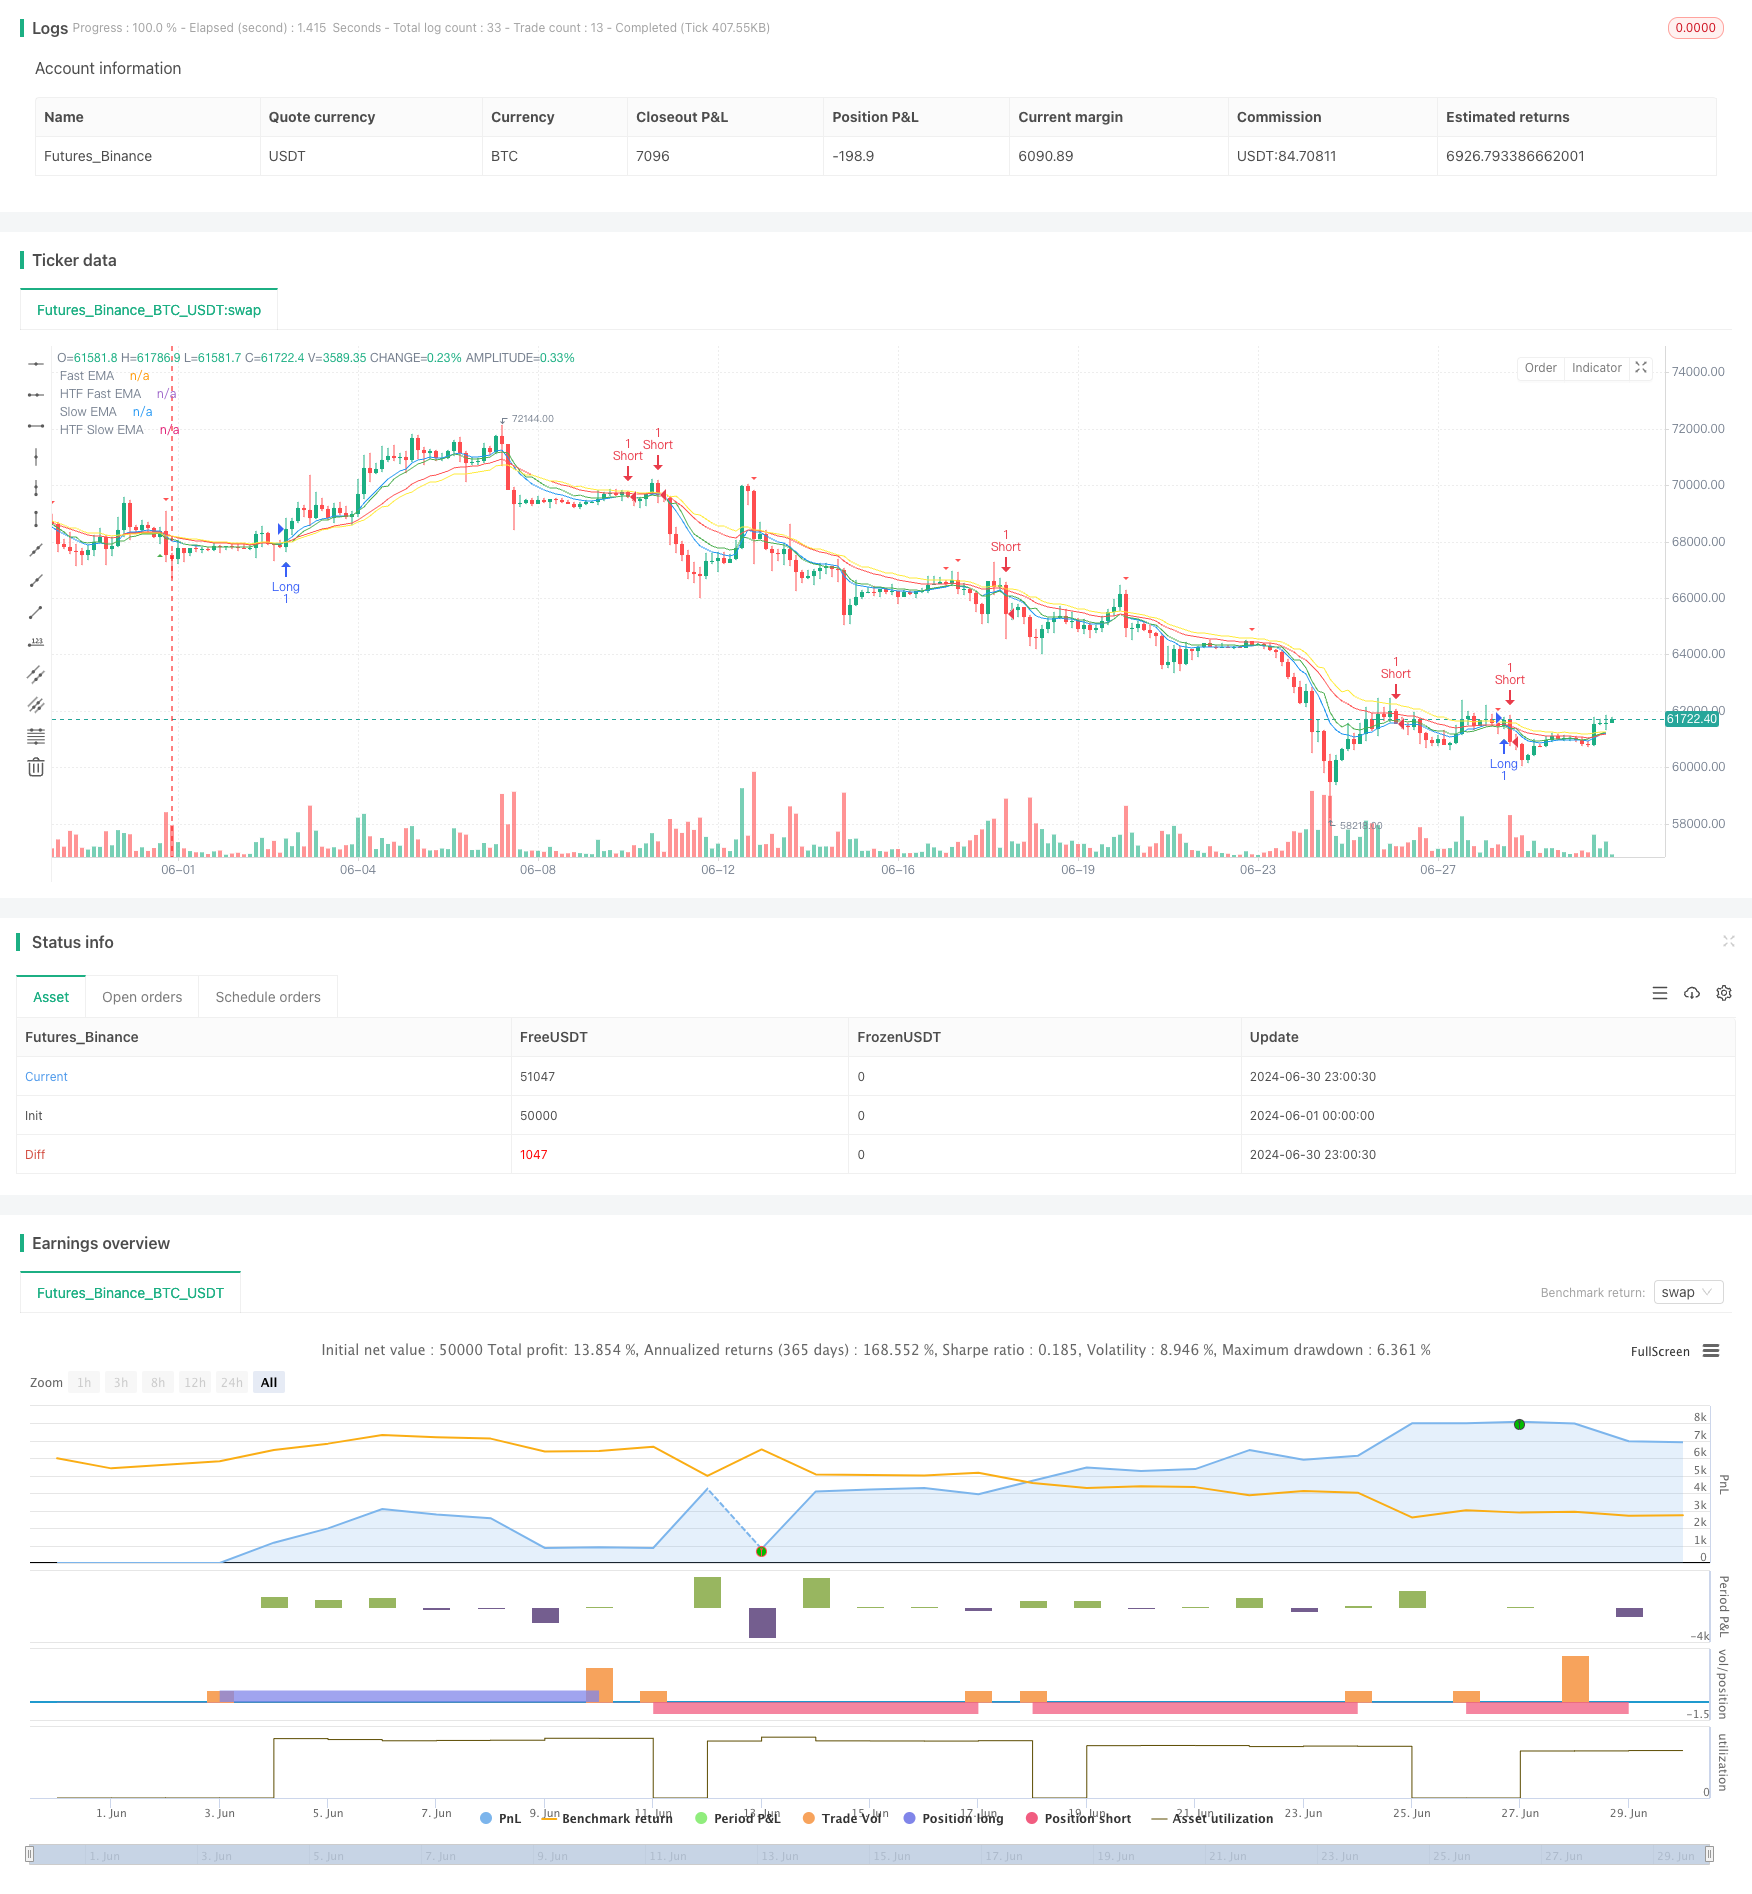
/*backtest
start: 2024-06-01 00:00:00
end: 2024-06-30 23:59:59
period: 3h
basePeriod: 15m
exchanges: [{"eid":"Futures_Binance","currency":"BTC_USDT"}]
*/

//@version=5
strategy("Simplified MTF Strategy with RR Ratio", overlay=true)

// ????? ??????????
fastEMA = input.int(9, "Fast EMA")
slowEMA = input.int(21, "Slow EMA")
atrPeriod = input.int(14, "ATR Period")
rrRatio = input.float(5.0, "Risk-Reward Ratio", minval=1.0, step=0.1)

// ?????????? ?? ????
ema_fast = ta.ema(close, fastEMA)
ema_slow = ta.ema(close, slowEMA)
atr = ta.atr(atrPeriod)

// ???? ????????? EMA
htf_ema_fast = request.security(syminfo.tickerid, "240", ta.ema(close, fastEMA))
htf_ema_slow = request.security(syminfo.tickerid, "240", ta.ema(close, slowEMA))

// ?????? ???????
upTrend = ema_fast > ema_slow and close > htf_ema_fast
downTrend = ema_fast < ema_slow and close < htf_ema_slow

// ?????? ???????
longCondition = upTrend and ta.crossover(close, ema_slow)
shortCondition = downTrend and ta.crossunder(close, ema_slow)

// ????? ?? ??????? ?? ????
riskAmount = atr * 1.5
rewardAmount = riskAmount * rrRatio

// ???????? ?????
if (longCondition)
    strategy.entry("Long", strategy.long)
    strategy.exit("Exit Long", "Long", stop=strategy.position_avg_price - riskAmount, limit=strategy.position_avg_price + rewardAmount)

if (shortCondition)
    strategy.entry("Short", strategy.short)
    strategy.exit("Exit Short", "Short", stop=strategy.position_avg_price + riskAmount, limit=strategy.position_avg_price - rewardAmount)

// ????????
plot(ema_fast, color=color.blue, title="Fast EMA")
plot(ema_slow, color=color.red, title="Slow EMA")
plot(htf_ema_fast, color=color.green, title="HTF Fast EMA")
plot(htf_ema_slow, color=color.yellow, title="HTF Slow EMA")

plotshape(longCondition, style=shape.triangleup, location=location.belowbar, color=color.green, size=size.small, title="Long Signal")
plotshape(shortCondition, style=shape.triangledown, location=location.abovebar, color=color.red, size=size.small, title="Short Signal")

// ?????-??????? ?????? ????
if (strategy.position_size != 0)
    label.new(bar_index, high, text="RR: 1:" + str.tostring(rrRatio, "#.##"), color=color.blue, textcolor=color.white, style=label.style_label_down, yloc=yloc.abovebar)

// ???????
alertcondition(longCondition, title="Long Signal", message="Potential long entry")
alertcondition(shortCondition, title="Short Signal", message="Potential short entry")
- Enhanced Bollinger Breakout Quantitative Strategy with Momentum Filter Integration System
- Dynamic Stop-Loss Multi-Period RSI Trend Following Strategy
- Gold Trend Channel Reversal Momentum Strategy
- Multi-Indicator Intelligent Pyramiding Strategy
- EMA RSI Crossover Strategy
- 4-Hour Timeframe Engulfing Pattern Trading Strategy with Dynamic Take Profit and Stop Loss Optimization
- RSI50_EMA Long Only Strategy
- ATR-RSI Enhanced Trend Following Trading System
- Han Yue - Trend Following Trading Strategy Based on Multiple EMAs, ATR and RSI
- Enhanced Breakout Strategy with Targets and Stop Loss Optimization
- Multi-Indicator Comprehensive Trading Strategy: Perfect Combination of Momentum, Overbought/Oversold, and Volatility
- High-Precision RSI and Bollinger Bands Breakout Strategy with Optimized Risk-Reward Ratio
- Advanced EMA Crossover Strategy: Adaptive Trading System with Dynamic Stop-Loss and Take-Profit Targets
- EMA Crossover with Dual Take Profit and Stop Loss Strategy
- Multi-Timeframe Hull Moving Average Crossover Strategy
- Dynamic Trailing Stop Dual Target Moving Average Crossover Strategy
- Dynamic Adaptive Momentum Breakout Strategy
- Adaptive Moving Average Crossover with Trailing Stop-Loss Strategy
- EMA Trend-Following Automated Trading Strategy
- Darvas Box Breakout and Risk Management Strategy
- SMA Crossover Long-Short Strategy with Peak Drawdown Control and Auto-Termination
- High-Frequency Flip Percentage Tracking Momentum Strategy
- SMI and Pivot Point Momentum Crossover Strategy
- Support and Resistance Strategy with Dynamic Risk Management System
- RSI-Bollinger Bands Integration Strategy: A Dynamic Self-Adaptive Multi-Indicator Trading System
- Multi-Timeframe Trend Following and Order Block Quantitative Trading Strategy
- Technical Support and Resistance Indicator Precision Trading Strategy
- Multi-Moving Average Crossover Trend Following Strategy with Volatility Filter
- MACD Crossover Momentum Strategy with Dynamic Take Profit and Stop Loss Optimization
- Big Red Candle Breakout Buy Strategy