Darvas Box Breakout and Risk Management Strategy
Author: ChaoZhang, Date: 2024-07-29 14:22:29Tags: MACDRSI
Overview
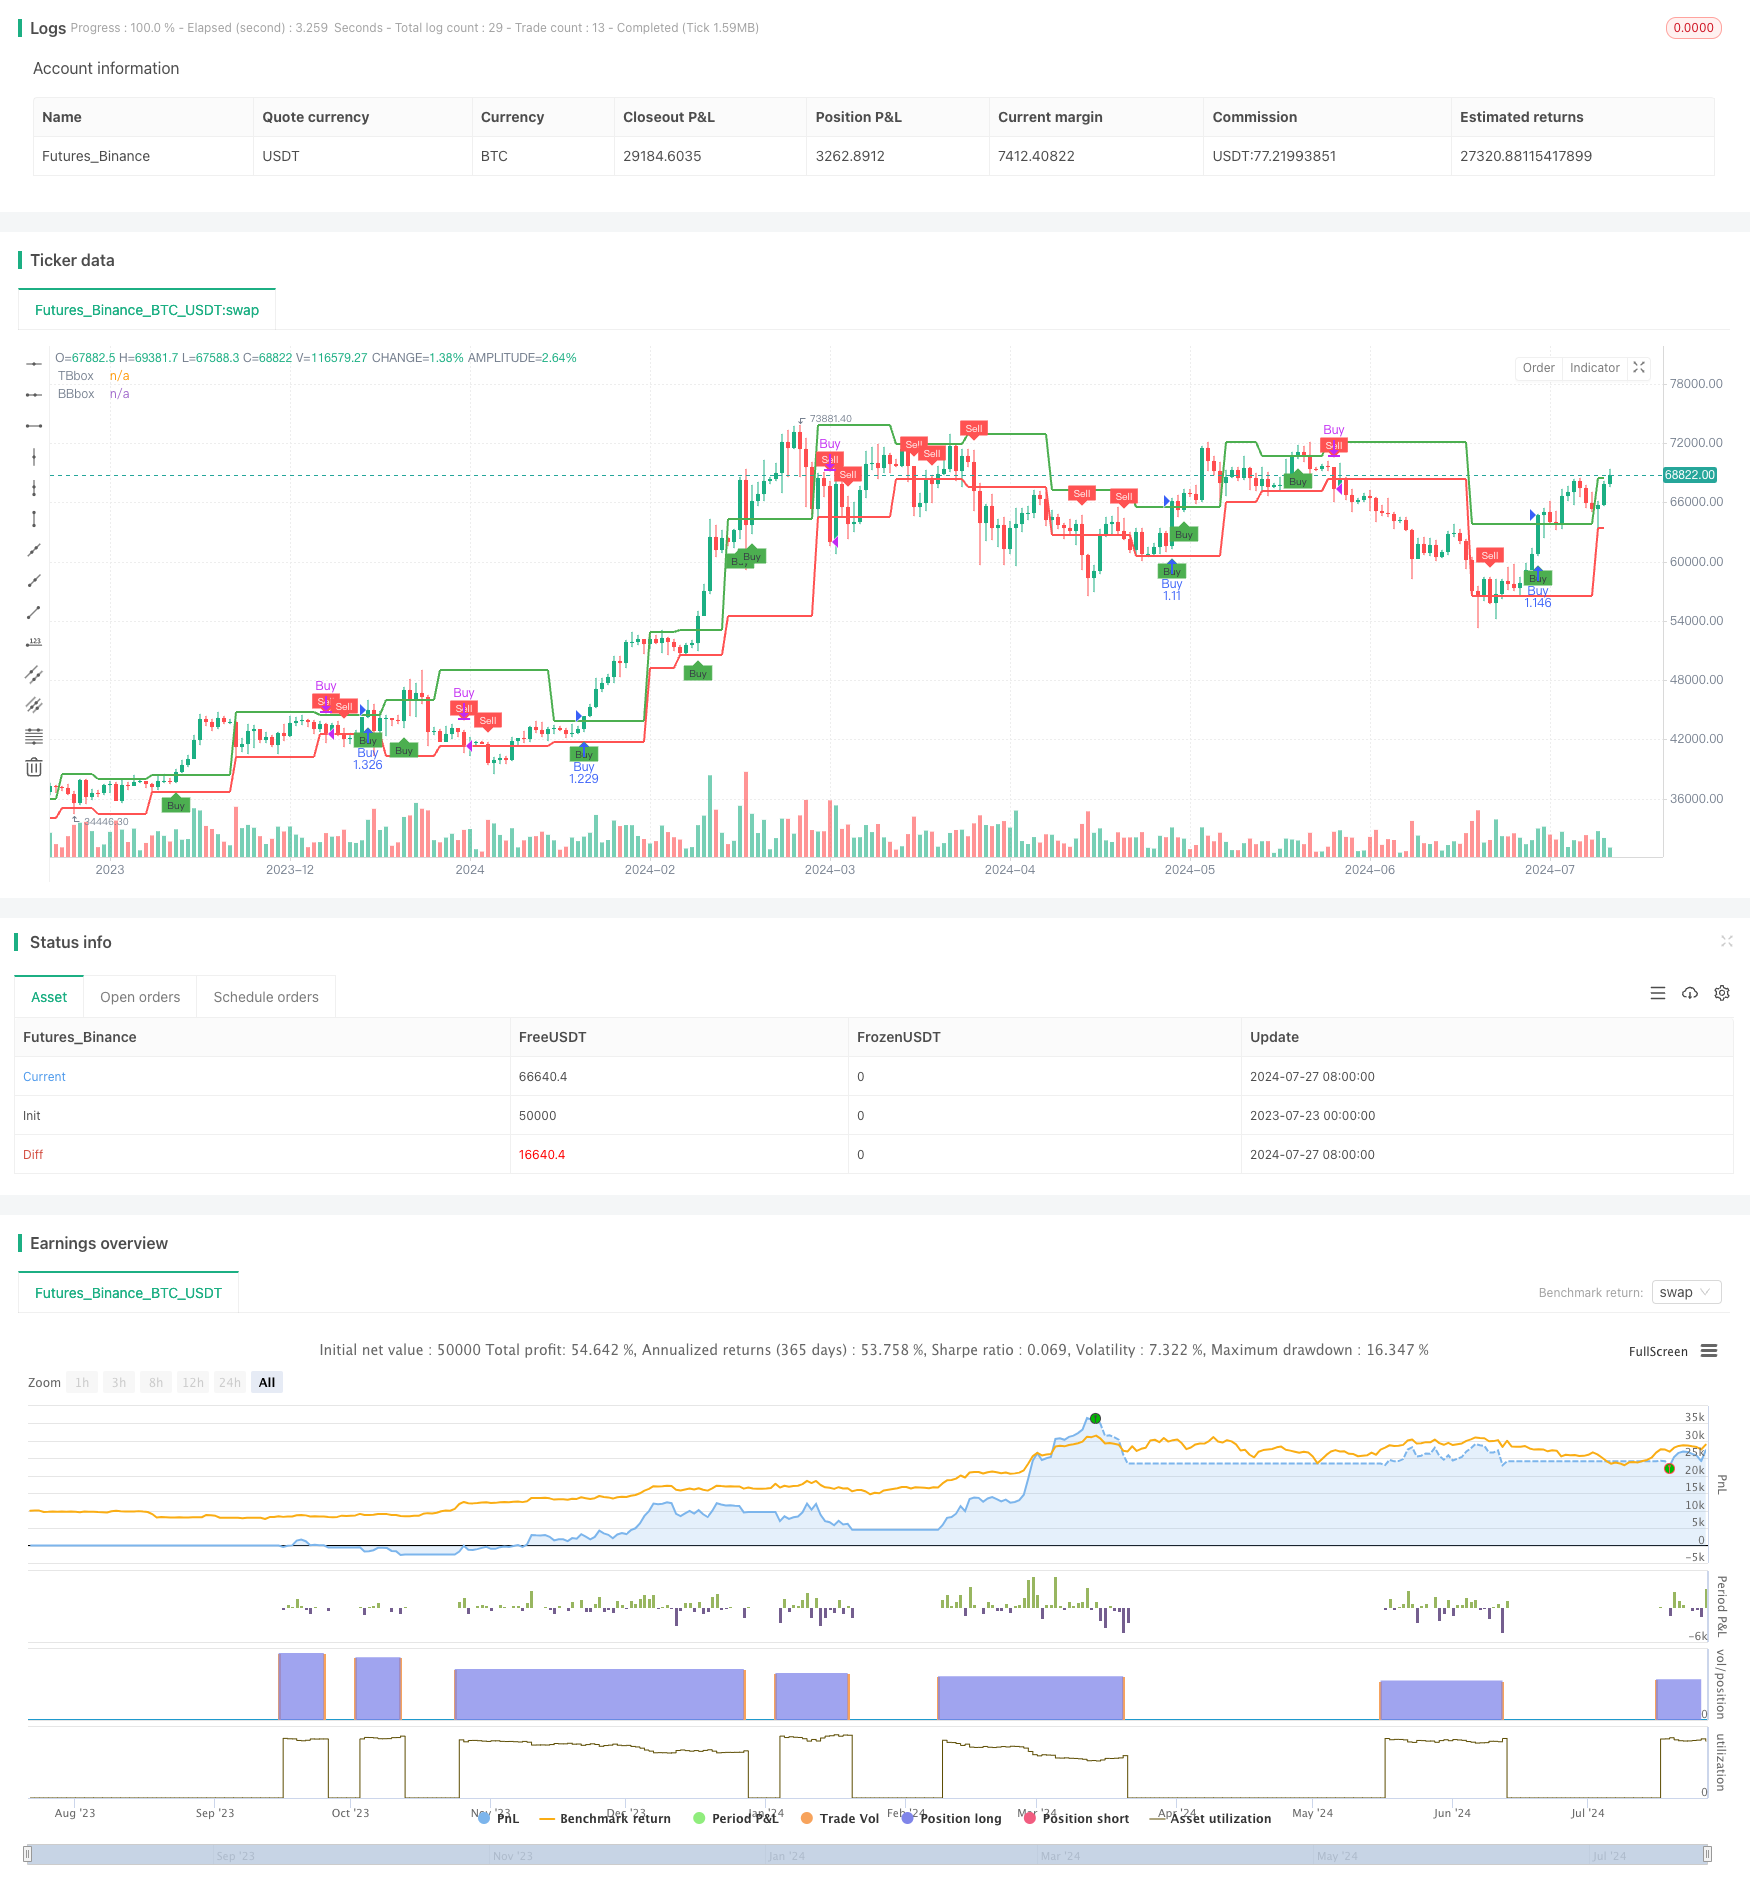
The Darvas Box Breakout and Risk Management Strategy is a quantitative trading approach that combines technical analysis with risk management. Based on Nicholas Darvas’s Darvas Box theory, this strategy aims to capture potential uptrends by identifying price breakouts above historical highs. The strategy also incorporates multiple technical indicators and risk control measures to enhance trading accuracy and safety.
Analyzing the provided code, we can see that the core of this strategy is to construct Darvas boxes, generating buy signals when the price breaks above the box’s upper boundary and sell signals when it falls below the lower boundary. The strategy also utilizes technical indicators such as moving averages, MACD, and RSI to confirm trading signals, and employs risk management techniques like percentage stop-loss and risk-reward ratios to control the risk of each trade.
Strategy Principles
Darvas Box Construction:
- Use the input.int() function to set the box period (boxp), defaulting to 5 periods.
- Calculate the lowest low (LL) and highest highs (k1, k2, k3) within the period.
- Determine new highs (NH) and box formation conditions (box1).
- Define the top (TopBox) and bottom (BottomBox) of the box.
Trading Signal Generation:
- Buy signal (Buy): Triggered when the closing price crosses above the box’s upper boundary.
- Sell signal (Sell): Triggered when the closing price crosses below the box’s lower boundary.
Strategy Execution:
- Use strategy.entry() function to open a long position when a buy signal appears.
- Use strategy.close() function to close the position when a sell signal appears.
Visualization:
- Use plot() function to draw the upper and lower boundaries of the Darvas box.
- Use plotshape() function to mark buy and sell signals on the chart.
Risk Management:
- Set the proportion of funds for each trade using default_qty_type and default_qty_value parameters.
- Control the size of the box, indirectly affecting stop-loss range, by adjusting the boxp parameter.
Strategy Advantages
Trend Following: The Darvas Box strategy effectively captures market uptrends, particularly suitable for generating substantial returns in strong markets.
Objectivity: The strategy is based on clear mathematical models and technical indicators, reducing biases from subjective judgments.
Risk Control: By setting a fixed proportion of funds for trading, it effectively controls the risk exposure of individual trades.
Flexibility: Strategy parameters are adjustable, adapting to different market environments and trading instruments.
Visual Support: By intuitively displaying Darvas boxes and trading signals on the chart, it facilitates traders’ understanding and monitoring of strategy execution.
Automated Trading: The strategy can be easily integrated into automated trading systems, reducing human intervention.
Strategy Risks
False Breakout Risk: In oscillating markets, frequent false breakouts may occur, leading to excessive erroneous signals.
Lag: The formation of Darvas boxes takes time, potentially missing some rapid market opportunities.
Drawdown Risk: In highly volatile markets, prices may quickly retreat after triggering a buy signal, causing significant losses.
Parameter Sensitivity: Strategy performance is relatively sensitive to the boxp parameter setting; improper parameters may lead to poor strategy performance.
Lack of Profit-Taking Mechanism: The current strategy lacks a clear profit-taking mechanism, potentially missing optimal profit realization opportunities.
To mitigate these risks, consider the following measures: - Combine other technical indicators like moving averages or RSI to filter false breakout signals. - Adopt dynamic stop-loss strategies, such as trailing stops, to better protect profits. - Introduce volatility indicators to adjust trading size or pause trading during high volatility periods. - Optimize the boxp parameter through backtesting to find the most suitable setting for the target market. - Add profit-taking conditions, such as automatically closing positions when prices reach certain profit levels.
Strategy Optimization Directions
Signal Confirmation:
- Integrate moving average crossovers or MACD indicators to confirm the validity of breakouts.
- Introduce volume analysis, confirming breakout signals only when accompanied by significant volume increases.
Dynamic Parameter Adjustment:
- Dynamically adjust the boxp parameter based on market volatility, using larger boxp in low volatility periods and smaller boxp in high volatility periods.
- Implement adaptive Darvas box sizes that automatically adjust based on recent price volatility.
Risk Management Optimization:
- Add dynamic stop-loss mechanisms, such as percentage trailing stops or ATR stops.
- Implement position sizing based on risk-reward ratios, increasing positions for high risk-reward ratios and decreasing for low ones.
Multi-Timeframe Analysis:
- Construct Darvas boxes on larger timeframes to determine overall trends.
- Look for entry opportunities on smaller timeframes to improve trading precision.
Machine Learning Integration:
- Use machine learning algorithms to predict the success probability of Darvas box breakouts.
- Optimize strategy parameters through deep learning models to enhance overall strategy performance.
Market Environment Adaptation:
- Introduce market environment recognition mechanisms, adopting different trading strategies for various market states (trending, oscillating, reversing).
- Automatically adjust trading frequency and size during high volatility periods to adapt to market changes.
These optimization directions aim to improve the strategy’s stability and profitability while reducing risks. By introducing more technical analysis tools and risk management techniques, the strategy can better adapt to different market environments, increasing the likelihood of long-term profitability.
Conclusion
The Darvas Box Breakout and Risk Management Strategy is a quantitative trading approach that combines classic technical analysis methods with modern risk control concepts. It utilizes Darvas Box theory to capture price breakouts while implementing strict risk management to control trading risks. The strategy’s strengths lie in its objectivity, trend-following ability, and risk control, but it also faces challenges such as false breakouts and parameter sensitivity.
Through in-depth analysis and optimization, we have proposed several improvement directions, including signal confirmation, dynamic parameter adjustment, risk management optimization, multi-timeframe analysis, machine learning integration, and market environment adaptation. These optimization measures are expected to enhance the strategy’s stability and profitability, enabling it to better adapt to various market environments.
For traders, understanding and correctly implementing this strategy requires deep market knowledge and technical analysis skills. Continuous backtesting and parameter optimization are also key to maintaining the strategy’s effectiveness. As market environments constantly change, the strategy needs to evolve continuously to maintain its competitiveness. Through ongoing learning and improvement, the Darvas Box Breakout and Risk Management Strategy has the potential to become a powerful tool in a trader’s arsenal.
/*backtest
start: 2023-07-23 00:00:00
end: 2024-07-28 00:00:00
period: 1d
basePeriod: 1h
exchanges: [{"eid":"Futures_Binance","currency":"BTC_USDT"}]
*/

//@version=5
strategy("Darvas Box Strategy", overlay=true, default_qty_type=strategy.percent_of_equity, default_qty_value=100)

// Input settings
boxp = input.int(defval=5, title="Length", minval=1, maxval=500)

// Calculate the lowest low and highest highs
LL = ta.lowest(low, boxp)
k1 = ta.highest(high, boxp)
k2 = ta.highest(high, boxp - 1)
k3 = ta.highest(high, boxp - 2)

// Calculate New High (NH)
NH = ta.valuewhen(high > k1[1], high, 0)
box1 = k3 < k2

// Define the top and bottom of the Darvas Box
TopBox = ta.valuewhen(ta.barssince(high > k1[1]) == boxp - 2 and box1, NH, 0)
BottomBox = ta.valuewhen(ta.barssince(high > k1[1]) == boxp - 2 and box1, LL, 0)

// Plot the Darvas Box
plot(TopBox, linewidth=2, color=color.new(color.green, 0), title="TBbox")
plot(BottomBox, linewidth=2, color=color.new(color.red, 0), title="BBbox")

// Buy and Sell signals
Buy = ta.crossover(close, TopBox)
Sell = ta.crossunder(close, BottomBox)

// Set strategy orders
if (Buy)
    strategy.entry("Buy", strategy.long)
if (Sell)
    strategy.close("Buy")

// Alert conditions
alertcondition(Buy, title="Buy Signal", message="Buy")
alertcondition(Sell, title="Sell Signal", message="Sell")

// Plot Buy and Sell signals
plotshape(Buy, style=shape.labelup, location=location.belowbar, color=color.new(color.green, 0), size=size.tiny, title="Buy Signal", text="Buy", textcolor=color.black)
plotshape(Sell, style=shape.labeldown, location=location.abovebar, color=color.new(color.red, 0), size=size.tiny, title="Sell Signal", text="Sell", textcolor=color.white)
- Dynamic Trend Momentum Optimization Strategy with G-Channel Indicator
- Advanced Five-Day Cross-Analysis Strategy Based on RSI and MACD Integration
- RSI-MACD Multi-Signal Trading System with Dynamic Stop Management
- Price Divergence Strategy v1.0
- Multi-Indicator Divergence Trading Strategy with Adaptive Take Profit and Stop Loss
- MACD and RSI Combined Long-term Trading Strategy
- RSI and MACD Combined Long-Short Strategy
- Trend-Following Cloud Momentum Divergence Strategy
- Multi-Indicator Intelligent Pyramiding Strategy
- Low-Risk Stable Cryptocurrency High-Frequency Trading Strategy Based on RSI and MACD
- Multi-Indicator Adaptive Trend Following Strategy
- Multi-Indicator Comprehensive Trading Strategy: Perfect Combination of Momentum, Overbought/Oversold, and Volatility
- High-Precision RSI and Bollinger Bands Breakout Strategy with Optimized Risk-Reward Ratio
- Advanced EMA Crossover Strategy: Adaptive Trading System with Dynamic Stop-Loss and Take-Profit Targets
- EMA Crossover with Dual Take Profit and Stop Loss Strategy
- Multi-Timeframe Hull Moving Average Crossover Strategy
- Dynamic Trailing Stop Dual Target Moving Average Crossover Strategy
- Dynamic Adaptive Momentum Breakout Strategy
- Adaptive Moving Average Crossover with Trailing Stop-Loss Strategy
- EMA Trend-Following Automated Trading Strategy
- Multi-Timeframe Exponential Moving Average Crossover Strategy with Risk-Reward Optimization
- SMA Crossover Long-Short Strategy with Peak Drawdown Control and Auto-Termination
- High-Frequency Flip Percentage Tracking Momentum Strategy
- SMI and Pivot Point Momentum Crossover Strategy
- Support and Resistance Strategy with Dynamic Risk Management System
- RSI-Bollinger Bands Integration Strategy: A Dynamic Self-Adaptive Multi-Indicator Trading System
- Multi-Timeframe Trend Following and Order Block Quantitative Trading Strategy
- Technical Support and Resistance Indicator Precision Trading Strategy
- Multi-Moving Average Crossover Trend Following Strategy with Volatility Filter
- MACD Crossover Momentum Strategy with Dynamic Take Profit and Stop Loss Optimization