Multi-Stochastic Oscillation and Momentum Analysis System
Author: ChaoZhang, Date: 2024-07-30 11:04:02Tags: SMAEMASTOCHHLC3
Overview
The Multi-Stochastic Oscillation and Momentum Analysis System is a quantitative trading strategy based on multiple stochastic indicators and momentum analysis. This strategy utilizes 8 stochastic oscillator lines with different parameter settings to analyze market trends and momentum by examining the relative positions and movements of these indicator lines. The core idea of the strategy is that when all indicator lines are aligned in a specific order, it signals a strong upward or downward trend in the market, triggering corresponding long or short trades.
Strategy Principle
The core principle of this strategy is to use multiple stochastic oscillators to analyze market momentum and trends. The specific implementation is as follows:
- Calculate 8 stochastic oscillator lines (k1 to k8), each using different parameter settings.
- All indicator lines are based on HLC3 (average of High, Low, and Close prices).
- Each indicator line undergoes double smoothing with SMA (Simple Moving Average) and EMA (Exponential Moving Average).
- The strategy determines market trends by comparing the positions of adjacent indicator lines:
- A long signal is triggered when k1 >= k2 >= k3 >= k4 >= k5 >= k6 >= k7 >= k8 >= k8[1].
- A short signal is triggered when k1 < k2 < k3 < k4 < k5 < k6 < k7 < k8 < k8[1].
- The strategy also sets overbought (80) and oversold (20) levels, as well as a mid-level (50) line to assist in judging market conditions.
Strategy Advantages
Multiple Indicator Integration: By using 8 stochastic oscillators with different parameters, the strategy can comprehensively capture market dynamics across multiple timeframes, reducing false signals that might arise from a single indicator.
Momentum Capture: The strategy design effectively captures strong market trends, especially in the early stages, helping to enter trades early.
Visual Decision Support: The strategy displays different indicator lines in different colors, intuitively reflecting market conditions and helping traders quickly judge market trends.
Flexibility: Strategy parameters are adjustable, allowing users to optimize for different market environments and trading instruments.
Risk Management: By setting overbought and oversold levels, the strategy provides additional risk control measures.
Strategy Risks
Overtrading Risk: In oscillating markets, the strategy may generate frequent trading signals, leading to overtrading and increased transaction costs.
Lag: Due to the use of multiple moving averages, the strategy may react slowly in rapidly reversing markets.
False Breakout Risk: During consolidation phases, the strategy may misinterpret small fluctuations as the beginning of trends, resulting in erroneous trades.
Parameter Sensitivity: The strategy’s effectiveness is highly dependent on parameter settings, which may require frequent adjustments in different market environments.
Lack of Stop-Loss Mechanism: The code does not explicitly set stop-loss conditions, which may lead to significant losses in case of misjudgments.
Strategy Optimization Directions
Introduce Adaptive Parameters: Consider using adaptive algorithms to dynamically adjust the parameters of stochastic oscillators to adapt to different market environments.
Add Filtering Conditions: Incorporate other technical indicators (such as ATR, RSI) as auxiliary filtering conditions to reduce false signals.
Improve Risk Management: Add stop-loss and take-profit mechanisms, such as ATR-based dynamic stop-loss, to protect profits and limit potential losses.
Optimize Entry Timing: Consider entering trades when indicator lines cross, rather than waiting for all indicator lines to fully align, to improve entry timeliness.
Incorporate Volume Analysis: Combine volume indicators to verify trend validity and improve the reliability of trading signals.
Implement Time Filtering: Add trading time window restrictions to avoid periods of high volatility or low liquidity.
Implement Partial Position Management: Adjust position sizes based on signal strength, increasing positions when stronger signals appear.
Conclusion
The Multi-Stochastic Oscillation and Momentum Analysis System is an innovative quantitative trading method that effectively captures market momentum and trends by integrating multiple stochastic oscillators. This strategy performs excellently in markets with clear trends, capable of early identification and following major trends. However, the strategy also has some potential risks, such as overtrading and parameter sensitivity. By introducing adaptive parameters, adding filtering conditions, improving risk management, and other optimization measures, the stability and profitability of the strategy can be further enhanced. For investors pursuing trend-following and momentum trading, this is a strategy framework worth in-depth study and practice.
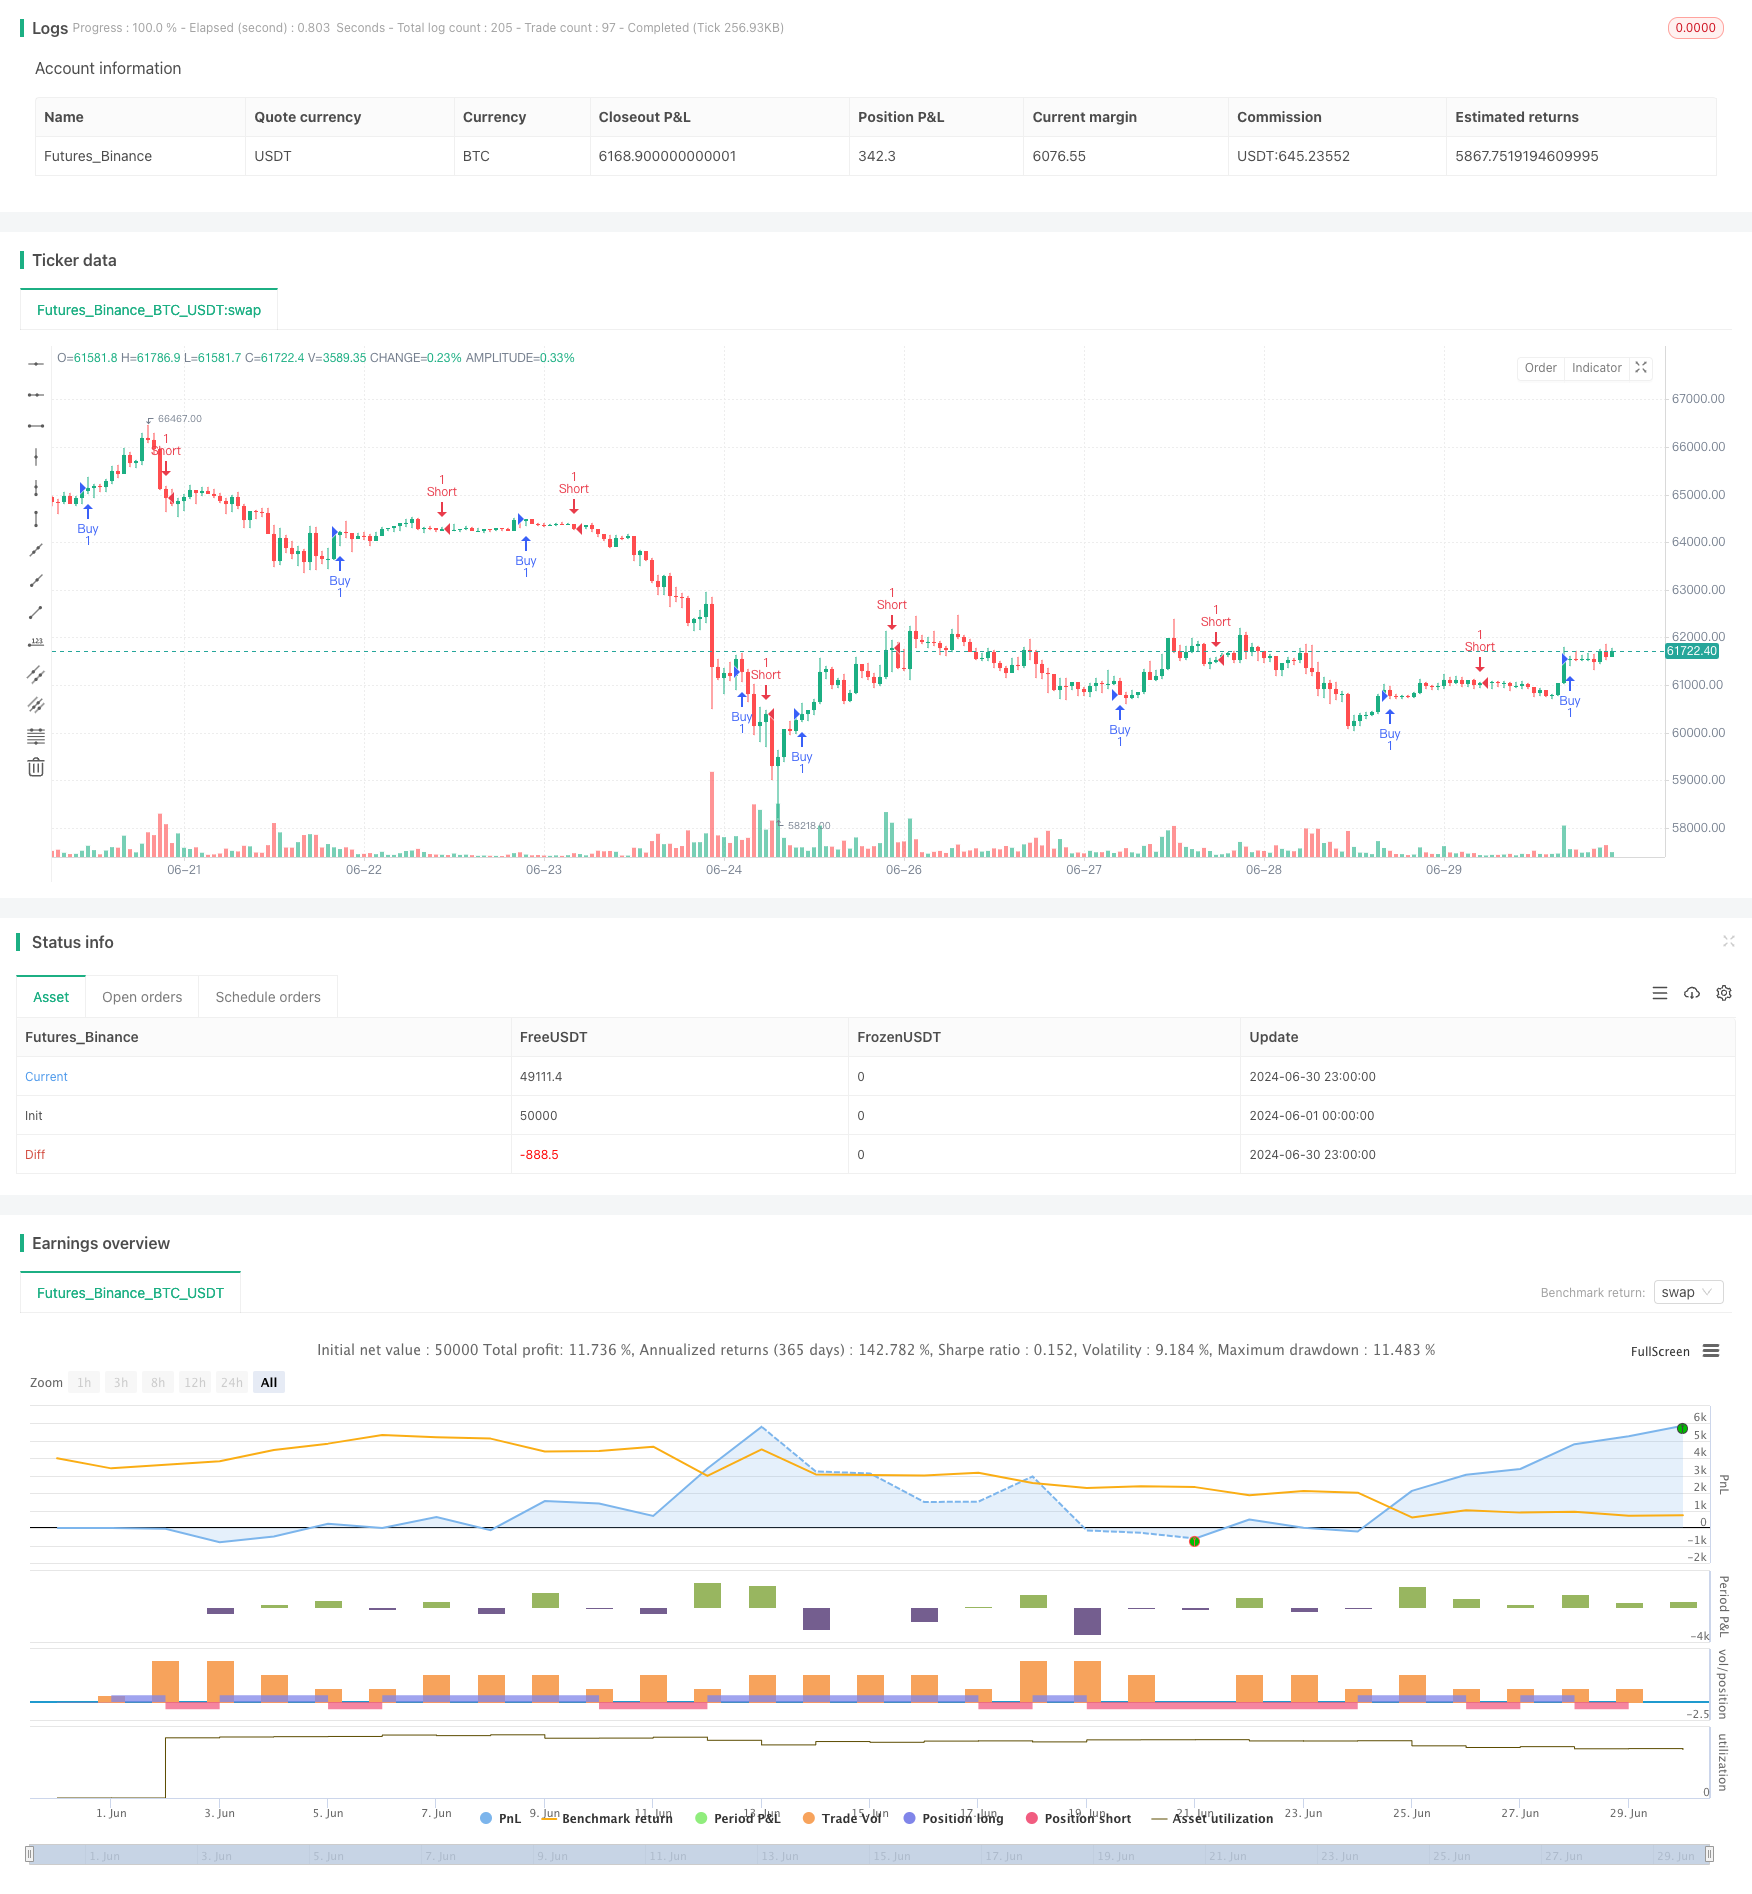
/*backtest
start: 2024-06-01 00:00:00
end: 2024-06-30 23:59:59
period: 1h
basePeriod: 15m
exchanges: [{"eid":"Futures_Binance","currency":"BTC_USDT"}]
*/

//@version=5
strategy("Stochaholic Strategy", shorttitle="Stochaholic Strat", overlay=true)

// Indicator parameters
length = input.int(14, "Length")

// Source
src = hlc3

// Calculations for the Stochaholic indicator
k1 = ta.ema(ta.sma(ta.stoch(src, high, low, length), 3), 3)
k2 = ta.ema(ta.sma(ta.stoch(src, high, low, length), 4), 3)
k3 = ta.ema(ta.sma(ta.stoch(src, high, low, length), 5), 3)
k4 = ta.ema(ta.sma(ta.stoch(src, high, low, length), 6), 3)
k5 = ta.ema(ta.sma(ta.stoch(src, high, low, length), 7), 3)
k6 = ta.ema(ta.sma(ta.stoch(src, high, low, length), 8), 3)
k7 = ta.ema(ta.sma(ta.stoch(src, high, low, length), 9), 3)
k8 = ta.ema(ta.sma(ta.stoch(src, high, low, length), 10), 3)

// Plotting the Stochaholic lines
// plot(k1, linewidth=2, color=k1 >= k2 ? color.lime : color.red)
// plot(k2, linewidth=2, color=k2 >= k3 ? color.lime : color.red)
// plot(k3, linewidth=2, color=k3 >= k4 ? color.lime : color.red)
// plot(k4, linewidth=2, color=k4 >= k5 ? color.lime : color.red)
// plot(k5, linewidth=2, color=k5 >= k6 ? color.lime : color.red)
// plot(k6, linewidth=2, color=k6 >= k7 ? color.lime : color.red)
// plot(k7, linewidth=2, color=k7 >= k8 ? color.lime : color.red)
// plot(k8, linewidth=2, color=k8 >= k8[1] ? color.lime : color.red)

// Overbought and Oversold Levels
// hline(80, color=color.red, title="OB Level")
// hline(50, linewidth=1, title="Mid Level")
// hline(20, color=color.green, title="OS Level")

// Strategy logic
longCondition = (k1 >= k2 and k2 >= k3 and k3 >= k4 and k4 >= k5 and k5 >= k6 and k6 >= k7 and k7 >= k8 and k8 >= k8[1])
shortCondition = (k1 < k2 and k2 < k3 and k3 < k4 and k4 < k5 and k5 < k6 and k6 < k7 and k7 < k8 and k8 < k8[1])

if (longCondition)
    strategy.entry("Buy", strategy.long)
if (shortCondition)
    strategy.entry("Short", strategy.short)
- Advanced WaveTrend and EMA Ribbon Fusion Trading Strategy
- Adaptive Trend Flow Multiple Filter Trading Strategy
- Multi-EMA Trend Momentum Trading Strategy with Risk Management System
- Dynamic WaveTrend and Fibonacci Integrated Quantitative Trading Strategy
- EMA/SMA Multi-Indicator Comprehensive Trend Following Strategy
- Multi-Parameter Stochastic Intelligent Trend Trading Strategy
- Multi-EMA Cross with Volume-Price Momentum Trading Strategy
- RSI and Stochastic Fusion Cross Strategy
- Super Moving Average and Upperband Crossover Strategy
- EMA Crossover Momentum Scalping Strategy
- Dual Indicator Cross-Confirmation Momentum Volume Quantitative Trading Strategy
- Dynamic Trend Following Strategy - Multi-Indicator Integrated Momentum Analysis System
- Multi-EMA and Supertrend Crossover Strategy
- Dynamic Mean Reversion and Momentum Strategy
- Dual EMA Dynamic Trend Capture Trading System
- Multi-Confirmation Reversal Buy Strategy
- Enhanced Dual EMA Pullback Breakout Trading Strategy
- Multi-Timeframe Exponential Moving Average Crossover Strategy
- Multi-Period Dynamic Channel Crossover Strategy
- Comprehensive Price Gap Short-Term Trend Capture Strategy
- Multi-Timeframe Moving Average and RSI Trend Trading Strategy
- Multi-Period Moving Average Crossover Trend Following Strategy
- Three-Week High-Low Momentum Trading Strategy
- Adaptive Moving Average Crossover Strategy
- Technical Indicator Strategy, Risk Management Strategy, Adaptive Trend Following Strategy
- Bollinger Bands Momentum Optimization Strategy
- Multi-Level Dynamic Trend Following System
- Advanced Mean Reversion Trading Strategy: Dynamic Range Breakout System Based on Standard Deviation
- EMA Crossover with Bollinger Bands Double Entry Strategy: A Quantitative Trading System Combining Trend Following and Volatility Breakout
- Adaptive Trend-Following Trading Strategy: 200 EMA Breakout with Dynamic Risk Management System