概述
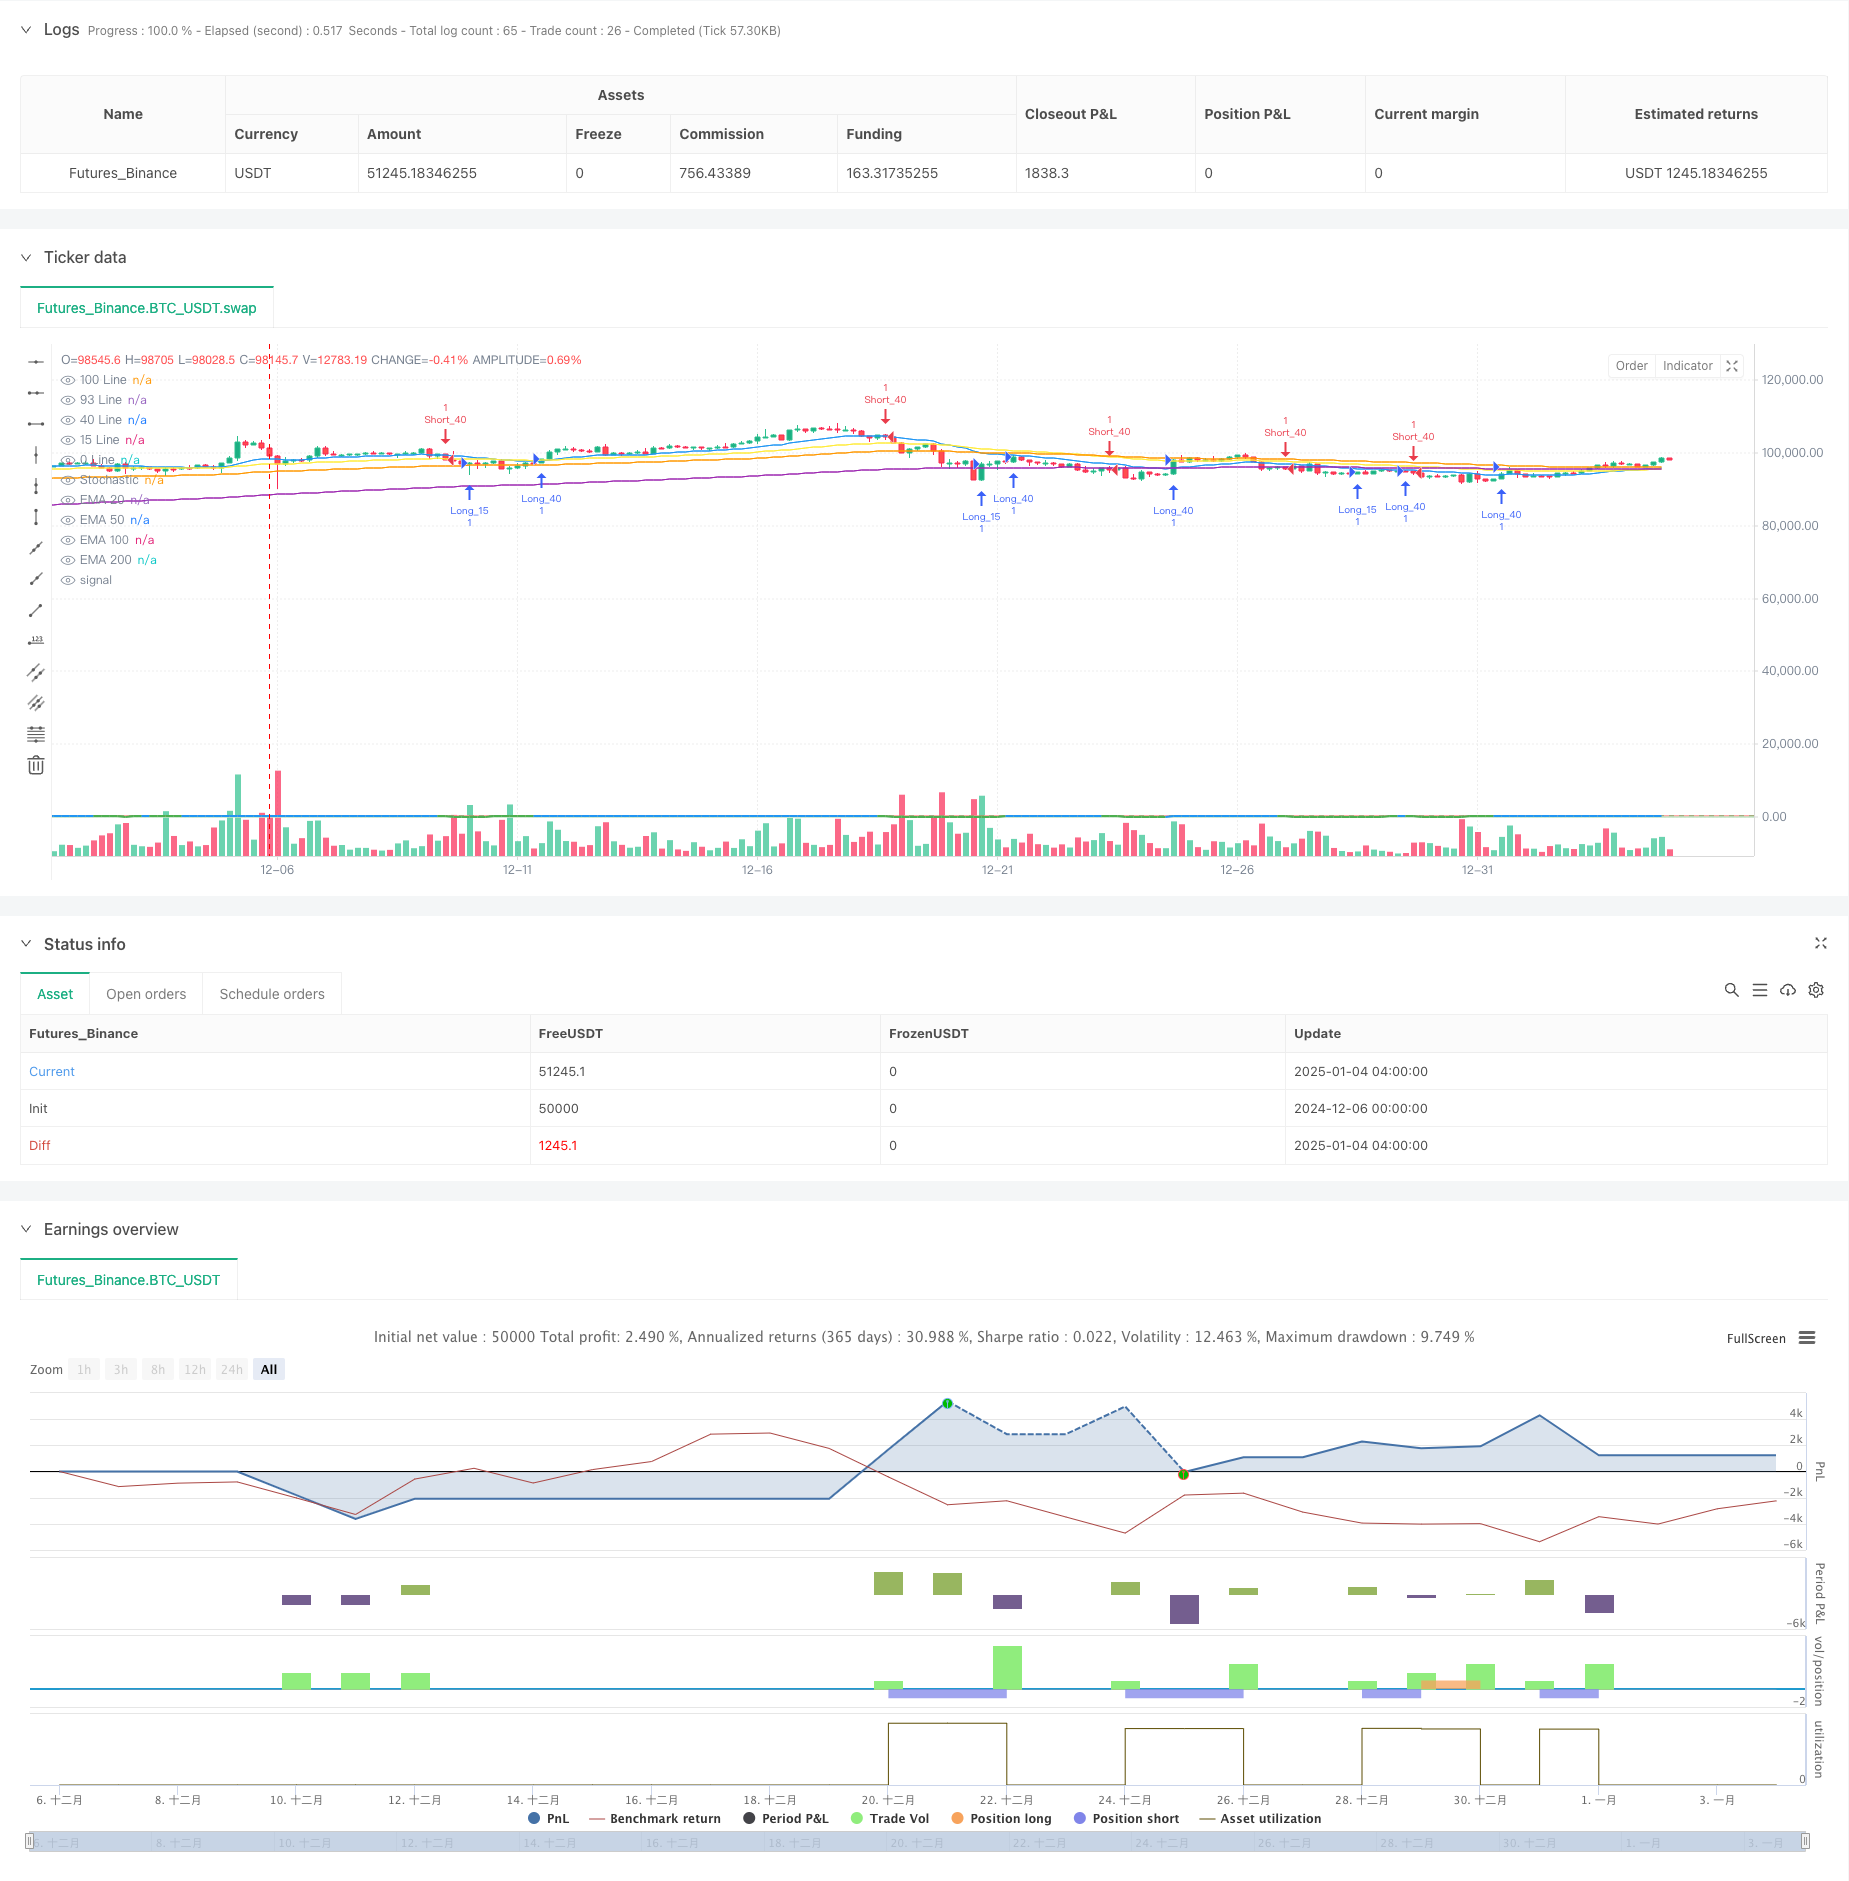
本策略是一个基于随机震荡指标(Stochastic Oscillator)的智能交易系统。它结合了动态趋势识别、多重信号确认和智能风险管理功能,能够自动识别市场超买超卖状态并进行交易。该策略通过颜色编码系统直观显示市场状态,同时整合了多周期均线(EMA)进行趋势确认,并提供灵活的止损止盈设置。
策略原理
策略核心基于随机震荡指标与多重均线系统的配合。当K值突破预设的超买超卖水平(93⁄15)或中间水平(40)时产生交易信号。系统通过颜色变化(红色表示可能下跌、绿色表示可能上涨、蓝色表示中性)直观显示市场状态。同时结合20、50、100和200周期指数移动平均线(EMA)进行趋势确认。策略还包含智能风险管理系统,支持1:1、1:4、1:8等不同风险收益比设置。
策略优势
- 信号系统清晰直观,通过颜色编码快速识别市场状态
- 多重信号确认机制,降低虚假信号风险
- 灵活的风险管理系统,支持自定义风险收益比
- 结合多周期均线提供趋势确认
- 自动化的止损止盈设置,降低人为操作风险
- 代码结构清晰,易于维护和优化
策略风险
- 在震荡市场可能产生频繁交易信号
- 固定的超买超卖阈值可能不适用于所有市场环境
- 均线系统在剧烈波动市场可能滞后
- 需要合理设置止损以控制风险 解决方案包括:增加信号过滤机制、动态调整阈值、优化均线参数、严格执行止损策略
策略优化方向
- 引入自适应阈值系统,根据市场波动动态调整超买超卖水平
- 增加成交量指标确认信号
- 开发智能信号过滤机制,减少虚假信号
- 优化均线参数,提高趋势判断准确性
- 引入机器学习算法优化参数选择
- 增加回撤控制机制
总结
该策略通过结合随机震荡指标、均线系统和智能风险管理,构建了一个全面的交易系统。策略设计注重实用性和可操作性,适合不同风险偏好的交易者使用。通过持续优化和改进,该策略有望在不同市场环境下保持稳定表现。
策略源码
/*backtest
start: 2024-12-06 00:00:00
end: 2025-01-04 08:00:00
period: 4h
basePeriod: 4h
exchanges: [{"eid":"Futures_Binance","currency":"BTC_USDT"}]
*/

// This Pine Script™ code is subject to the terms of the Mozilla Public License 2.0 at https://mozilla.org/MPL/2.0/
// © petrusvorenusperegrinus

//██████╗ ███████╗████████╗██████╗ ██╗   ██╗███████╗
//██╔══██╗██╔════╝╚══██╔══╝██╔══██╗██║   ██║██╔════╝
//██████╔╝█████╗     ██║   ██████╔╝██║   ██║███████╗
//██╔═══╝ ██╔══╝     ██║   ██╔══██╗██║   ██║╚════██║
//██║     ███████╗   ██║   ██║  ██║╚██████╔╝███████║
//╚═╝     ╚══════╝   ╚═╝   ╚═╝  ╚═╝ ╚═════╝ ╚══════╝

//██╗   ██╗ ██████╗ ██████╗ ███████╗███╗   ██╗██╗   ██╗███████╗
//██║   ██║██╔═══██╗██╔══██╗██╔════╝████╗  ██║██║   ██║██╔════╝
//██║   ██║██║   ██║██████╔╝█████╗  ██╔██╗ ██║██║   ██║███████╗
//╚██╗ ██╔╝██║   ██║██╔══██╗██╔══╝  ██║╚██╗██║██║   ██║╚════██║
// ╚████╔╝ ╚██████╔╝██║  ██║███████╗██║ ╚████║╚██████╔╝███████║
//  ╚═══╝   ╚═════╝ ╚═╝  ╚═╝╚══════╝╚═╝  ╚═══╝ ╚═════╝ ╚══════╝

//██████╗ ███████╗██████╗ ███████╗ ██████╗ ██████╗ ██╗███╗   ██╗██╗   ██╗███████╗
//██╔══██╗██╔════╝██╔══██╗██╔════╝██╔════╝ ██╔══██╗██║████╗  ██║██║   ██║██╔════╝
//██████╔╝█████╗  ██████╔╝█████╗  ██║  ███╗██████╔╝██║██╔██╗ ██║██║   ██║███████╗
//██╔═══╝ ██╔══╝  ██╔══██╗██╔══╝  ██║   ██║██╔══██╗██║██║╚██╗██║██║   ██║╚════██║
//██║     ███████╗██║  ██║███████╗╚██████╔╝██║  ██║██║██║ ╚████║╚██████╔╝███████║
//╚═╝     ╚══════╝╚═╝  ╚═╝╚══════╝ ╚═════╝ ╚═╝  ╚═╝╚═╝╚═╝  ╚═══╝ ╚═════╝ ╚══════╝

//@version=6
strategy("CM Stochastic POP Method 3", shorttitle="CM_Stochastic POP_M3", overlay=true)

// Stochastic Settings
length = input.int(14, "Stochastic Length", minval=1)
smoothK = input.int(5, "Smooth K", minval=1)

// Risk:Reward Settings
use_rr = input.bool(true, "Use Risk:Reward Ratio")
use_sl = input.bool(true, "Use Stop Loss")  // New input for Stop Loss toggle
rr_options = input.string("1:1", "Risk:Reward Ratio", options=["1:1", "1:4", "1:8"])
stop_percent = input.float(1.0, "Stop Loss (%)", minval=0.1, step=0.1)

// Convert selected R:R ratio to number
get_rr_multiplier(rr) =>
    switch rr
        "1:1" => 1.0
        "1:4" => 4.0
        "1:8" => 8.0
        => 1.0  // default case
rr_ratio = get_rr_multiplier(rr_options)

// Fixed Level Settings
upperLine = 93.0  // Fixed sell level
midLine = 40.0    // Buy/Sell level
lowerLine = 15.0  // Fixed buy level

// EMA Settings
ema20 = ta.ema(close, 20)
ema50 = ta.ema(close, 50)
ema100 = ta.ema(close, 100)
ema200 = ta.ema(close, 200)

// Calculate Stochastic with smoothing
k = ta.sma(ta.stoch(close, high, low, length), smoothK)

// Dynamic color based on K value
kColor = k >= upperLine ? color.red :    // Above 93 -> Red
         k <= lowerLine ? color.green :   // Below 15 -> Green
         k <= midLine ? color.green :     // Below 40 -> Green
         color.blue                       // Between 40-93 -> Blue

// Buy Signals:
longCondition1 = ta.crossover(k, lowerLine)   // Cross above 15
longCondition2 = ta.crossover(k, midLine)     // Cross above 40

// Sell Signals:
shortCondition1 = ta.crossunder(k, upperLine) // Cross below 93
shortCondition2 = ta.crossunder(k, midLine)   // Cross below 40

calc_tp_sl(entry_price, is_long) =>
    sl_distance = entry_price * (stop_percent / 100)
    sl = is_long ? entry_price - sl_distance : entry_price + sl_distance
    tp_distance = sl_distance * rr_ratio
    tp = is_long ? entry_price + tp_distance : entry_price - tp_distance
    [sl, tp]

// Long entries
if (longCondition1)
    if (use_rr)
        [sl, tp] = calc_tp_sl(close, true)
        strategy.entry("Long_15", strategy.long)
        if (use_sl)
            strategy.exit("Exit_15", "Long_15", stop=sl, limit=tp)
        else
            strategy.exit("Exit_15", "Long_15", limit=tp)
    else
        strategy.entry("Long_15", strategy.long)

if (longCondition2)
    if (use_rr)
        [sl, tp] = calc_tp_sl(close, true)
        strategy.entry("Long_40", strategy.long)
        if (use_sl)
            strategy.exit("Exit_40", "Long_40", stop=sl, limit=tp)
        else
            strategy.exit("Exit_40", "Long_40", limit=tp)
    else
        strategy.entry("Long_40", strategy.long)

// Short entries
if (shortCondition1)
    if (use_rr)
        [sl, tp] = calc_tp_sl(close, false)
        strategy.entry("Short_93", strategy.short)
        if (use_sl)
            strategy.exit("Exit_93", "Short_93", stop=sl, limit=tp)
        else
            strategy.exit("Exit_93", "Short_93", limit=tp)
    else
        strategy.entry("Short_93", strategy.short)

if (shortCondition2)
    if (use_rr)
        [sl, tp] = calc_tp_sl(close, false)
        strategy.entry("Short_40", strategy.short)
        if (use_sl)
            strategy.exit("Exit_40", "Short_40", stop=sl, limit=tp)
        else
            strategy.exit("Exit_40", "Short_40", limit=tp)
    else
        strategy.entry("Short_40", strategy.short)

// Plot EMAs
plot(ema20, title="EMA 20", color=color.blue, linewidth=1, force_overlay = true)
plot(ema50, title="EMA 50", color=color.yellow, linewidth=1, force_overlay = true)
plot(ema100, title="EMA 100", color=color.orange, linewidth=1, force_overlay = true)
plot(ema200, title="EMA 200", color=color.purple, linewidth=1, force_overlay = true)

// Plot Stochastic line
plot(k, title="Stochastic", color=kColor, linewidth=2)

// Plot reference lines
hline(100, title="100 Line", color=color.white, linestyle=hline.style_solid)
hline(upperLine, title="93 Line", color=color.red, linestyle=hline.style_solid)
hline(midLine, title="40 Line", color=color.green, linestyle=hline.style_dashed)
hline(lowerLine, title="15 Line", color=color.green, linestyle=hline.style_solid)
hline(0, title="0 Line", color=color.white, linestyle=hline.style_solid)
相关推荐