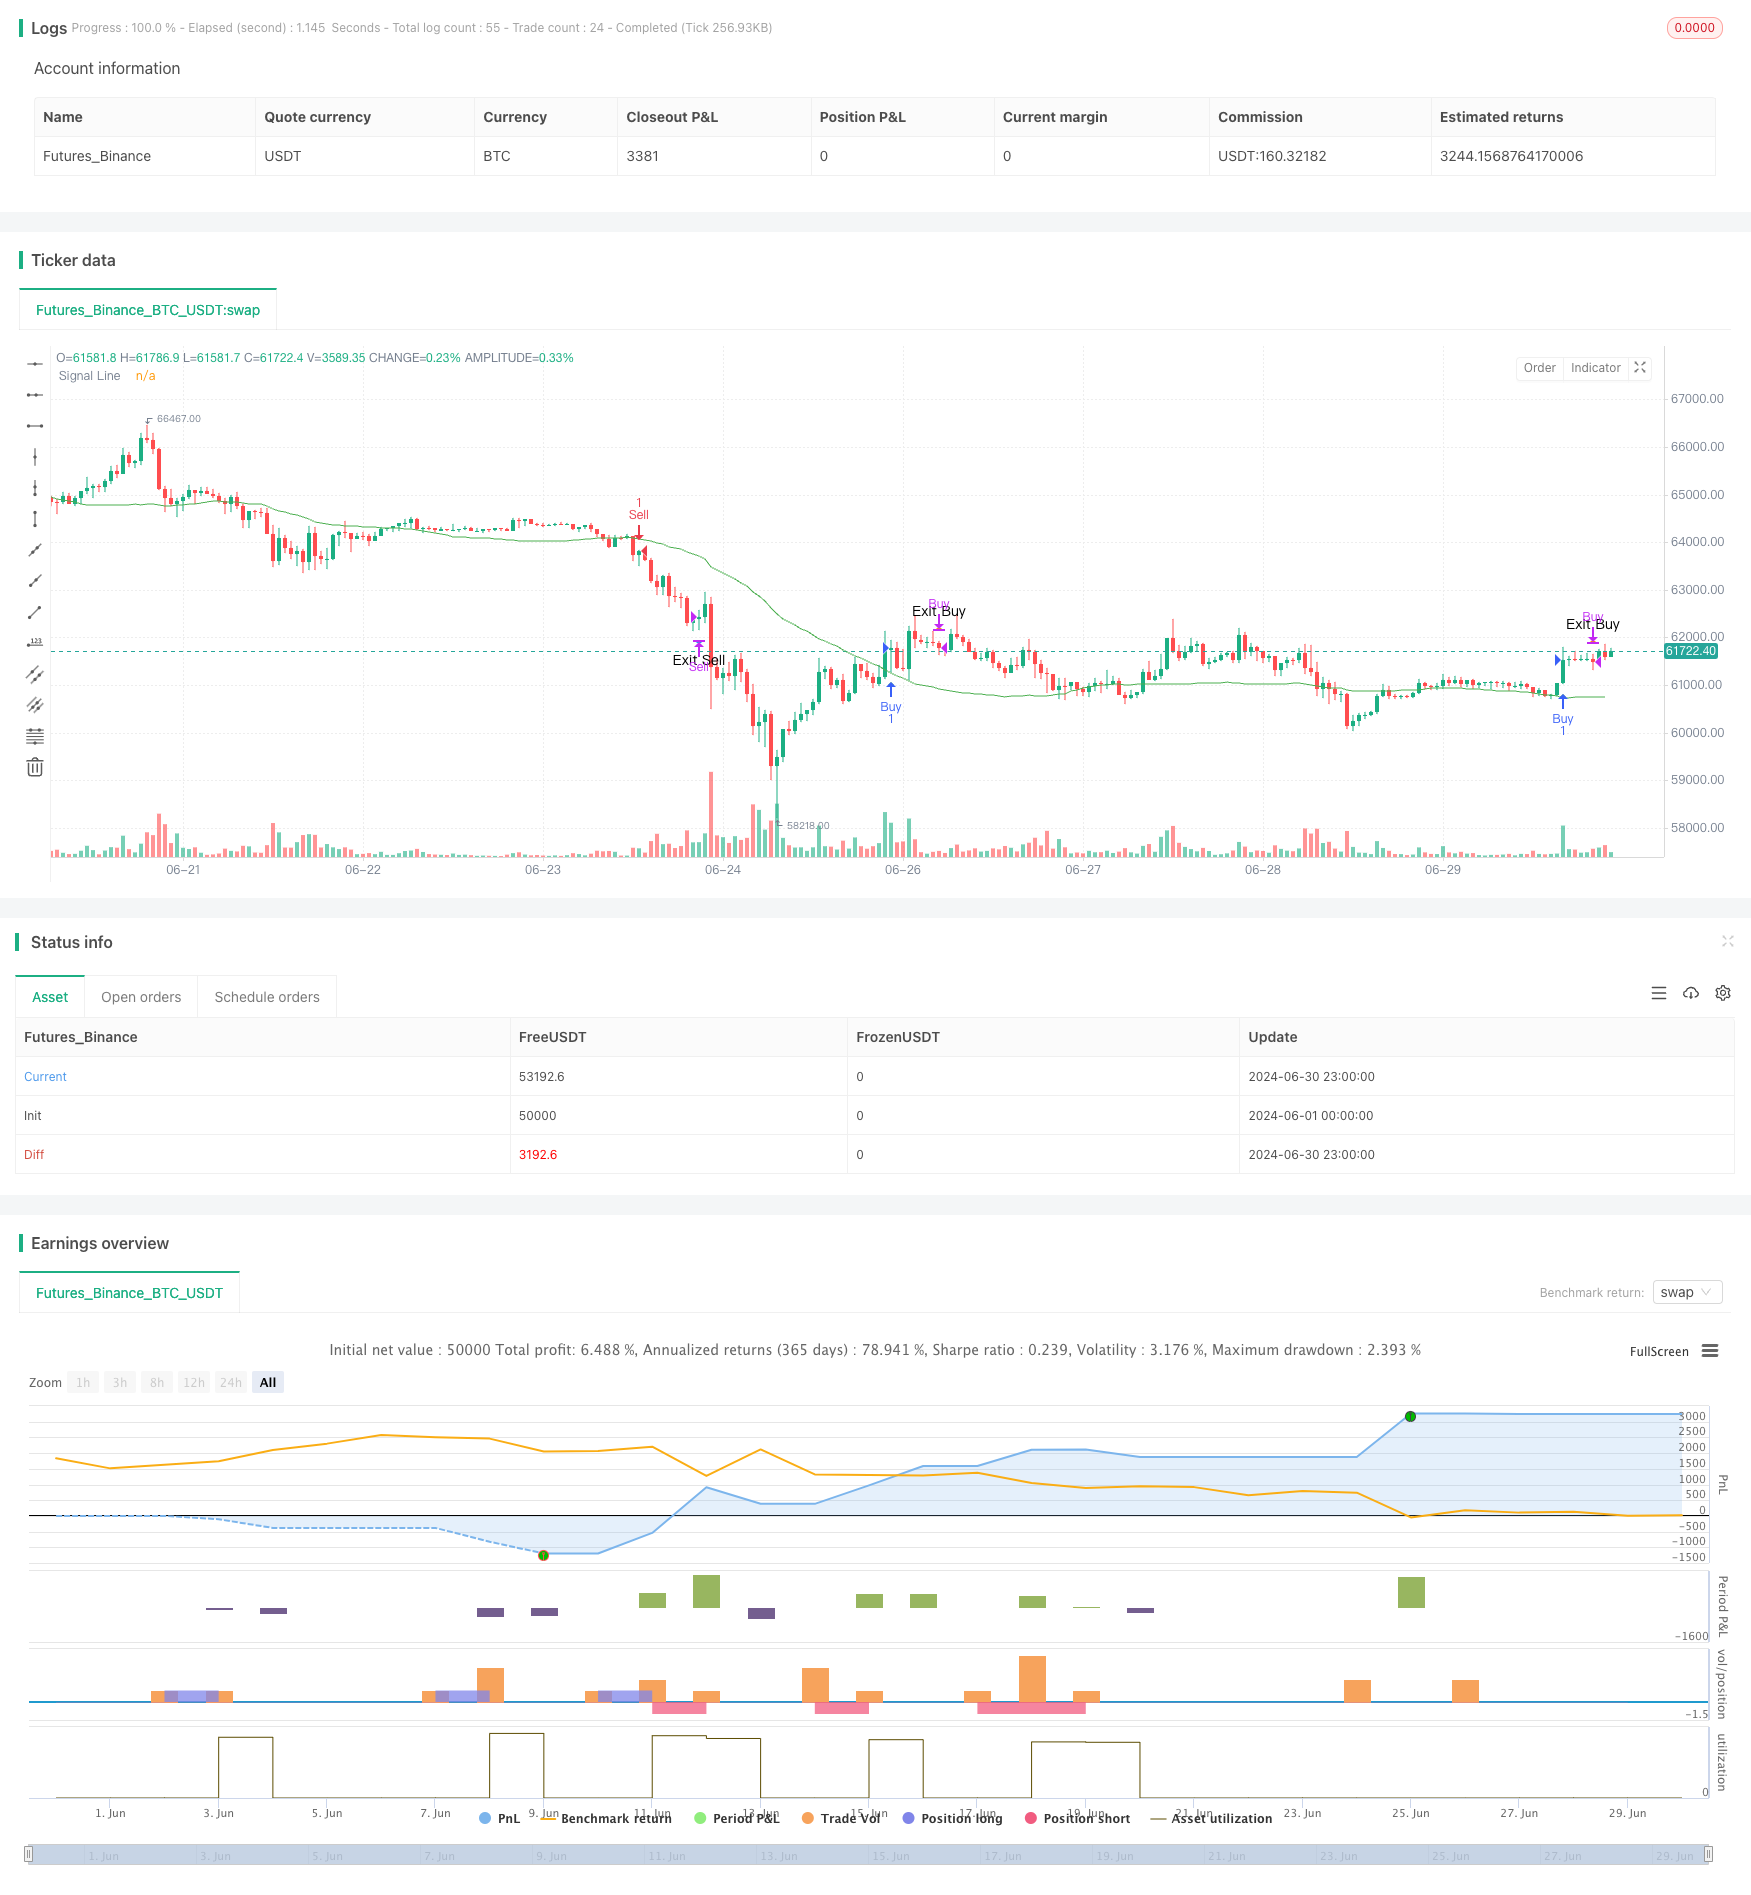
Overview
This strategy is a dynamic signal line trend following system that combines Simple Moving Average (SMA), Average True Range (ATR), and trading volume. It utilizes ATR to adjust the position of the signal line and uses volume as a confirmation indicator. The strategy aims to capture market trends while considering market volatility and trading activity, suitable for intraday trading timeframes.
Strategy Principle
Signal Line Calculation:
- Uses a 50-period SMA as the baseline.
- Subtracts the 20-period ATR value multiplied by a user-defined offset from the SMA to form a dynamic signal line.
Entry Conditions:
- Buy: When the price’s low point breaks above the signal line, and the current volume is greater than 1.5 times the 50-period average volume.
- Sell: When the price’s high point falls below the signal line, and the current volume is greater than 1.5 times the 50-period average volume.
Exit Conditions:
- Long position close: When the closing price is lower than the previous candle’s lowest price.
- Short position close: When the closing price is higher than the previous candle’s highest price.
Visualization:
- Plots the signal line on the chart.
- Uses triangle markers to indicate buy, sell, and exit signals.
Strategy Advantages
Dynamic Adaptability: By combining SMA and ATR, the signal line can dynamically adjust to market volatility, improving the strategy’s adaptability.
Volume Confirmation: Using volume as an additional filter condition helps reduce false signals and increases trade reliability.
Trend Following: The strategy design follows trend-following principles, beneficial for capturing major trend movements.
Risk Management: Setting clear exit conditions helps control risk and prevent excessive losses.
Flexibility: Strategy parameters are adjustable, allowing traders to optimize for different market conditions.
Visualization-Friendly: Clearly displays trading signals through chart markers, facilitating analysis and backtesting.
Strategy Risks
Choppy Market Risk: In sideways or choppy markets, frequent false breakout signals may occur, leading to overtrading and commission losses.
Slippage Risk: Especially in intraday trading, high-frequency trading may face serious slippage issues, affecting actual execution effectiveness.
Over-reliance on Volume: Under certain market conditions, volume may not be a reliable indicator, potentially leading to missed important trading opportunities.
Parameter Sensitivity: Strategy effectiveness highly depends on parameter settings, which may require frequent adjustments for different markets and timeframes.
Trend Reversal Risk: The strategy may react slowly at the beginning of trend reversals, leading to some drawdowns.
Strategy Optimization Directions
Multi-Timeframe Analysis: Introduce trend judgments from longer time periods to improve overall trend assessment accuracy.
Dynamic Parameter Adjustment: Develop adaptive mechanisms to automatically adjust SMA length, ATR period, and volume multiplier based on market conditions.
Add Market State Filters: Introduce volatility or trend strength indicators to adopt different trading strategies under various market states.
Improve Exit Mechanism: Consider using trailing stops or ATR-based dynamic stops to better manage risk and lock in profits.
Integrate Fundamental Data: For longer timeframes, consider introducing fundamental indicators as additional filter conditions.
Optimize Volume Indicators: Explore more complex volume analysis methods, such as relative volume or volume distribution analysis.
Incorporate Machine Learning Models: Use machine learning algorithms to optimize parameter selection and signal generation processes.
Summary
The Dynamic Signal Line Trend Following Strategy Combining ATR and Volume is a flexible and comprehensive trading system suitable for intraday traders. It provides a method to balance risk and reward by combining technical indicators and volume analysis. The core advantage of this strategy lies in its ability to dynamically adapt to market conditions and use volume as a confirmation indicator to enhance signal reliability.
However, the strategy also faces some challenges, such as performance in choppy markets and the complexity of parameter optimization. To further improve the strategy’s robustness and performance, considerations can be given to introducing multi-timeframe analysis, dynamic parameter adjustment, and more sophisticated risk management techniques.
Overall, this strategy provides traders with a solid foundation that can be further customized and optimized according to individual trading styles and market characteristics. Through continuous backtesting and live trading validation, traders can gradually refine the strategy and improve its performance under various market conditions.
/*backtest
start: 2024-06-01 00:00:00
end: 2024-06-30 23:59:59
period: 1h
basePeriod: 15m
exchanges: [{"eid":"Futures_Binance","currency":"BTC_USDT"}]
*/

//@version=5
strategy("Buy and Sell Strategy with ATR and Volume", overlay=true)

// Input Parameters
length = input.int(50, title="SMA Length")
atr_length = input.int(20, title="ATR Length")
signal_line_offset = input.int(1, title="Signal Line ATR Offset", minval=0)
volume_multiplier = input.float(1.5, title="Volume Multiplier")

// Calculations
sma_close = ta.sma(close, length)
atr_val = ta.atr(atr_length)
signal_line = sma_close - atr_val * signal_line_offset
avg_volume = ta.sma(volume, length)

// Conditions
buy_condition = ta.crossover(low, signal_line) and volume > avg_volume * volume_multiplier
sell_condition = ta.crossunder(high, signal_line) and volume > avg_volume * volume_multiplier

// Strategy Execution
if (buy_condition)
    strategy.entry("Buy", strategy.long)
if (sell_condition)
    strategy.entry("Sell", strategy.short)

// Exit Conditions
exit_buy_condition = strategy.position_size > 0 and close < low[1]
exit_sell_condition = strategy.position_size < 0 and close > high[1]

if (exit_buy_condition)
    strategy.close("Buy")
if (exit_sell_condition)
    strategy.close("Sell")

// Plot Signals
plot(signal_line, color=color.green, title="Signal Line")
plotshape(series=buy_condition ? low : na, style=shape.triangleup, color=color.green, size=size.small, location=location.belowbar, title="Buy Signal")
plotshape(series=sell_condition ? high : na, style=shape.triangledown, color=color.red, size=size.small, location=location.abovebar, title="Sell Signal")
plotshape(series=exit_buy_condition ? close : na, style=shape.triangledown, color=color.orange, size=size.small, location=location.abovebar, title="Exit Buy Signal", text="Exit Buy")
plotshape(series=exit_sell_condition ? close : na, style=shape.triangleup, color=color.blue, size=size.small, location=location.belowbar, title="Exit Sell Signal", text="Exit Sell")