Bollinger Bands Breakout Quantitative Trading Strategy
Author: ChaoZhang, Date: 2024-07-30 16:55:32Tags: BBSMASD
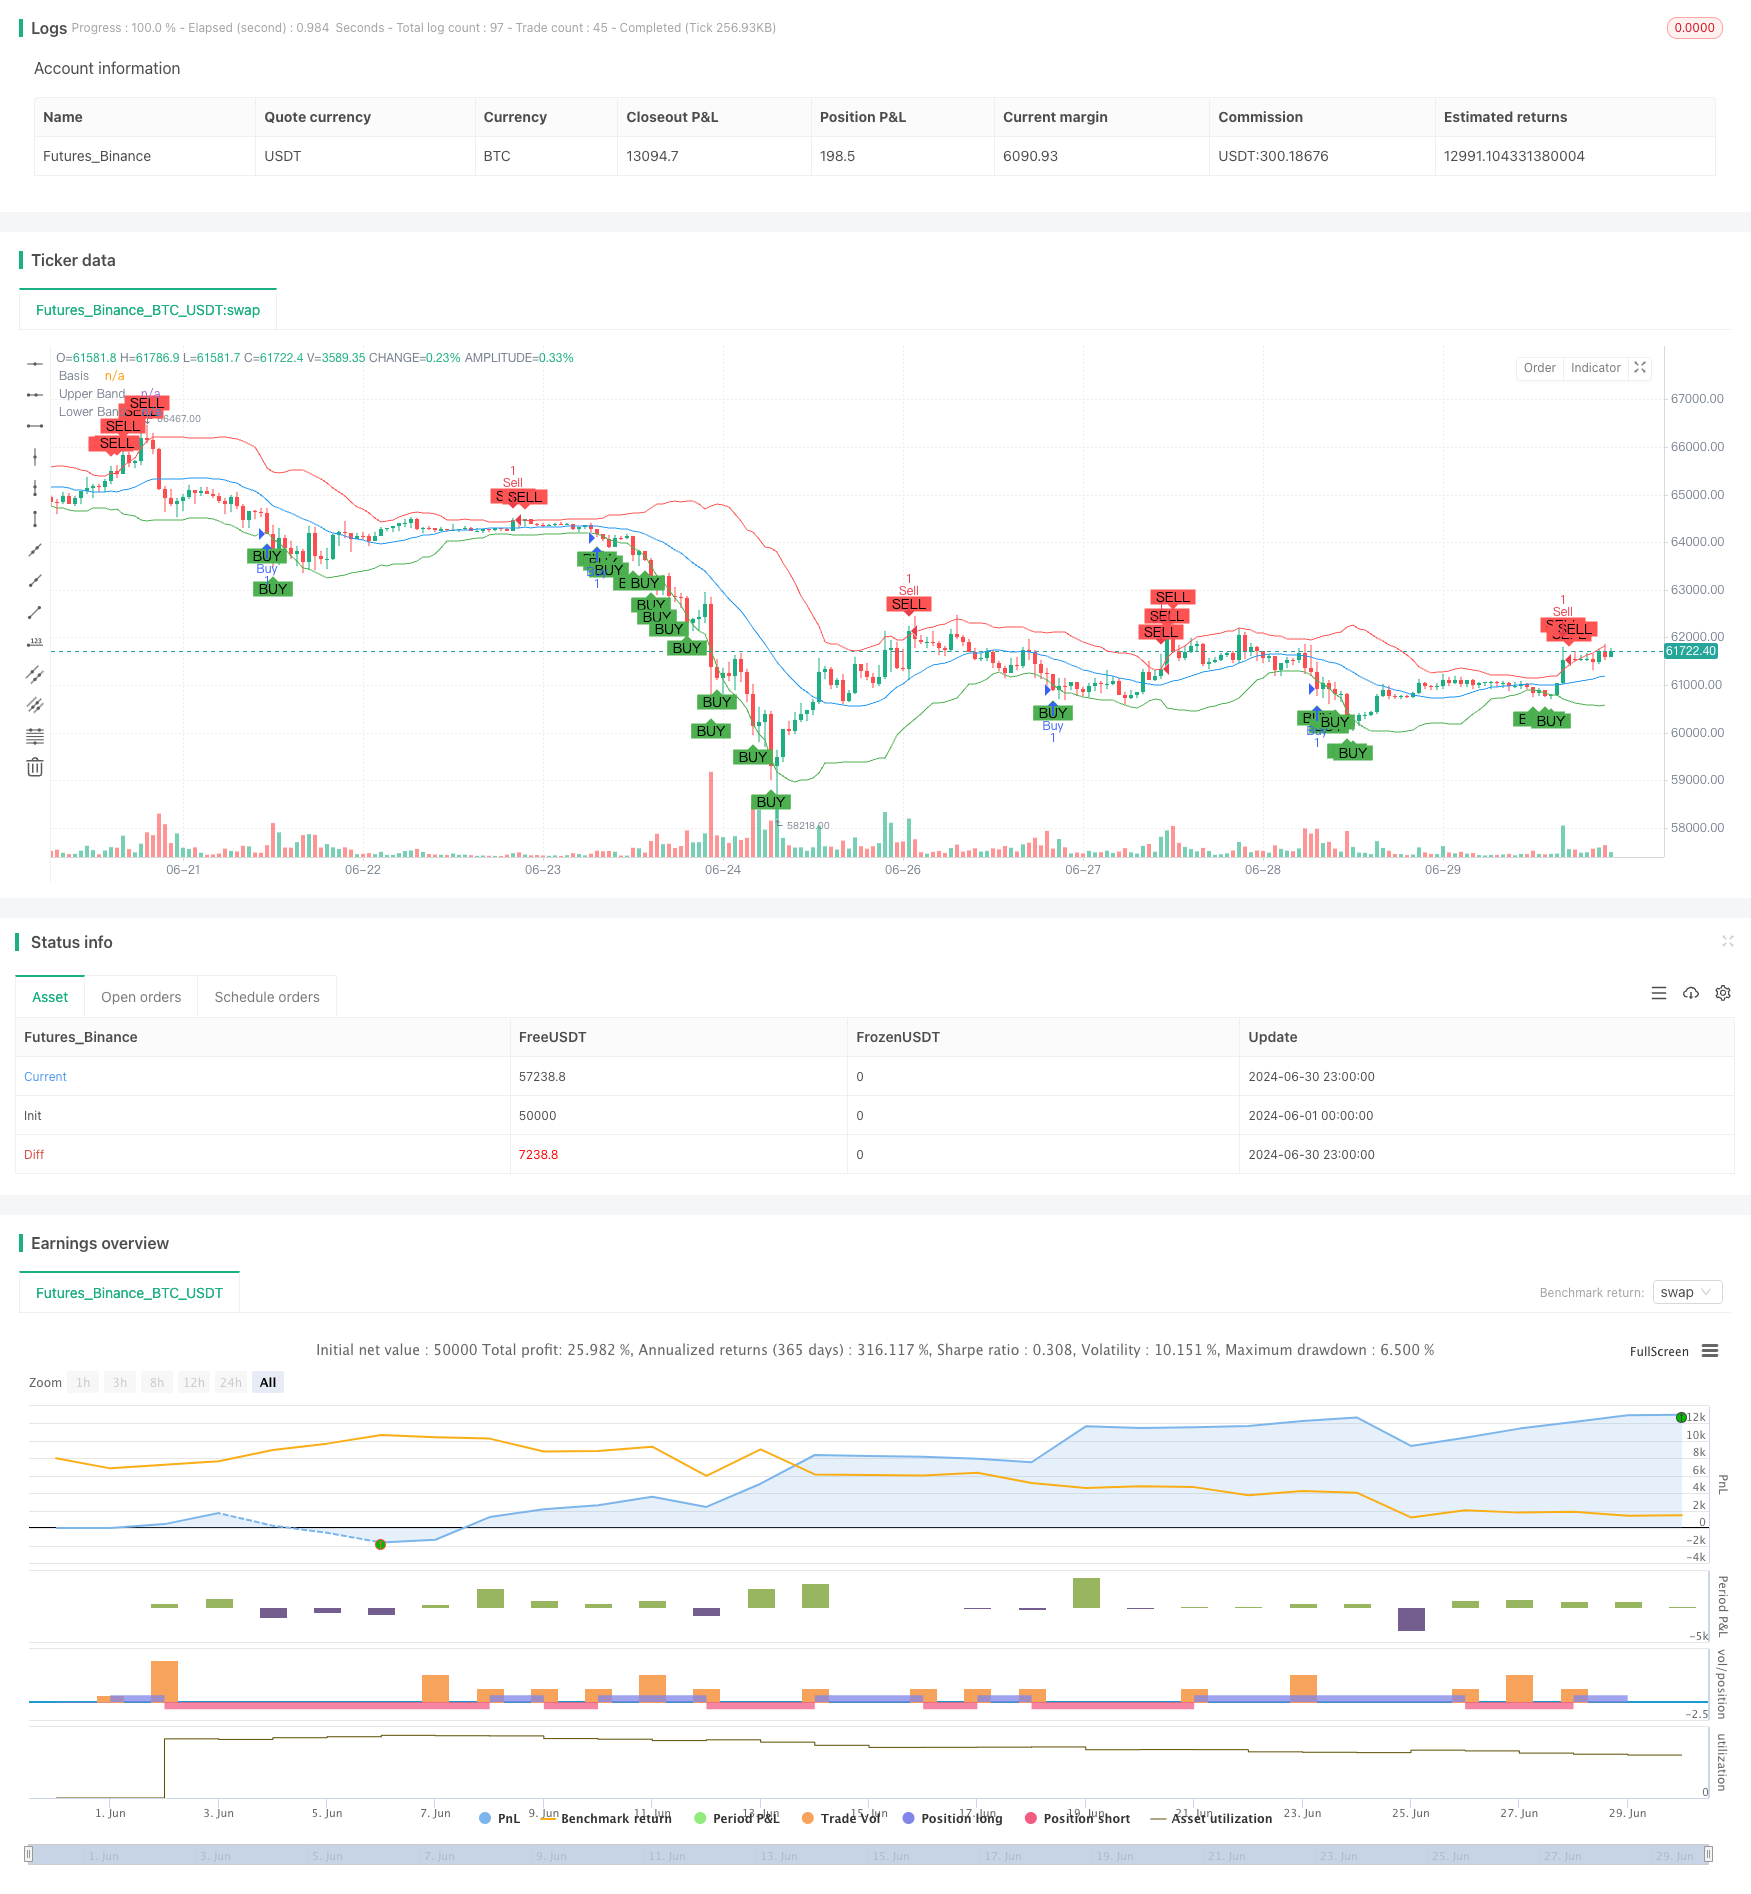
Overview
This article introduces a quantitative trading strategy based on Bollinger Bands breakout. The strategy utilizes the Bollinger Bands indicator to identify overbought and oversold market conditions, generating trading signals when prices break above or below the bands. This approach aims to capture significant market movements while providing a certain level of risk management.
Strategy Principles
The core principle of the Bollinger Bands breakout strategy is to use the concept of standard deviation from statistics to measure market volatility. The main steps of the strategy are as follows:
Calculate Bollinger Bands: Use a 20-day Simple Moving Average (SMA) as the middle band, with upper and lower bands set at 2 standard deviations above and below the middle band.
Generate trading signals:
- A long signal is generated when the closing price is below the lower band.
- A short signal is generated when the closing price is above the upper band.
Execute trades: Perform corresponding long or short operations based on the generated signals.
Visualization: Plot the Bollinger Bands and trading signals on the chart for intuitive analysis.
This method assumes that prices will fluctuate within the Bollinger Bands most of the time, and a breakout above or below the bands indicates a potential trend reversal or continuation opportunity.
Strategy Advantages
High adaptability: Bollinger Bands automatically adjust their width based on market volatility, allowing the strategy to adapt to different market environments.
Combines trend-following and reversal: Can capture both trend continuations and potential reversal opportunities.
Integrated risk management: Bollinger Bands themselves provide overbought and oversold indications, helping to control risk.
Good visualization: Trading signals and market conditions can be intuitively observed through the chart.
Flexible parameters: Bollinger Bands length and multiplier can be adjusted according to different market characteristics.
Fully automated: The strategy can be executed completely automatically, reducing human intervention.
Strategy Risks
False breakout risk: The market may experience brief breakouts followed by quick reversals, leading to false signals.
Underperformance in trending markets: In strong trend markets, prices may run outside the Bollinger Bands for extended periods, causing frequent trading.
Lag: Due to the use of moving averages, the strategy may react slowly in rapidly changing markets.
Overtrading: In highly volatile markets, too many trading signals may be generated, increasing transaction costs.
Lack of stop-loss mechanism: The code does not include an explicit stop-loss strategy, which may lead to significant losses.
Dependence on a single indicator: Relying solely on Bollinger Bands may ignore other important market information.
Strategy Optimization Directions
Introduce auxiliary indicators: Combine with other technical indicators (such as RSI or MACD) to filter trading signals and improve accuracy.
Add stop-loss and take-profit: Implement automatic stop-loss and take-profit functions to better control risk and lock in profits.
Dynamic parameter adjustment: Automatically adjust Bollinger Bands length and multiplier based on market volatility to improve strategy adaptability.
Add trading filters: Set minimum breakout amplitude or duration requirements to reduce false breakouts.
Optimize position management: Implement dynamic position allocation, adjusting trade size based on signal strength and market volatility.
Incorporate market trend judgment: Adjust the strategy in strong trend markets to avoid frequent counter-trend trading.
Backtesting and optimization: Conduct comprehensive backtests on different markets and timeframes to find the optimal parameter combinations.
Conclusion
The Bollinger Bands breakout quantitative trading strategy is a simple yet effective trading method that leverages statistical principles to capture market volatility opportunities. Its main advantages lie in its strong adaptability, integrated risk management, and fully automated execution. However, the strategy also has potential issues such as false breakout risks and underperformance in trending markets.
By introducing auxiliary indicators, improving risk management, and dynamically adjusting parameters, the stability and profitability of the strategy can be significantly enhanced. Future research directions could focus on multi-timeframe analysis and integration of machine learning algorithms to further improve the strategy’s intelligence and adaptability.
Overall, the Bollinger Bands breakout strategy provides a solid foundation for quantitative trading. Through continuous optimization and improvement, it has the potential to become a reliable trading tool.
//@version=5
strategy("Bollinger Bands Breakout Strategy", overlay=true)

// Parameters
bbLength = input.int(20, title="Bollinger Bands Length")
bbMultiplier = input.float(2.0, title="Bollinger Bands Multiplier")

// Calculate Bollinger Bands
basis = ta.sma(close, bbLength)
dev = bbMultiplier * ta.stdev(close, bbLength)
upperBand = basis + dev
lowerBand = basis - dev

// Plot Bollinger Bands
plot(basis, color=color.blue, title="Basis")
plot(upperBand, color=color.red, title="Upper Band")
plot(lowerBand, color=color.green, title="Lower Band")

// Entry conditions
longCondition = close < lowerBand
shortCondition = close > upperBand

// Execute trades
if (longCondition)
    strategy.entry("Buy", strategy.long)

if (shortCondition)
    strategy.entry("Sell", strategy.short)

// Plot buy/sell signals
plotshape(series=longCondition, title="Buy Signal", location=location.belowbar, color=color.green, style=shape.labelup, text="BUY")
plotshape(series=shortCondition, title="Sell Signal", location=location.abovebar, color=color.red, style=shape.labeldown, text="SELL")
- Bollinger Bands Mean Reversion Trading Strategy with Dynamic Support
- Bollinger Bands Momentum Reversal Quantitative Strategy
- Bollinger Bands Precise Crossover Quantitative Strategy
- Enhanced Dynamic Bollinger Bands Trading Strategy
- Triple Standard Deviation Bollinger Bands Breakout Strategy with 100-Day Moving Average Optimization
- Bollinger Bands and RSI Combined Trading Strategy
- Bollinger Bands Mean Reversion Trading Strategy with Volume Filter
- Bollinger Bands and RSI Crossover Trading Strategy
- Multi-Period Bollinger Bands Touch Trend Reversal Quantitative Trading Strategy
- Adaptive Bollinger Bands Dynamic Position Management Strategy
- Multi-EMA Crossover Strategy with Trend Confirmation
- Momentum-Driven EMA-RSI Crossover Strategy
- Multi-Indicator Dynamic Trading Strategy
- Multi-Indicator Intelligent Pyramiding Strategy
- Multi-EMA Crossover Momentum Strategy
- Multi-Order Breakout Trend Following Strategy
- Multi-EMA Crossover with Time Interval Integration Strategy
- Dual Moving Average Crossover Confirmation Strategy with Volume-Price Integration Optimization Model
- Dual Dynamic Indicator Optimization Strategy
- VWAP Crossover Dynamic Profit Target Trading Strategy
- Fibonacci Extension and Retracement Channel Breakout Strategy
- Multi-Dimensional Order Flow Analysis and Trading Strategy
- Multi-Moving Average Trend Following and Reversal Pattern Recognition Strategy
- Advanced Composite Moving Average and Market Momentum Trend Capture Strategy
- Advanced Fibonacci Retracement and Volume-Weighted Price Action Trading Strategy
- Adaptive Standard Deviation Breakout Trading Strategy: Multi-Period Optimization System Based on Dynamic Volatility
- Dynamic Position Dual Moving Average Crossover Strategy
- Dynamic Signal Line Trend Following Strategy Combining ATR and Volume
- Multi-Indicator Dynamic Volatility Alert Trading System
- Dynamic Trend-Following Trading Strategy Based on Gann Angles