Multi-Dimensional Trend Analysis with ATR-Based Dynamic Stop Management Strategy
Author: ChaoZhang, Date: 2025-01-17 16:39:21Tags: MACDEMAATRSMA

Overview
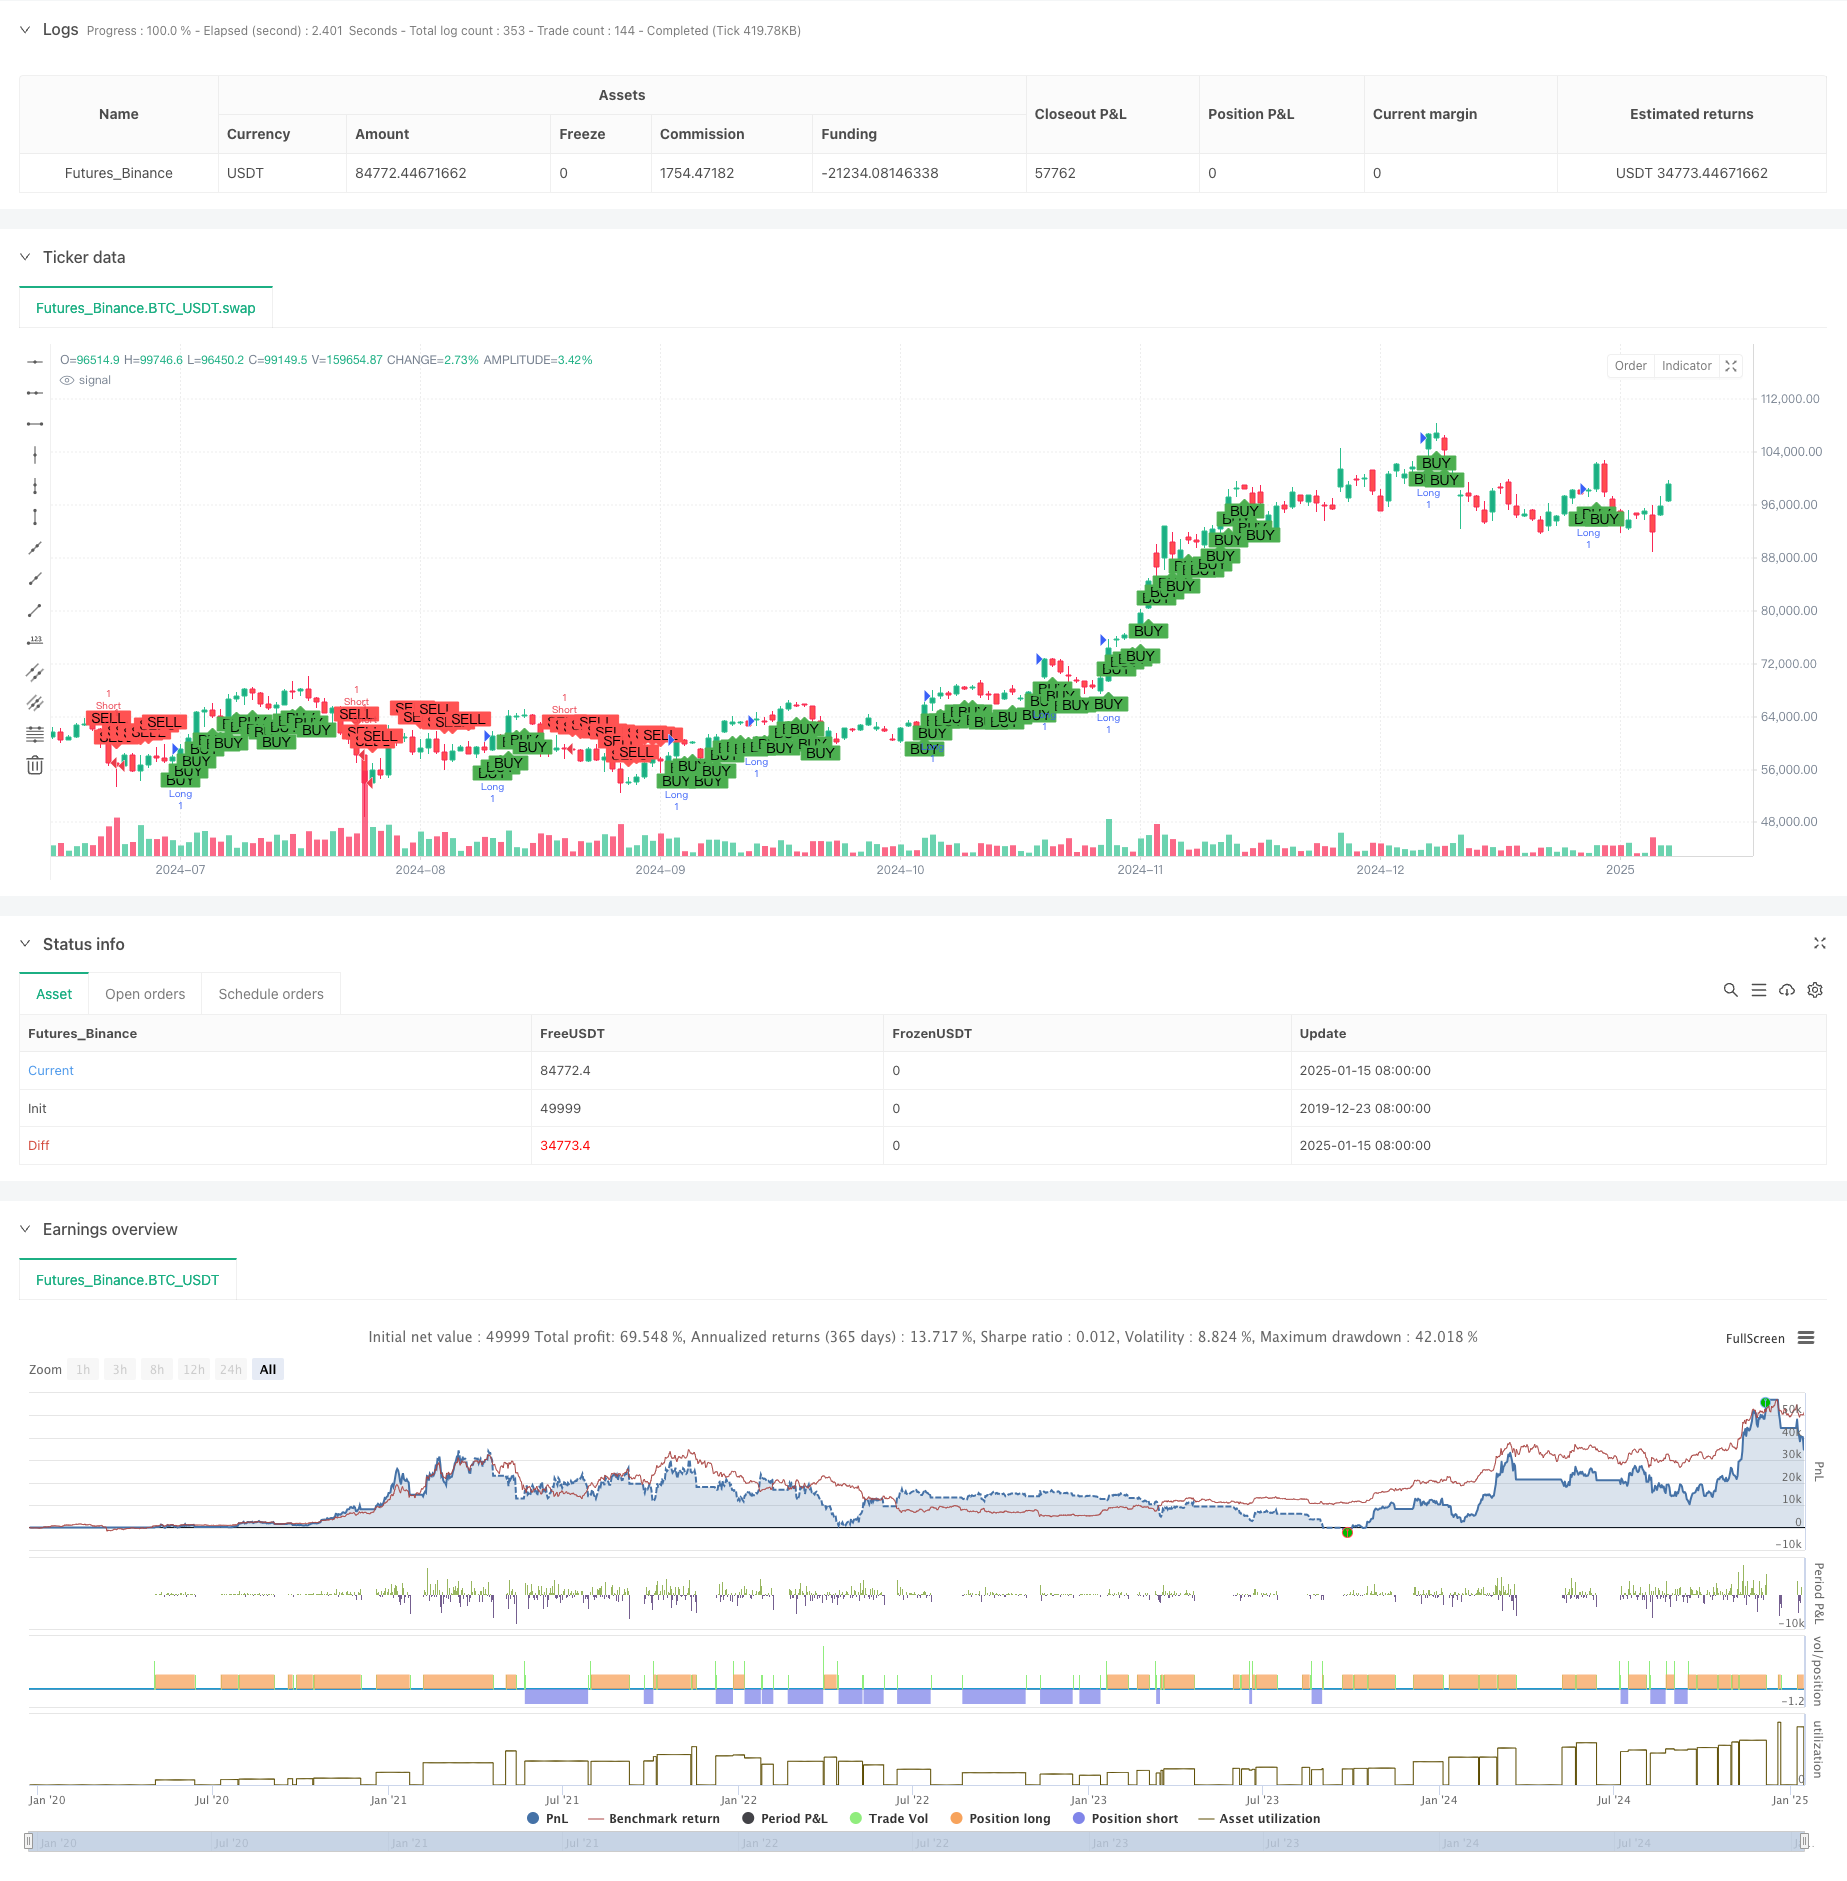
This strategy is a trend following system that combines multiple technical indicators, including Ichimoku Cloud, MACD indicator, and long-term moving average (EMA200). Through the coordination of these indicators, it forms a complete trading system that not only accurately captures market trends but also effectively controls risk through ATR-based dynamic stop management.
Strategy Principle
The strategy employs a triple confirmation mechanism to identify trading signals. First, it uses the Ichimoku Cloud to judge price position, favoring long positions when price is above the cloud and short positions when below. Second, it utilizes the MACD indicator, confirming trend direction through MACD line and signal line crossovers. Finally, it incorporates a 200-period EMA as a trend filter to ensure trade direction aligns with the long-term trend. For risk control, the strategy employs the ATR indicator to dynamically set stop-loss and take-profit levels, allowing them to adapt to market volatility.
Strategy Advantages
- Multi-dimensional trend confirmation mechanism significantly improves trading signal reliability
- Long-term moving average filtering prevents counter-trend trading
- ATR-based dynamic stop adjustment better adapts to market volatility
- Executing trades only after candle confirmation reduces false signals
- Combination of multiple mature technical indicators provides mutual verification, reducing misjudgment risk
Strategy Risks
- Multiple confirmation mechanisms may lead to delayed entry signals, missing some market moves
- May generate frequent entry and exit signals in ranging markets
- Reliance on technical indicators may underperform during extreme market volatility
- ATR-based stops may be triggered prematurely when volatility suddenly increases Recommend adjusting ATR multipliers to balance risk-reward ratio and consider adding market environment filters.
Strategy Optimization Directions
- Introduce volatility indicators (such as ATR range assessment) for market environment identification
- Add volume analysis to improve trend confirmation reliability
- Optimize MACD parameters to better adapt to different market cycles
- Consider adding trend strength filters to avoid trading in weak trends
- Implement dynamically adjusted profit/loss ratios to adapt to different market phases
Summary
This strategy constructs a relatively complete trend following system through the combined application of multi-dimensional technical indicators. Its core advantages lie in its multiple signal confirmation mechanism and dynamic risk management method, though parameter optimization based on actual market conditions is still needed. The strategy’s overall design is clear and practical, suitable for application in markets with obvious trends.
/*backtest
start: 2019-12-23 08:00:00
end: 2025-01-16 00:00:00
period: 1d
basePeriod: 1d
exchanges: [{"eid":"Futures_Binance","currency":"BTC_USDT","balance":49999}]
*/

//@version=6
strategy("JOJO长趋势", overlay=true, shorttitle="JOJO长趋势")

// Ichimoku 云图
conversionLine = ta.sma(high, 9)  // 转换线
baseLine = ta.sma(low, 26)  // 基准线
leadingSpanA = (conversionLine + baseLine) / 2  // 领先跨度A
leadingSpanB = (ta.sma(high, 52) + ta.sma(low, 52)) / 2  // 领先跨度B
laggingSpan = close[26]  // 滞后跨度

// MACD 指标
macdLine = ta.ema(close, 12) - ta.ema(close, 26)  // MACD 线
signalLine = ta.ema(macdLine, 9)  // 信号线
macdHist = macdLine - signalLine  // MACD 柱状图

// 长期均线
longTermEMA = ta.ema(close, 200)  // 200周期EMA,用于确认长期趋势

// 声明多单和空单条件变量
var bool longCondition = false
var bool shortCondition = false

// 声明平仓条件变量
var bool exitLongCondition = false
var bool exitShortCondition = false

// 仅在K线完成后计算
if barstate.isconfirmed
    longCondition := (close > leadingSpanA) and (macdLine > signalLine) and (close > longTermEMA)  // 多单条件
    shortCondition := (close < leadingSpanB) and (macdLine < signalLine) and (close < longTermEMA)  // 空单条件

    // 平仓条件
    exitLongCondition := macdLine < signalLine or close < leadingSpanB  // 多单平仓条件
    exitShortCondition := macdLine > signalLine or close > leadingSpanA  // 空单平仓条件

    // 执行策略进入市场
    if longCondition
        strategy.entry("Long", strategy.long)  // 多单进场

    if shortCondition
        strategy.entry("Short", strategy.short)  // 空单进场

    // 设置止损和止盈,使用 ATR 倍数动态调整
    stopLoss = input.float(1.5, title="止损 (ATR 倍数)", step=0.1) * ta.atr(14)  // 止损基于 ATR
    takeProfit = input.float(3.0, title="止盈 (ATR 倍数)", step=0.1) * ta.atr(14)  // 止盈基于 ATR

    // 执行平仓
    if exitLongCondition
        strategy.exit("Exit Long", from_entry="Long", stop=close - stopLoss, limit=close + takeProfit)  // 多单平仓

    if exitShortCondition
        strategy.exit("Exit Short", from_entry="Short", stop=close + stopLoss, limit=close - takeProfit)  // 空单平仓

// 绘制买入和卖出信号
plotshape(series=barstate.isconfirmed and longCondition, location=location.belowbar, color=color.green, style=shape.labelup, text="BUY")
plotshape(series=barstate.isconfirmed and shortCondition, location=location.abovebar, color=color.red, style=shape.labeldown, text="SELL")
- MACD-ATR-EMA Multi-Indicator Dynamic Trend Following Strategy
- Enhanced Price-Volume Trend Momentum Strategy
- Multi-Indicator Fusion Mean Reversion Trend Following Strategy
- Multi-Technical Indicator Trend Following Strategy with RSI Momentum Filter
- Short-term Short Selling Strategy for High-liquidity Currency Pairs
- Multi-EMA Trend Following Strategy with Dynamic ATR Targets
- Multi-Period Exponential Moving Average Crossover Strategy with Options Trading Suggestion System
- Golden Momentum Capture Strategy: Multi-Timeframe Exponential Moving Average Crossover System
- Adaptive Trend Flow Multiple Filter Trading Strategy
- Dual EMA Indicator Smart Crossing Trading System with Dynamic Stop-Loss and Take-Profit Strategy
- Dynamic Dual-Indicator Momentum Trend Quantitative Strategy System
- Adaptive Bollinger Bands Mean-Reversion Trading Strategy
- Advanced Multi-Indicator Trend Confirmation Trading Strategy
- Dual Moving Average-RSI Multi-Signal Trend Trading Strategy
- Adaptive Trend Following and Multi-Confirmation Trading Strategy
- Dynamic EMA System Combined with RSI Momentum Indicator for Optimized Intraday Trading Strategy
- Multi-Technical Indicator Crossover Momentum Trend Following Strategy
- Dynamic Stop-Loss Adjustment Elephant Bar Trend Following Strategy
- Dual-Period RSI Trend Momentum Strategy with Pyramiding Position Management System
- Multi-Timeframe Trading Strategy Combining Harmonic Patterns and Williams %R
- EMA Trend with Round Number Breakout Trading Strategy