Estrategia de arbitraje estadístico adaptativo que sigue el impulso

Descripción general
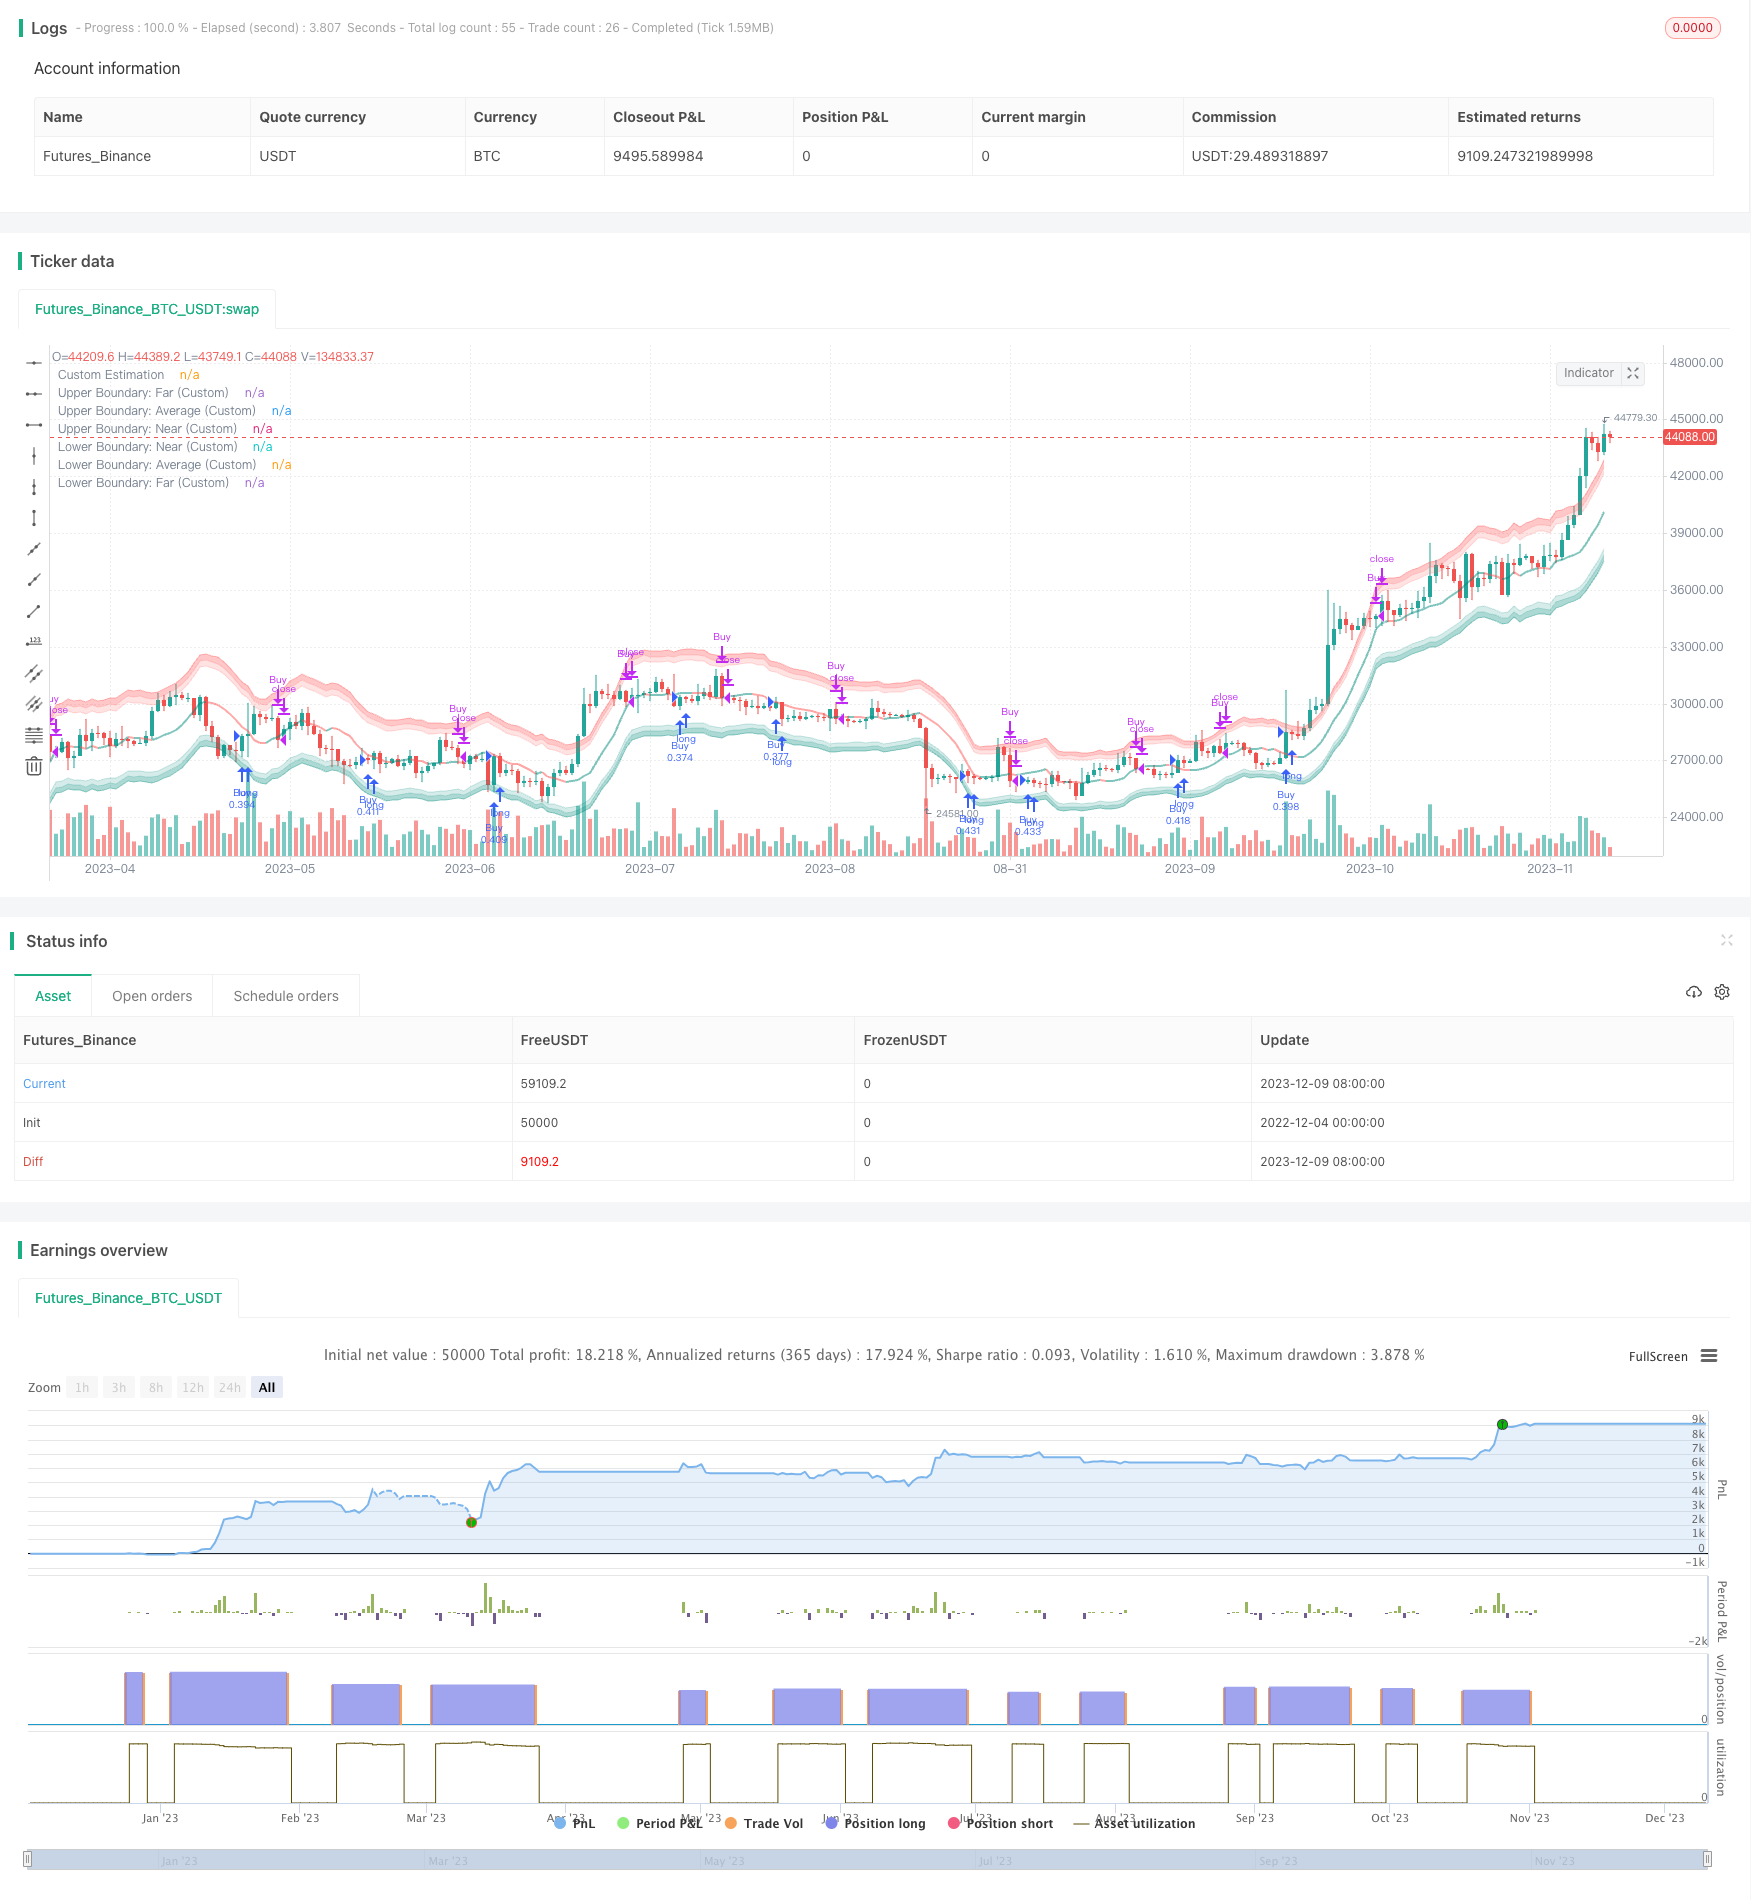
La estrategia se basa en el método de regresión nuclear de Nadaraya-Watson para construir una banda de contorno de fluctuación dinámica, que permite una señal de negociación de compra y venta baja al seguir el cruce de los precios con la banda de contorno. La estrategia tiene una base de análisis matemático y es capaz de adaptarse a los cambios en el mercado.
Principio de estrategia
El núcleo de la estrategia es el cálculo de la barrera dinámica del precio. En primer lugar, se construye una curva de regresión nuclear de Nadaraya-Watson de precios (precio de cierre, precio más alto, precio más bajo) en función de un período de retrospectiva personalizado, obteniendo una estimación de precios suavizada. Luego, se calcula el indicador ATR basado en la longitud de ATR personalizada, combinando los factores de extremo cercano y el factor de extremo lejano, obteniendo el alcance de la barrera superior y inferior.
Ventajas estratégicas
- Basado en modelos matemáticos, los parámetros son controlables, no es fácil producir una optimización excesiva
- Adaptarse a los cambios en el mercado y aprovechar la dinámica de los precios y la volatilidad para capturar oportunidades de negociación
- Utilizando coordenadas logarítmicas, las variedades pueden manejar muy bien diferentes períodos de tiempo y amplitudes de fluctuación
- Sensibilidad de las políticas de ajuste de parámetros personalizables
Riesgo estratégico
- Modelo matemático teórico, el disco real puede no funcionar como se esperaba
- La selección de los parámetros clave requiere experiencia, la configuración incorrecta puede afectar los ingresos
- Hay un cierto retraso y se pueden perder algunas oportunidades de negocio.
- Las señales erróneas en un mercado con grandes sacudidas
Los riesgos se evitan y reducen principalmente a través de la optimización de los parámetros, hacer una buena evaluación, conocer los factores de impacto y tomar precauciones concretas.
Dirección de optimización de la estrategia
- Optimización de los parámetros para encontrar la combinación óptima
- Parámetros de preferencia automática con métodos de aprendizaje automático
- Aumentar las condiciones de filtración y activar las estrategias en un entorno de mercado específico
- En combinación con otros indicadores de filtración de señales engañosas
- Intentar diferentes algoritmos de modelos matemáticos
Resumir
La estrategia integra el análisis estadístico y el análisis de indicadores técnicos para lograr señales de comercio de compra y venta bajas a través del seguimiento dinámico de los precios y la volatilidad. Los parámetros se pueden ajustar según el mercado y sus propias condiciones. En general, la base teórica de la estrategia es sólida, y el rendimiento real aún debe ser verificado.
/*backtest
start: 2022-12-04 00:00:00
end: 2023-12-10 00:00:00
period: 1d
basePeriod: 1h
exchanges: [{"eid":"Futures_Binance","currency":"BTC_USDT"}]
*/

// © Julien_Eche
//@version=5

strategy("Nadaraya-Watson Envelope Strategy", overlay=true, pyramiding=1, default_qty_type=strategy.percent_of_equity, default_qty_value=20)

// Helper Functions
getEnvelopeBounds(_atr, _nearFactor, _farFactor, _envelope) =>
    _upperFar = _envelope + _farFactor*_atr
    _upperNear = _envelope + _nearFactor*_atr
    _lowerNear = _envelope - _nearFactor*_atr
    _lowerFar = _envelope - _farFactor*_atr
    _upperAvg = (_upperFar + _upperNear) / 2
    _lowerAvg = (_lowerFar + _lowerNear) / 2
    [_upperNear, _upperFar, _upperAvg, _lowerNear, _lowerFar, _lowerAvg]

customATR(length, _high, _low, _close) =>
    trueRange = na(_high[1])? math.log(_high)-math.log(_low) : math.max(math.max(math.log(_high) - math.log(_low), math.abs(math.log(_high) - math.log(_close[1]))), math.abs(math.log(_low) - math.log(_close[1])))
    ta.rma(trueRange, length)

customKernel(x, h, alpha, x_0) =>
    sumWeights = 0.0
    sumXWeights = 0.0
    for i = 0 to h
        weight = math.pow(1 + (math.pow((x_0 - i), 2) / (2 * alpha * h * h)), -alpha)
        sumWeights := sumWeights + weight
        sumXWeights := sumXWeights + weight * x[i]
    sumXWeights / sumWeights

// Custom Settings
customLookbackWindow = input.int(8, 'Lookback Window (Custom)', group='Custom Settings')
customRelativeWeighting = input.float(8., 'Relative Weighting (Custom)', step=0.25, group='Custom Settings')
customStartRegressionBar = input.int(25, "Start Regression at Bar (Custom)", group='Custom Settings')

// Envelope Calculations
customEnvelopeClose = math.exp(customKernel(math.log(close), customLookbackWindow, customRelativeWeighting, customStartRegressionBar))
customEnvelopeHigh = math.exp(customKernel(math.log(high), customLookbackWindow, customRelativeWeighting, customStartRegressionBar))
customEnvelopeLow = math.exp(customKernel(math.log(low), customLookbackWindow, customRelativeWeighting, customStartRegressionBar))
customEnvelope = customEnvelopeClose
customATRLength = input.int(60, 'ATR Length (Custom)', minval=1, group='Custom Settings')
customATR = customATR(customATRLength, customEnvelopeHigh, customEnvelopeLow, customEnvelopeClose)
customNearATRFactor = input.float(1.5, 'Near ATR Factor (Custom)', minval=0.5, step=0.25, group='Custom Settings')
customFarATRFactor = input.float(2.0, 'Far ATR Factor (Custom)', minval=1.0, step=0.25, group='Custom Settings')
[customUpperNear, customUpperFar, customUpperAvg, customLowerNear, customLowerFar, customLowerAvg] = getEnvelopeBounds(customATR, customNearATRFactor, customFarATRFactor, math.log(customEnvelopeClose))

// Colors
customUpperBoundaryColorFar = color.new(color.red, 60)
customUpperBoundaryColorNear = color.new(color.red, 80)
customBullishEstimatorColor = color.new(color.teal, 50)
customBearishEstimatorColor = color.new(color.red, 50)
customLowerBoundaryColorNear = color.new(color.teal, 80)
customLowerBoundaryColorFar = color.new(color.teal, 60)

// Plots
customUpperBoundaryFar = plot(math.exp(customUpperFar), color=customUpperBoundaryColorFar, title='Upper Boundary: Far (Custom)')
customUpperBoundaryAvg = plot(math.exp(customUpperAvg), color=customUpperBoundaryColorNear, title='Upper Boundary: Average (Custom)')
customUpperBoundaryNear = plot(math.exp(customUpperNear), color=customUpperBoundaryColorNear, title='Upper Boundary: Near (Custom)')
customEstimationPlot = plot(customEnvelopeClose, color=customEnvelope > customEnvelope[1] ? customBullishEstimatorColor : customBearishEstimatorColor, linewidth=2, title='Custom Estimation')
customLowerBoundaryNear = plot(math.exp(customLowerNear), color=customLowerBoundaryColorNear, title='Lower Boundary: Near (Custom)')
customLowerBoundaryAvg = plot(math.exp(customLowerAvg), color=customLowerBoundaryColorNear, title='Lower Boundary: Average (Custom)')
customLowerBoundaryFar = plot(math.exp(customLowerFar), color=customLowerBoundaryColorFar, title='Lower Boundary: Far (Custom)')

// Fills
fill(customUpperBoundaryFar, customUpperBoundaryAvg, color=customUpperBoundaryColorFar, title='Upper Boundary: Farmost Region (Custom)')
fill(customUpperBoundaryNear, customUpperBoundaryAvg, color=customUpperBoundaryColorNear, title='Upper Boundary: Nearmost Region (Custom)')
fill(customLowerBoundaryNear, customLowerBoundaryAvg, color=customLowerBoundaryColorNear, title='Lower Boundary: Nearmost Region (Custom)')
fill(customLowerBoundaryFar, customLowerBoundaryAvg, color=customLowerBoundaryColorFar, title='Lower Boundary: Farmost Region (Custom)')


longCondition = ta.crossover(close, customEnvelopeLow)
if (longCondition)
    strategy.entry("Buy", strategy.long)

exitLongCondition = ta.crossover(customEnvelopeHigh, close)
if (exitLongCondition)
    strategy.close("Buy")