概述
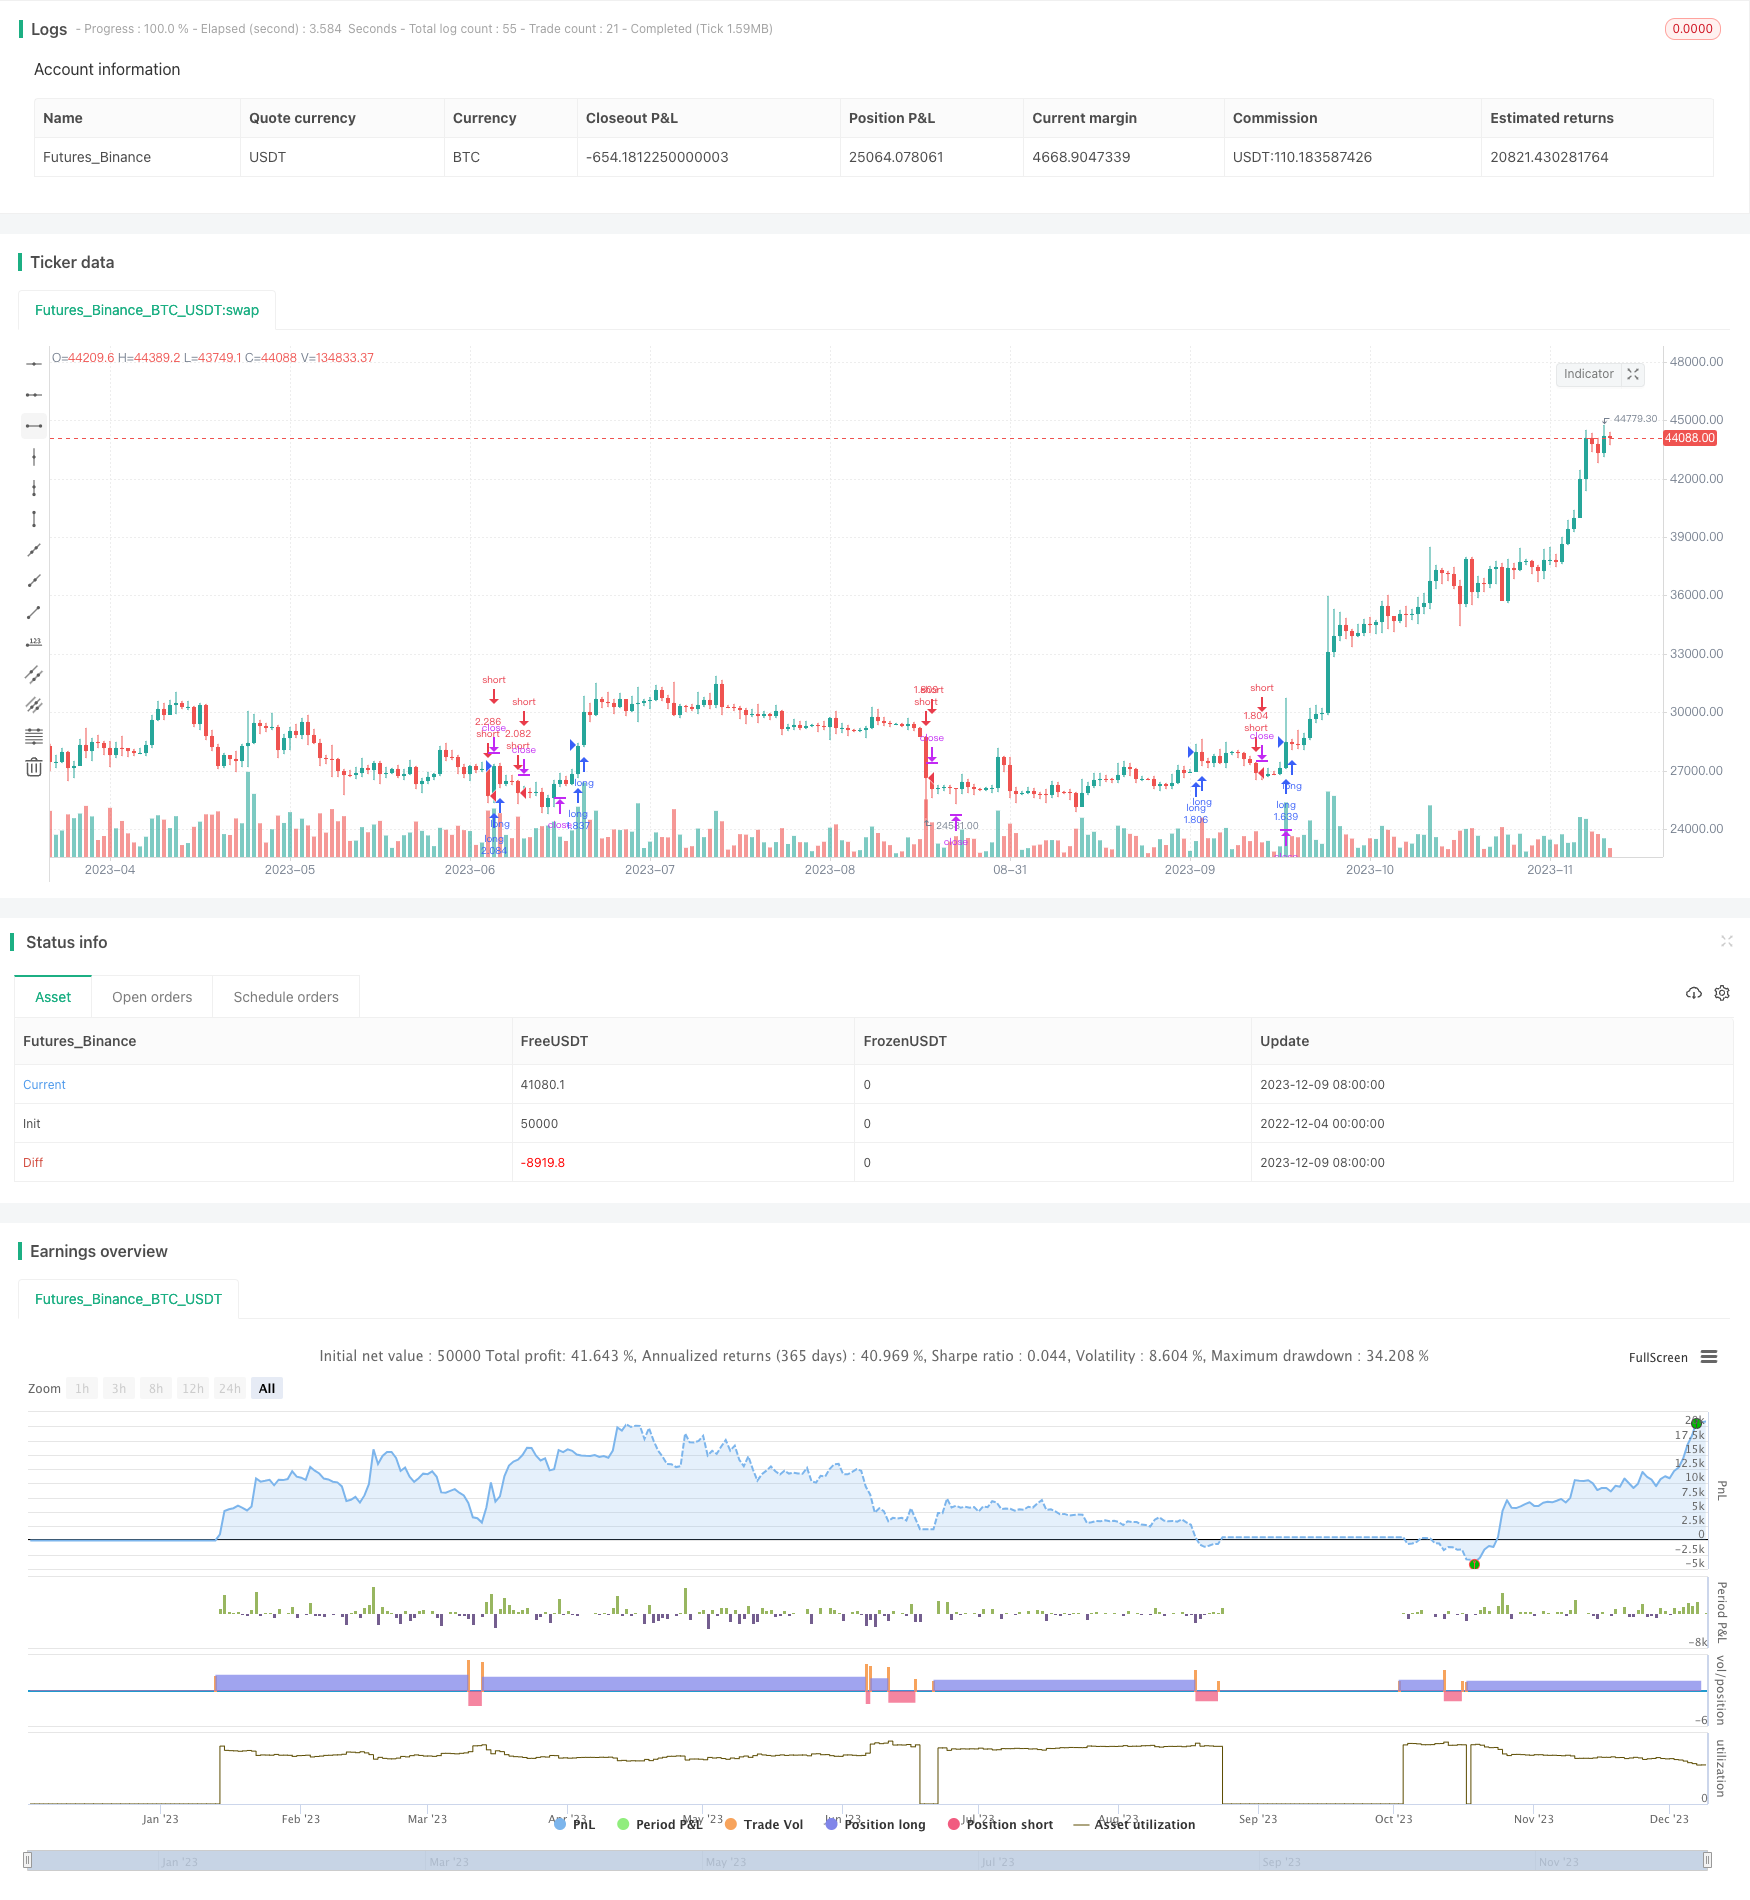
该策略是一种长期持有的加密货币趋势跟踪策略,它结合了移动平均线、相对强弱指标(RSI)和市场相关性概念,目标是识别中长线的价格趋势,在趋势开始建立头寸,随着趋势的发展逐步加仓,直至发现趋势反转信号而止盈。
策略原理
该策略主要基于三个指标进行判断:
相对强弱指标(RSI):用于识别超买超卖现象,RSI高于51时为超买信号,低于49时为超卖信号。
移动平均线(SMA):计算close价格的9日简单移动平均线,作为判断趋势方向的指标。
市场相关性:选取加密货币总市值作为基准行情,计算与交易品种的相关性,用相关性行情替代交易品种本身的K线行情,以提高交易信号的效果。
具体交易规则是:
多头入场:RSI上穿51且close价格高于9日SMA时做多;
空头入场:RSI下穿49且close价格低于9日SMA时做空;
止盈止损原则:多头止盈设置为1%,止损设置为0.1%;空头止盈设置为0.05%,止损设置为0.03%。
该策略同时设定了时间条件,只在指定的日期范围内交易。
优势分析
结合了趋势和超买超卖指标,能够有效跟踪中长线趋势;
利用市场相关性提高信号质量,避免被单一品种的假趋势误导;
自动止盈止损设置合理,避免亏损扩大;
可自定义时间范围,适应不同阶段的市场行情。
风险分析
中长线趋势策略,无法应对短线大幅震荡市场;
相关性市场作为基准行情,当基准市场发生转折时,交易品种可能滞后,无法及时止损;
只做多或只做空时,容易错过反向行情机会。
对策:
可结合其他短期指标,如KC、BOLL等判定市场阶段,加强止损;
增加对基准行情的分析,发现基准转折时及时平仓;
交易双向品种,充分捕捉多空机会。
优化方向
参数优化:优化RSI参数、移动平均线参数、止盈止损幅度,使策略更匹配市场统计特性。
交易品种优化:评估更多可能的基准行情和交易品种,选择相关性更高、流动性更好的组合。
策略组合:与其他策略组合使用,在大周期判断市场趋势方向的同时,利用本策略进行中长线持仓。
总结
该策略总体上是一个优化空间大、适用面广的中长线加密货币趋势跟踪策略。它有效地结合趋势、超买超卖和相关性判断来提高交易决策的质量,通过参数调整和组合使用可以大幅增强策略的稳定性和收益率。中长期持有的交易方式也非常符合加密货币这个波动较大、短线难以捕捉精确趋势的品种。
/*backtest
start: 2022-12-04 00:00:00
end: 2023-12-10 00:00:00
period: 1d
basePeriod: 1h
exchanges: [{"eid":"Futures_Binance","currency":"BTC_USDT"}]
*/

// This source code is subject to the terms of the Mozilla Public License 2.0 at https://mozilla.org/MPL/2.0/
// © exlux99

//@version=4
strategy(title = "Crypto swing correlation", overlay = true,  pyramiding=1,initial_capital = 1, default_qty_type= strategy.percent_of_equity, default_qty_value = 100, calc_on_order_fills=false, slippage=0,commission_type=strategy.commission.percent,commission_value=0.03)

//time
fromDay = input(defval = 1, title = "From Day", minval = 1, maxval = 31)
fromMonth = input(defval = 1, title = "From Month", minval = 1, maxval = 12)
fromYear = input(defval = 2010, title = "From Year", minval = 1970)
 //monday and session
// To Date Inputs
toDay = input(defval = 31, title = "To Day", minval = 1, maxval = 31)
toMonth = input(defval = 12, title = "To Month", minval = 1, maxval = 12)
toYear = input(defval = 2021, title = "To Year", minval = 1970)

startDate = timestamp(fromYear, fromMonth, fromDay, 00, 00)
finishDate = timestamp(toYear, toMonth, toDay, 00, 00)
time_cond = true

useCorrelation    = input(true, title="Use Correlation candles?")

symbol = input("BTC_USDT:swap", type=input.symbol)

haClose = useCorrelation ? security(symbol, timeframe.period, close) : close
haOpen  = useCorrelation ? security(symbol, timeframe.period, open) : open
haHigh  = useCorrelation ? security(symbol, timeframe.period, high) : high
haLow   = useCorrelation ? security(symbol, timeframe.period, low) : low

length = input( 50 )
overSold = input( 51 )
overBought = input( 49 )

s = input(title="Source", defval="haClose", options=["haClose", "haOpen", "haHigh", "haLow"])

price = s == "haClose" ? haClose: s == "haOpen" ? haOpen : s == "haHigh" ? haHigh : s == "haLow" ? haLow : na

len = input(8, "Length Moving average", minval=1)
src = price
ma = sma(src, len)


vrsi = rsi(price, length)
long = crossover(vrsi, overSold) and time_cond and price > ma
short = crossunder(vrsi, overBought) and time_cond and price < ma


takeProfit_long=input(1.0, step=0.005)
stopLoss_long=input(0.1, step=0.005)
takeProfit_short=input(0.05, step=0.005)
stopLoss_short=input(0.03, step=0.005)

strategy.entry("long",1,when=long)
strategy.entry("short",0,when=short)

strategy.exit("short_tp/sl", "long", profit=close * takeProfit_long / syminfo.mintick, loss=close * stopLoss_long / syminfo.mintick, comment='LONG EXIT',  alert_message = 'closeshort')
strategy.exit("short_tp/sl", "short", profit=close * takeProfit_short / syminfo.mintick, loss=close * stopLoss_short / syminfo.mintick, comment='SHORT EXIT',  alert_message = 'closeshort')