概述
诺罗波动通道scalping策略(Noro’s Price Channel Scalping Strategy)是一个基于价格通道和价格波动带的scalping交易策略。该策略利用价格通道和价格波动带来识别市场趋势,并在趋势方向发生转折时进行入场。
策略原理
该策略首先计算价格的最高价通道(lasthigh)和最低价通道(lastlow),然后计算出价格通道中线(center)。接着计算价格与中线的距离(dist)以及距离的简单移动平均(distsma)。 据此可以计算出距离中线1倍(hd和ld)和2倍(hd2和ld2)的价格波动带。
当价格上穿距离中线1倍的波动带时判断为看涨,当价格下穿距离中线1倍的波动带时判断为看跌。策略在衰竭的迹象出现时进行反向开仓。例如在看涨的趋势下,如果出现两根阳线,则在第二根阳线收盘时做空;在看跌的趋势下,如果出现两根阴线,则在第二根阴线收盘时做多。
策略优势
- 利用价格通道判断市场趋势方向,避免错误交易
- 基于价格波动带来判断趋势是否衰竭,精确捕捉转折点
- 采用scalping交易方式,获利快速
策略风险
- 价格震荡大时,价格通道和波动带可能失效
- scalping交易需要较高的交易频率,容易增加交易成本和滑点风险
- 需要充分考虑止损策略,以控制亏损风险
策略优化
- 优化价格通道和波动带的参数,适应更多市场情况
- 结合其他指标判断趋势和转折点
- 增加止损策略
- 考虑交易成本和滑点的影响
总结
诺罗波动通道scalping策略整体来说是一个非常适合scalping交易的策略。它利用价格通道和波动带判断市场走势,并在见顶或见底迹象出现时反向开仓。该策略交易频率高、获利快速,但也面临一定的风险。通过进一步优化,可以使该策略在更多不同市场中应用。
策略源码
/*backtest
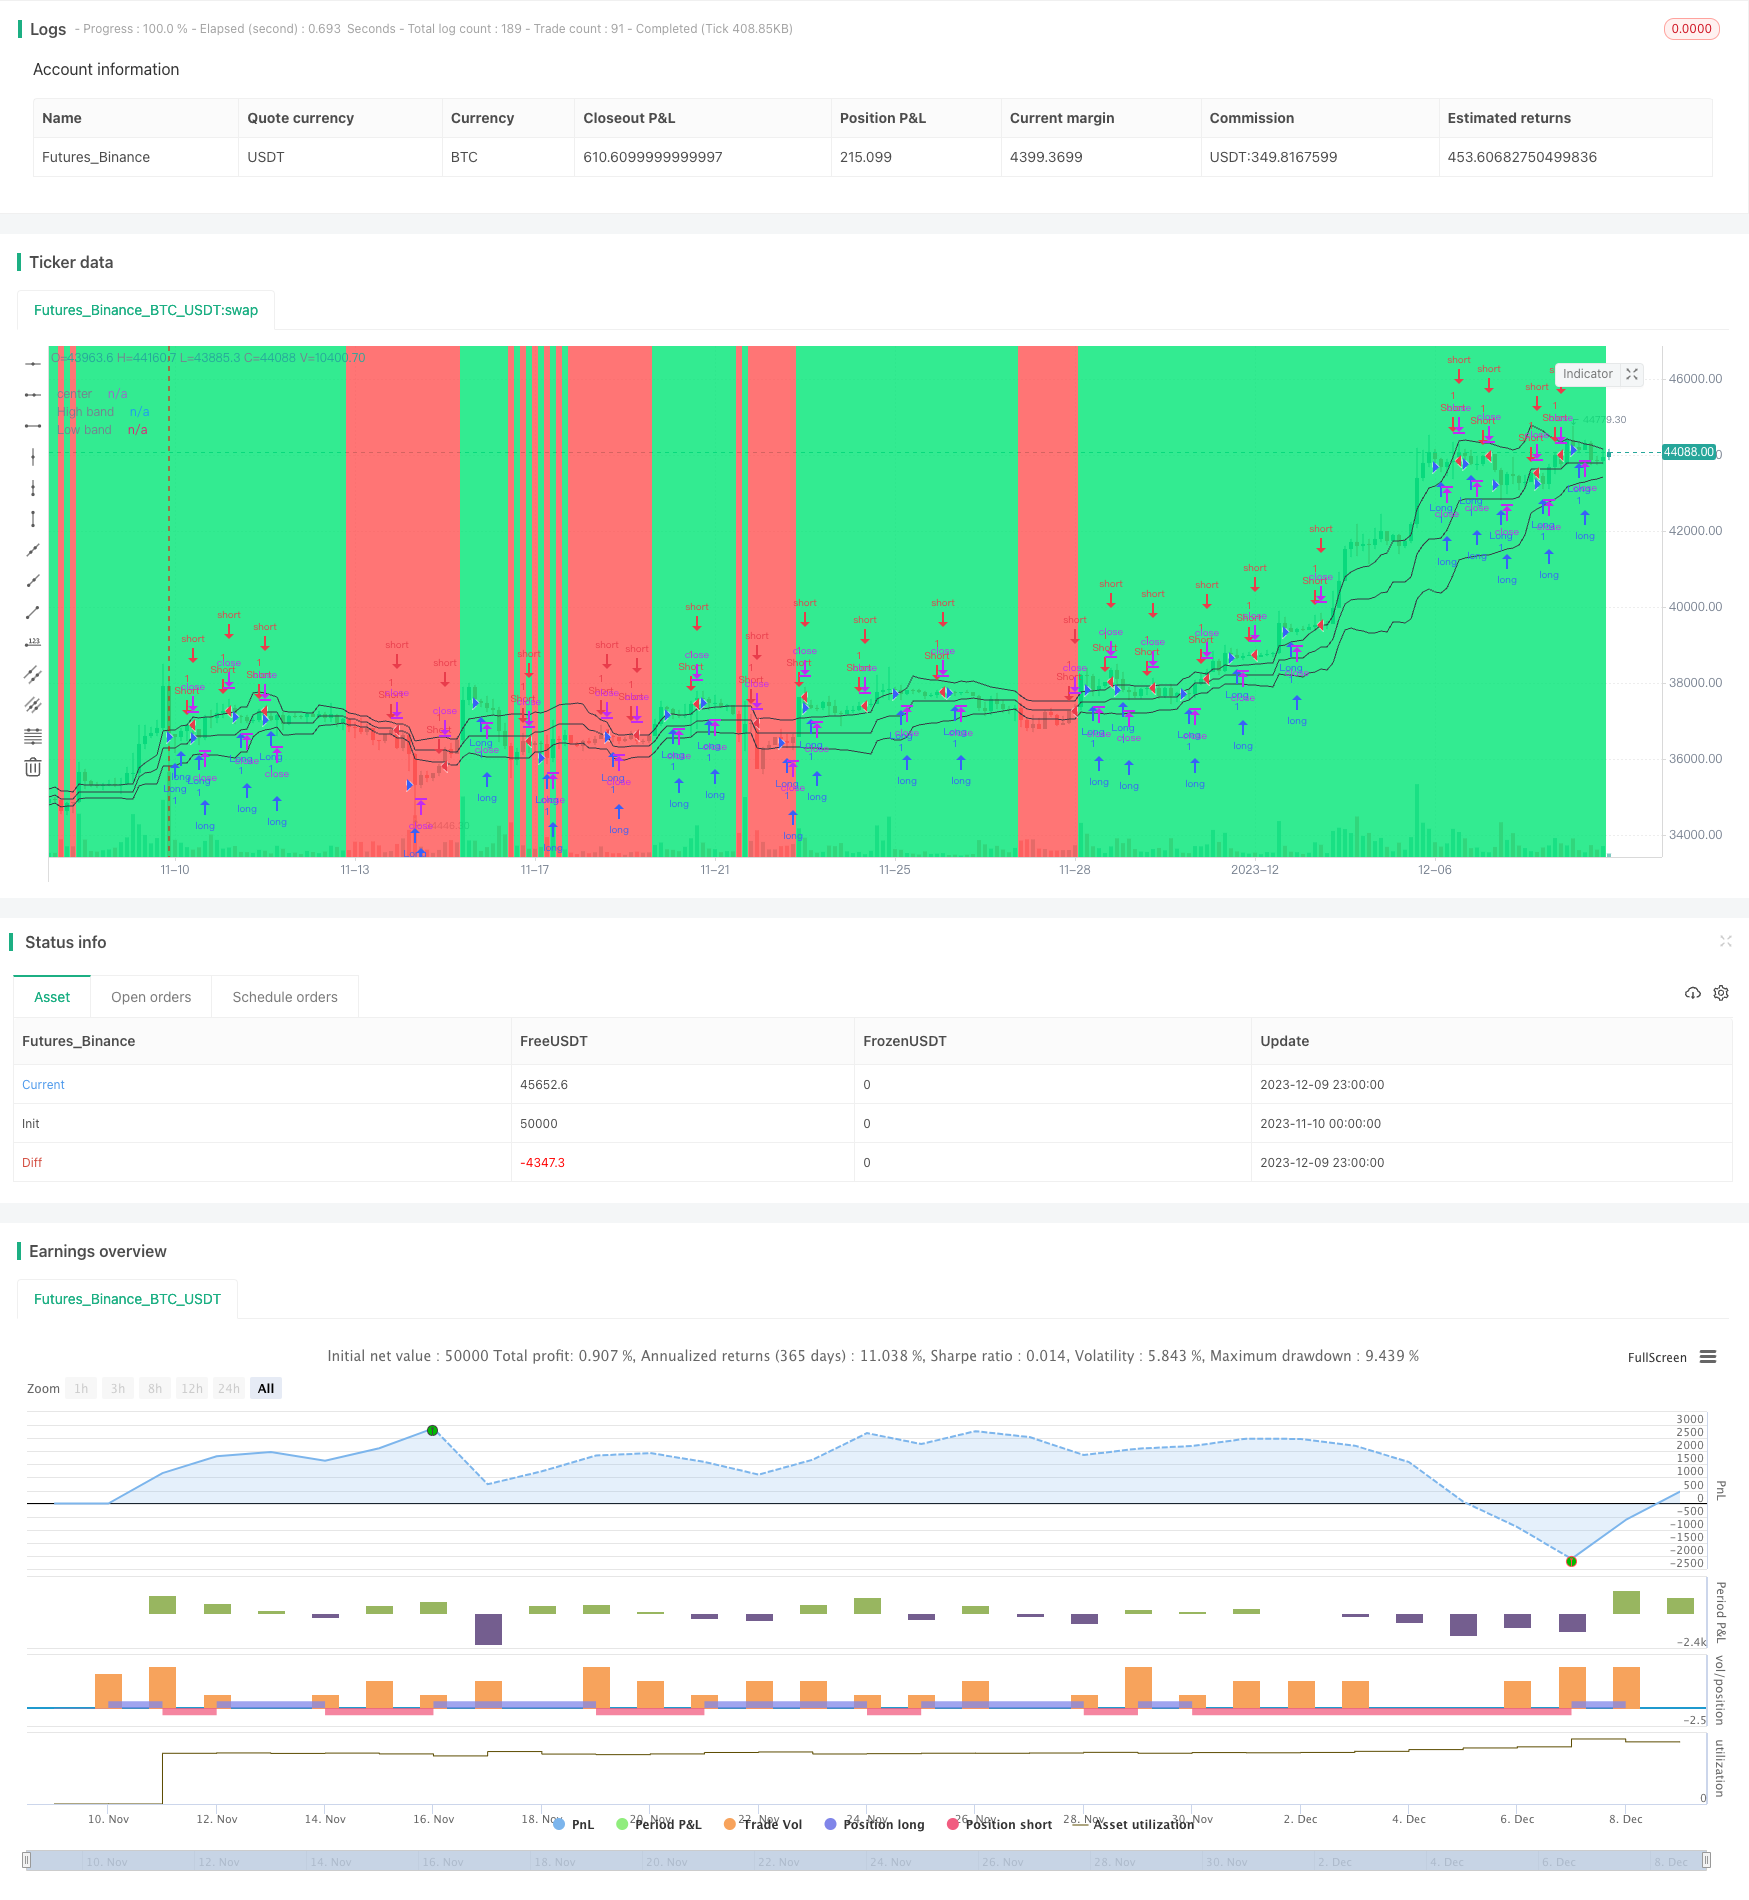
start: 2023-11-10 00:00:00
end: 2023-12-10 00:00:00
period: 3h
basePeriod: 15m
exchanges: [{"eid":"Futures_Binance","currency":"BTC_USDT"}]
*/
//@version=2
strategy("Noro's Bands Scalper Strategy v1.0", shorttitle = "Scalper str 1.0", overlay=true, default_qty_type = strategy.percent_of_equity, default_qty_value=100.0, pyramiding=0)
//Settings
needlong = input(true, defval = true, title = "Long")
needshort = input(true, defval = true, title = "Short")
len = input(20, defval = 20, minval = 2, maxval = 200, title = "Period")
needbb = input(true, defval = true, title = "Show Bands")
needbg = input(true, defval = true, title = "Show Background")
src = close
//PriceChannel
lasthigh = highest(src, len)
lastlow = lowest(src, len)
center = (lasthigh + lastlow) / 2
//Distance
dist = abs(src - center)
distsma = sma(dist, len)
hd = center + distsma
ld = center - distsma
hd2 = center + distsma * 2
ld2 = center - distsma * 2
//Trend
trend = close < ld and high < hd ? -1 : close > hd and low > ld ? 1 : trend[1]
//Lines
colo = needbb == false ? na : black
plot(hd, color = colo, linewidth = 1, transp = 0, title = "High band")
plot(center, color = colo, linewidth = 1, transp = 0, title = "center")
plot(ld, color = colo, linewidth = 1, transp = 0, title = "Low band")
//Background
col = needbg == false ? na : trend == 1 ? lime : red
bgcolor(col, transp = 80)
//Signals
bar = close > open ? 1 : close < open ? -1 : 0
up7 = trend == 1 and bar == -1 and bar[1] == -1 ? 1 : 0
dn7 = trend == 1 and bar == 1 and bar[1] == 1 and close > strategy.position_avg_price ? 1 : 0
up8 = trend == -1 and bar == -1 and bar[1] == -1 and close < strategy.position_avg_price ? 1 : 0
dn8 = trend == -1 and bar == 1 and bar[1] == 1 ? 1 : 0
if up7 == 1 or up8 == 1
strategy.entry("Long", strategy.long, needlong == false ? 0 : trend == -1 ? 0 : na)
if dn7 == 1 or dn8 == 1
strategy.entry("Short", strategy.short, needshort == false ? 0 : trend == 1 ? 0 : na)