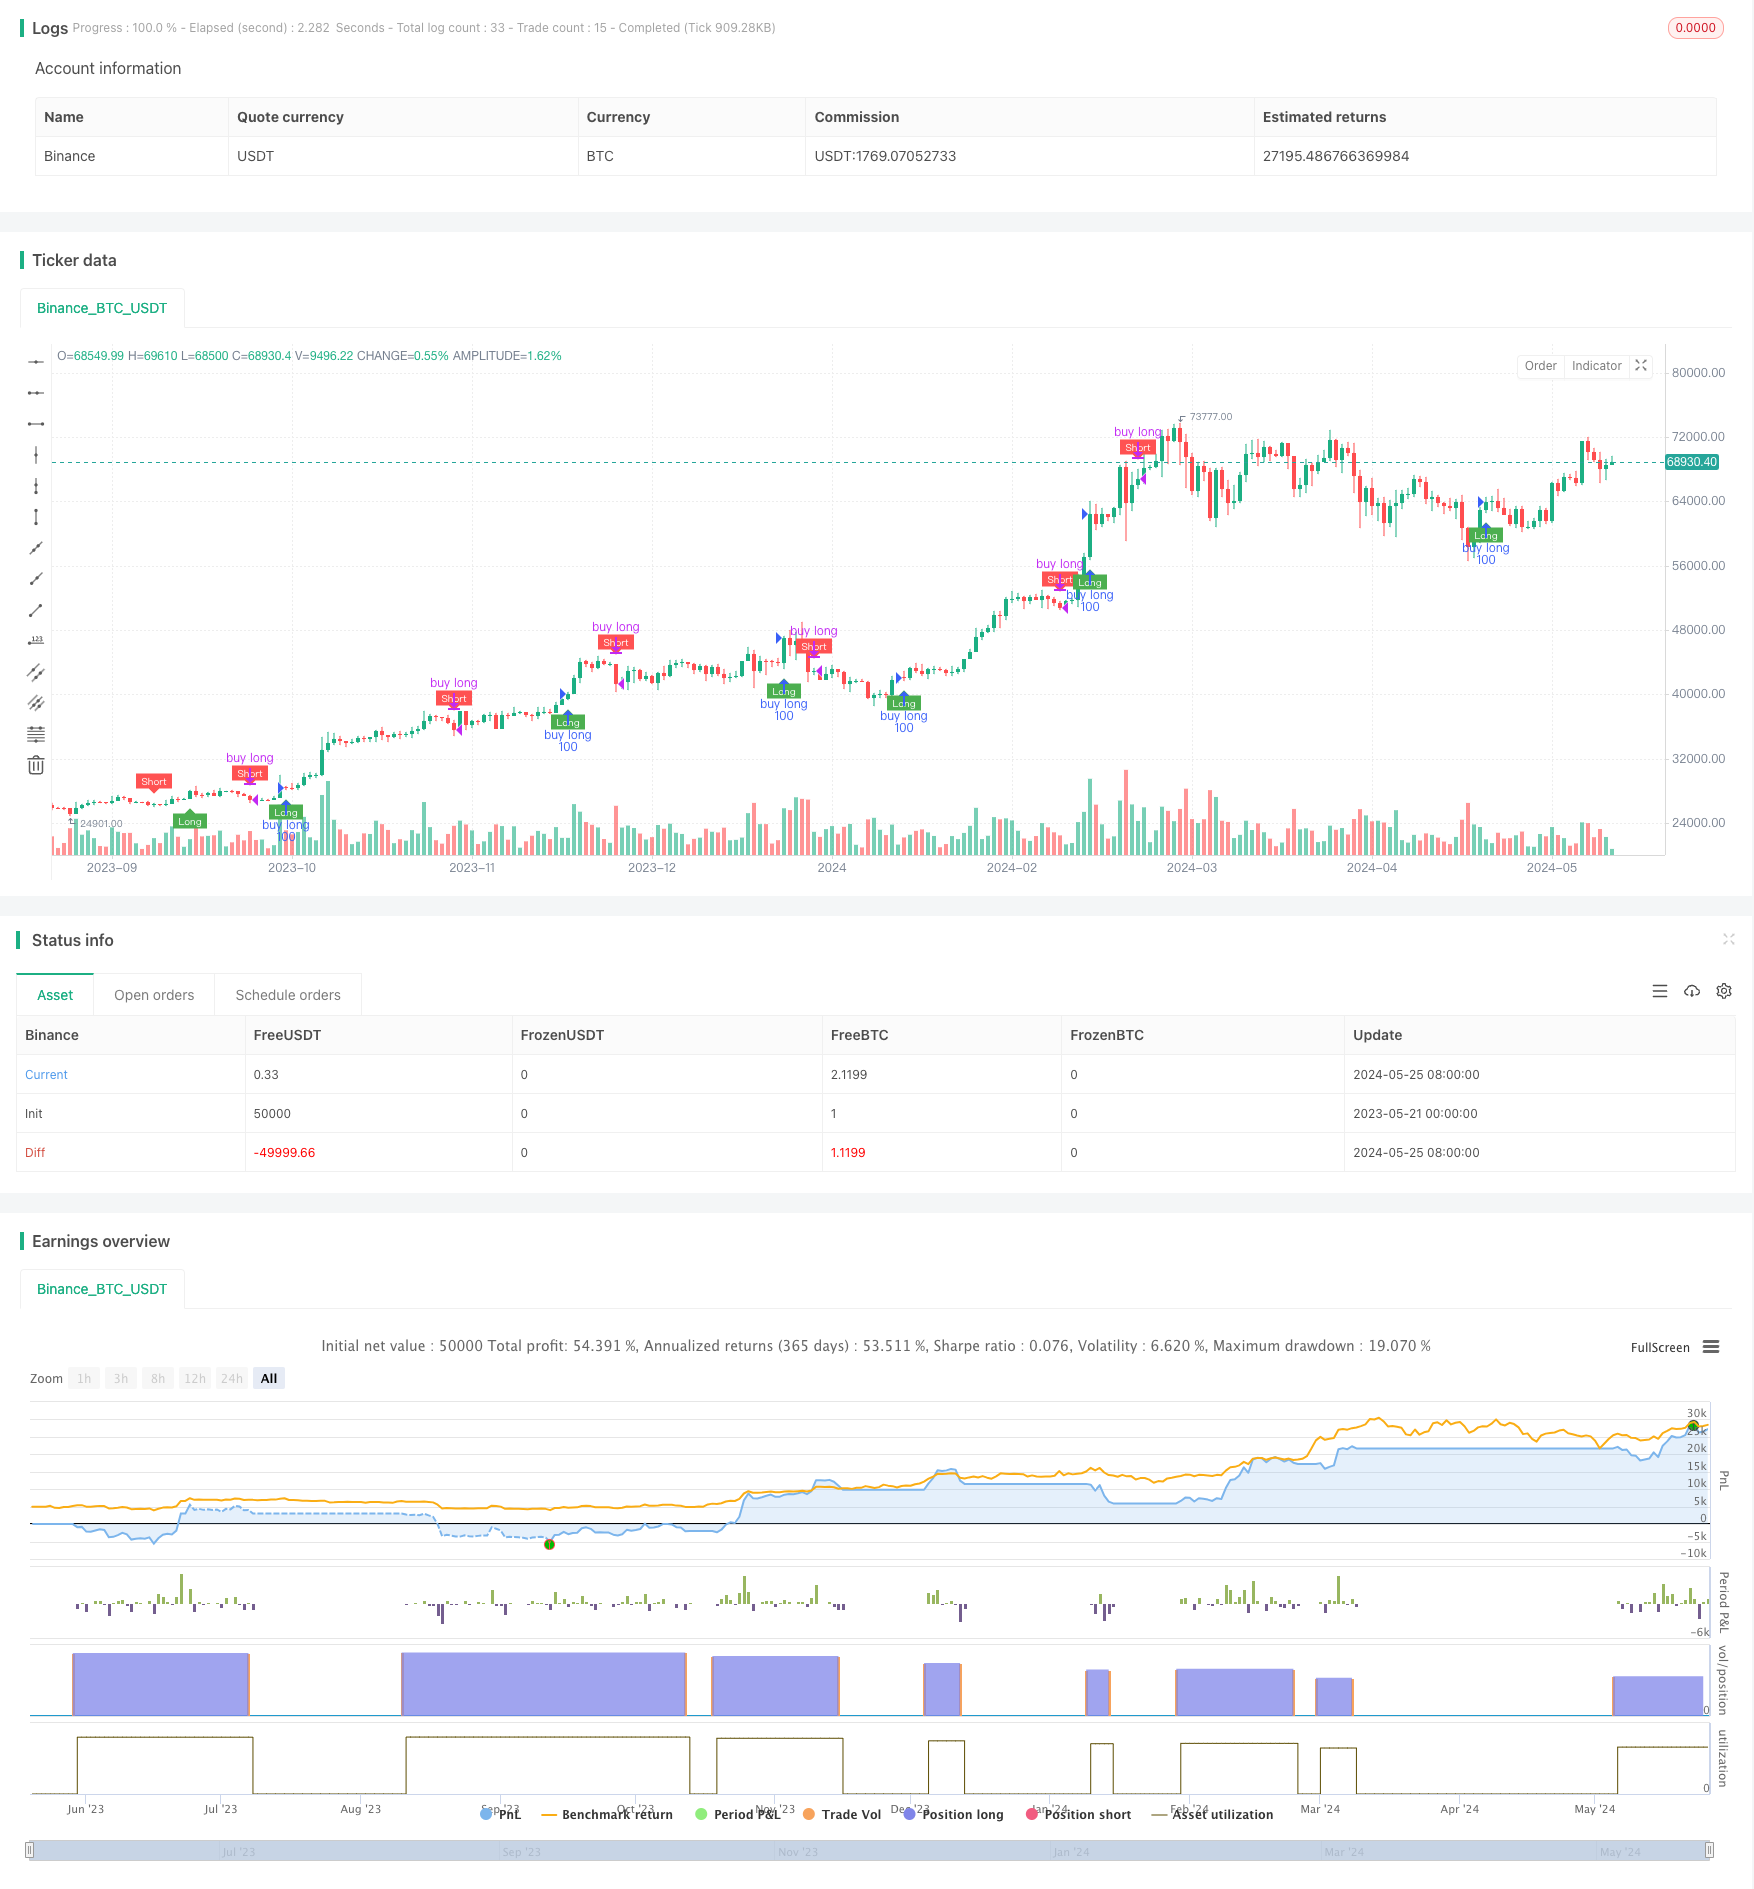
Descripción general
La estrategia se basa en el indicador QQE y el indicador RSI para construir un intervalo de señales con múltiples vacíos mediante el cálculo de las medias móviles lisas y la amplitud de oscilación dinámica del indicador RSI. Cuando el indicador RSI se eleva, se genera una señal con múltiples vacíos y cuando se baja, se genera una señal con vacíos. La idea principal de la estrategia es aprovechar las características de tendencia del indicador RSI y las características de volatilidad del indicador QQE para capturar cambios de tendencia y oportunidades de volatilidad en el mercado.
Principio de estrategia
- Calcula el promedio móvil liso del indicador RSI, RsiMa, como base para juzgar la tendencia.
- Calcula el valor de la desviación absoluta AtrRsi del indicador RSI y su promedio móvil liso MaAtrRsi, como base para juzgar la oscilación.
- La amplitud de oscilación dinámica dar se calcula en función del factor QQE, y se combina con RsiMa para construir una banda larga y una banda corta en el intervalo de señales multiespaciales.
- Para juzgar la relación entre el indicador RSI y el intervalo de señales de vacío, el indicador RSI produce señales de vacío cuando atraviesa la banda larga y produce señales de vacío cuando atraviesa la banda corta.
- La operación se lleva a cabo de acuerdo con la señal de más vacío, se abre la posición para comprar cuando se activa la señal de más vacío y se cierra la posición cuando se activa la señal de vacío.
Ventajas estratégicas
- La combinación de las características de los indicadores RSI y QQE permite capturar mejor las tendencias del mercado y las oportunidades de volatilidad.
- La amplitud de oscilación dinámica se utiliza para construir un rango de señal que se adapta a los cambios en la volatilidad del mercado.
- El tratamiento suave de los indicadores RSI y la amplitud de las fluctuaciones reduce de manera efectiva la interferencia de ruido y el comercio frecuente.
- La lógica es clara, los parámetros son pequeños, lo que permite una mayor optimización y mejora.
Riesgo estratégico
- Esta estrategia puede no funcionar tan bien en mercados convulsivos y con poca volatilidad.
- La ausencia de un mecanismo claro para detener los pérdidas podría suponer un mayor riesgo de retiro en caso de una reversión repentina del mercado.
- La configuración de los parámetros tiene un gran impacto en el rendimiento de la estrategia y requiere ajustes según los diferentes mercados y variedades.
Dirección de optimización de la estrategia
- Introducción de mecanismos de detención de pérdidas claros, como detención de porcentaje fijo, detención de ATR, etc., para controlar el riesgo de retiro.
- Optimización de la configuración de los parámetros, para buscar la combinación óptima de parámetros a través de algoritmos genéticos, búsqueda en la red y otros métodos.
- Considerar la introducción de otros indicadores, como volumen de operaciones, volumen de posiciones, para enriquecer las señales de negociación y mejorar la estabilidad de la estrategia.
- Para los mercados convulsivos, se puede considerar la introducción de la lógica de las operaciones de rango o de la operación de la banda, para aumentar la adaptabilidad de la estrategia.
Resumir
La estrategia se basa en el indicador RSI y el indicador QQE para construir señales de espacio múltiple, con características de captura de tendencias y captura de fluctuaciones. La lógica de la estrategia es clara, tiene pocos parámetros y es adecuada para realizar más optimizaciones y mejoras. Sin embargo, la estrategia también presenta ciertos riesgos, como el control de retirada, la configuración de parámetros, etc.
/*backtest
start: 2023-05-21 00:00:00
end: 2024-05-26 00:00:00
period: 1d
basePeriod: 1h
exchanges: [{"eid":"Binance","currency":"BTC_USDT"}]
*/

//@version=4
// modified by swigle
// thanks colinmck

strategy("QQE signals bot", overlay=true)


RSI_Period = input(14, title='RSI Length')
SF = input(5, title='RSI Smoothing')
QQE = input(4.236, title='Fast QQE Factor')
ThreshHold = input(10, title="Thresh-hold")

src = close
Wilders_Period = RSI_Period * 2 - 1

Rsi = rsi(src, RSI_Period)
RsiMa = ema(Rsi, SF)
AtrRsi = abs(RsiMa[1] - RsiMa)
MaAtrRsi = ema(AtrRsi, Wilders_Period)
dar = ema(MaAtrRsi, Wilders_Period) * QQE

longband = 0.0
shortband = 0.0
trend = 0

DeltaFastAtrRsi = dar
RSIndex = RsiMa
newshortband = RSIndex + DeltaFastAtrRsi
newlongband = RSIndex - DeltaFastAtrRsi
longband := RSIndex[1] > longband[1] and RSIndex > longband[1] ? max(longband[1], newlongband) : newlongband
shortband := RSIndex[1] < shortband[1] and RSIndex < shortband[1] ? min(shortband[1], newshortband) : newshortband
cross_1 = cross(longband[1], RSIndex)
trend := cross(RSIndex, shortband[1]) ? 1 : cross_1 ? -1 : nz(trend[1], 1)
FastAtrRsiTL = trend == 1 ? longband : shortband

// Find all the QQE Crosses

QQExlong = 0
QQExlong := nz(QQExlong[1])
QQExshort = 0
QQExshort := nz(QQExshort[1])
QQExlong := FastAtrRsiTL < RSIndex ? QQExlong + 1 : 0
QQExshort := FastAtrRsiTL > RSIndex ? QQExshort + 1 : 0

//Conditions

qqeLong = QQExlong == 1 ? FastAtrRsiTL[1] - 50 : na
qqeShort = QQExshort == 1 ? FastAtrRsiTL[1] - 50 : na

// Plotting

plotshape(qqeLong, title="QQE long", text="Long", textcolor=color.white, style=shape.labelup, location=location.belowbar, color=color.green, size=size.tiny)
plotshape(qqeShort, title="QQE short", text="Short", textcolor=color.white, style=shape.labeldown, location=location.abovebar, color=color.red, size=size.tiny)

// trade

//if qqeLong > 0
strategy.entry("buy long", strategy.long, 100, when=qqeLong)

if qqeShort > 0
    strategy.close("buy long")
    // strategy.exit("close_position", "buy long", loss=1000)
    // strategy.entry("sell", strategy.short, 1, when=strategy.position_size > 0)