Auteur:ChaoZhang est là., Date: 2024-01-25 12:54:16 Je suis désolé
Les étiquettes:
Les étiquettes:

Résumé
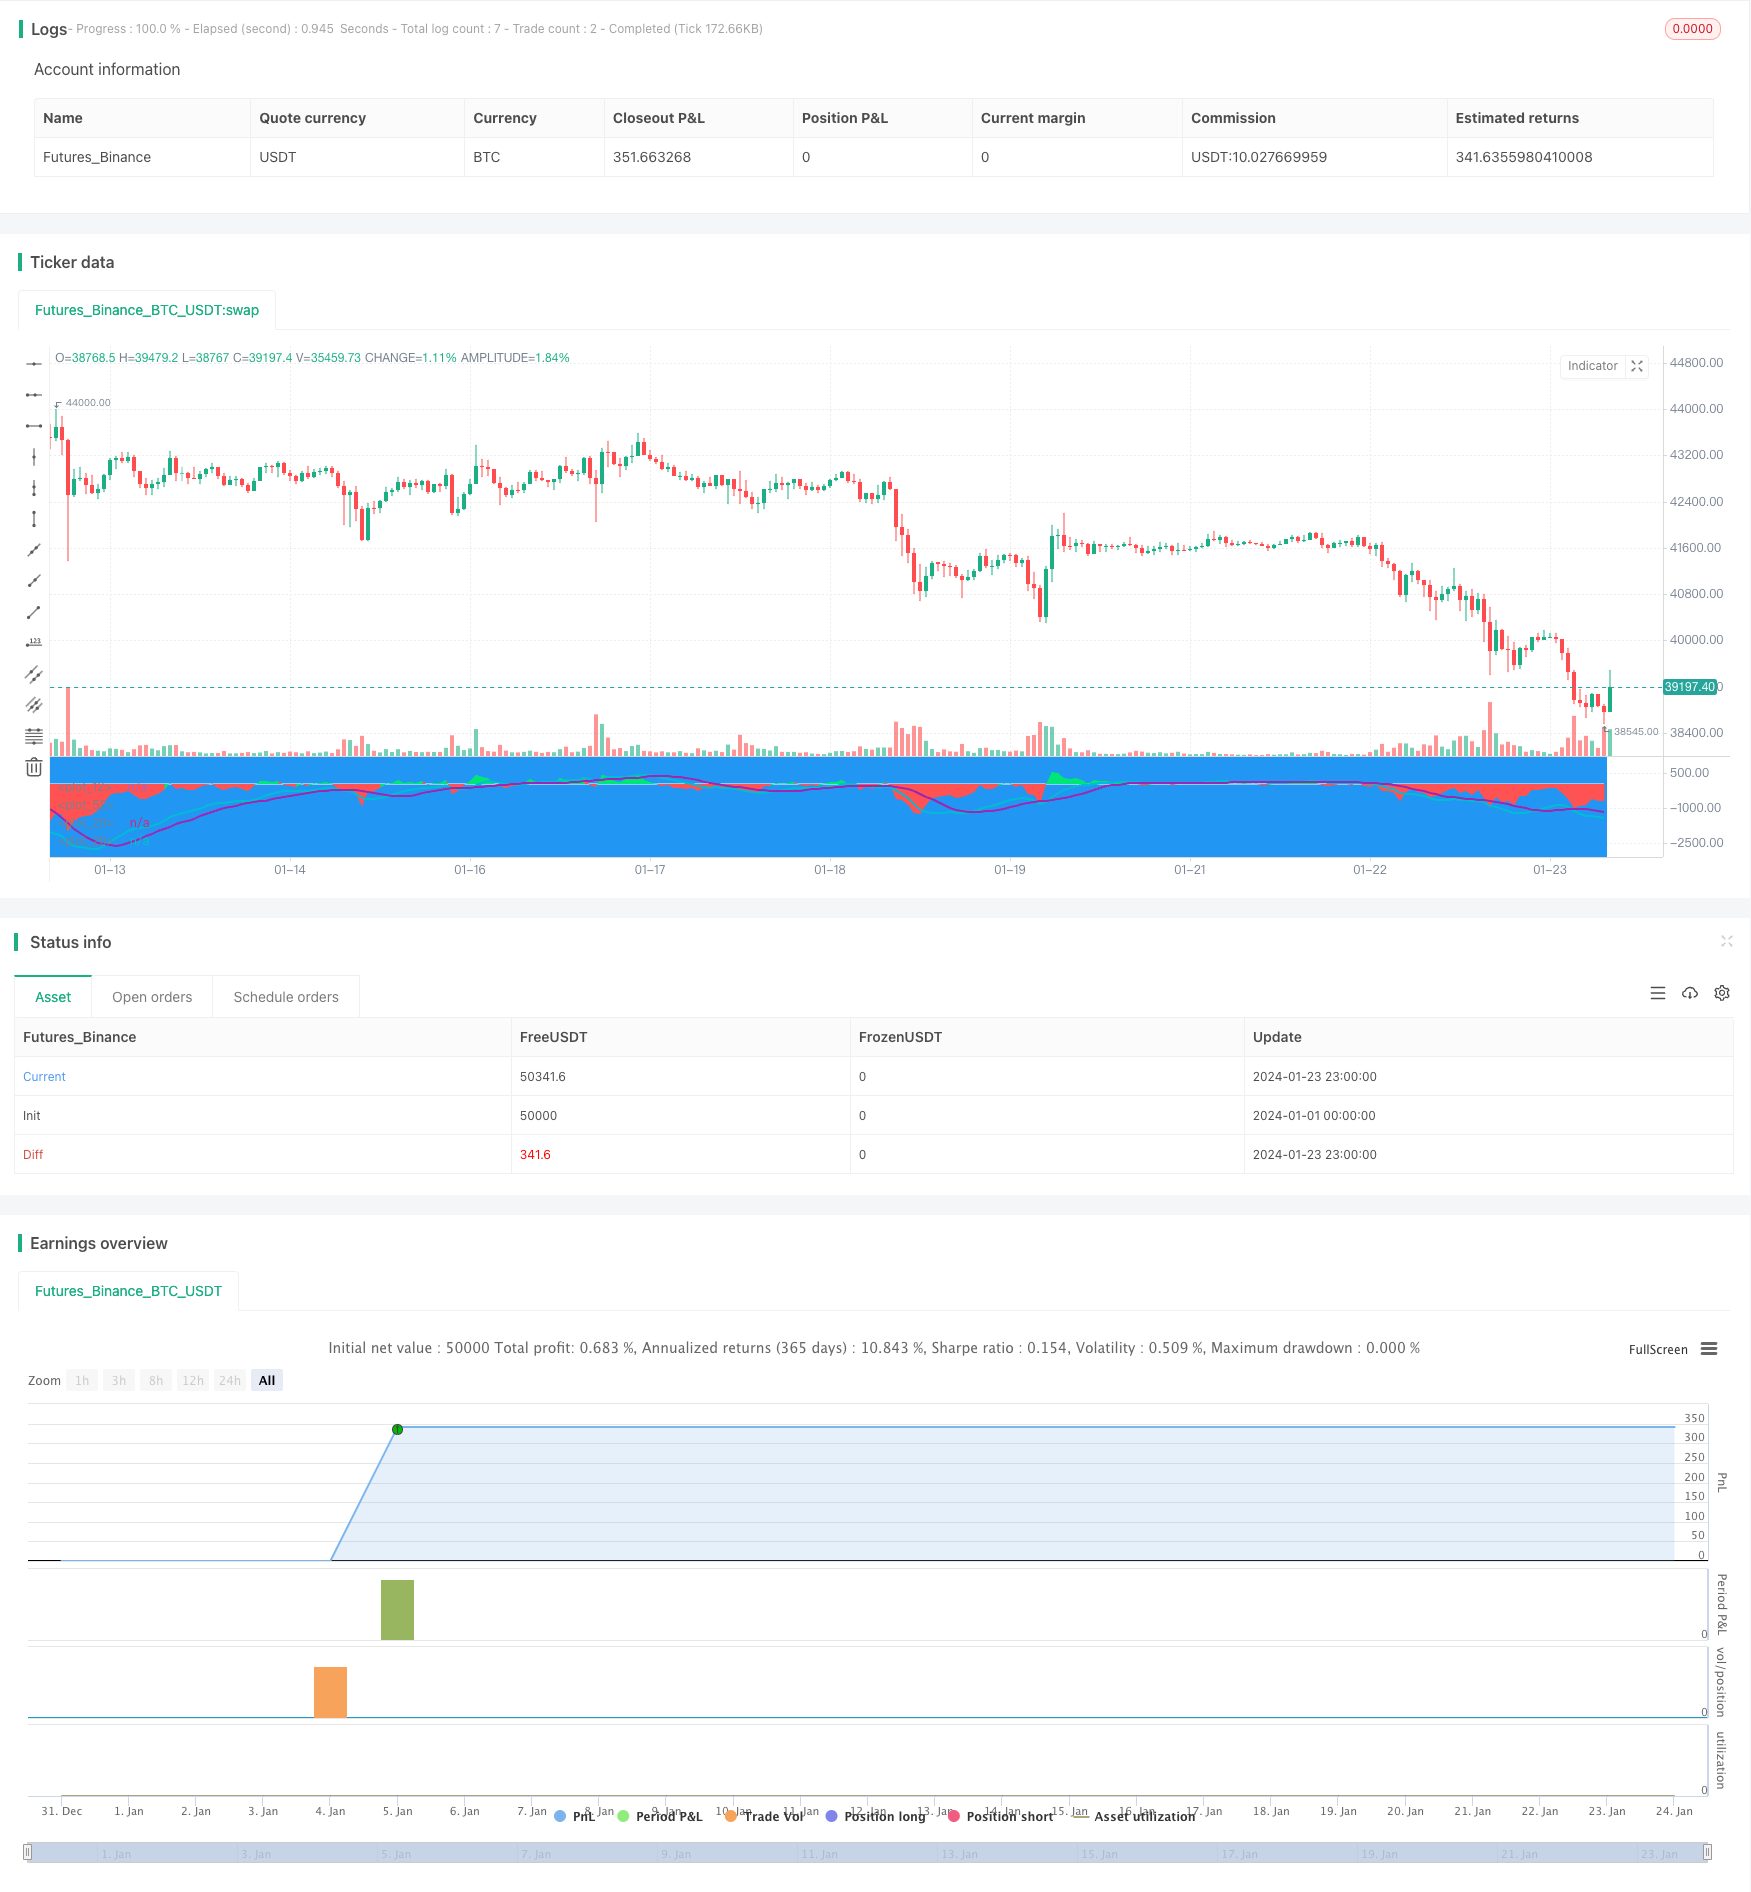
Cette stratégie est une stratégie composite basée sur la différence EMA et l'indicateur MACD pour le trading à court terme de BTC. Elle combine les signaux de l'EMA et du MACD pour générer des signaux d'achat et de vente dans certaines conditions.
La logique de la stratégie
Il génère des signaux d'achat lorsque la différence est négative et inférieure à un seuil et que le MACD a un croisement baissier.
En combinant les signaux de la différence EMA et du MACD, certains faux signaux peuvent être filtrés et la fiabilité des signaux est améliorée.
Analyse des avantages
- Utilise des indicateurs composites, des signaux plus fiables
- Adopte des paramètres à court terme, adaptés aux transactions à court terme
- A des paramètres de stop loss et de profit pour contrôler les risques
Analyse des risques
- Le stop loss peut être rompu lors d'importantes fluctuations du marché
- Les paramètres doivent être optimisés pour différents environnements de marché
- Les effets doivent être testés sur différentes pièces et bourses
Directions d'optimisation
- Optimiser les paramètres EMA et MACD pour s'adapter à la volatilité des BTC
- Ajouter des stratégies de dimensionnement des positions et de pyramide pour améliorer l'efficacité du capital
- Ajouter des méthodes de stop loss comme le stop loss de suivi pour réduire les risques
Conclusion
/*backtest
start: 2024-01-01 00:00:00
end: 2024-01-24 00:00:00
period: 1h
basePeriod: 15m
exchanges: [{"eid":"Futures_Binance","currency":"BTC_USDT"}]
*/

//@version=3
strategy("EMA50Diff & MACD Strategy", overlay=false)
EMA = input(18, step=1)
MACDfast = input(12)
MACDslow = input(26)
EMADiffThreshold = input(8)
MACDThreshold = input(80)
TargetValidityThreshold = input(65, step=5)
Target = input(120, step=5)
StopLoss = input(650, step=5)
ema = ema(close, EMA)
hl = plot(0, color=white, linewidth=1)
diff = close - ema
clr = color(blue, transp=100)
if diff>0
    clr := lime
else
    if diff<0
        clr := red

fastMA = ema(close, MACDfast)
slowMA = ema(close, MACDslow)
macd = (fastMA - slowMA)*3
signal = sma(macd, 9)
plot(macd, color=aqua, linewidth=2)
plot(signal, color=purple, linewidth=2)

macdlong = macd<-MACDThreshold and signal<-MACDThreshold and crossover(macd, signal)
macdshort = macd>MACDThreshold and signal>MACDThreshold and crossunder(macd, signal)
position = 0.0
position := nz(strategy.position_size, 0.0)
long = (position < 0 and close < strategy.position_avg_price - TargetValidityThreshold and macdlong) or
     (position == 0.0 and diff < -EMADiffThreshold and diff > diff[1] and diff[1] < diff[2] and macdlong)

short = (position > 0 and close > strategy.position_avg_price + TargetValidityThreshold and macdshort) or
      (position == 0.0 and diff > EMADiffThreshold and diff < diff[1] and diff[1] > diff[2] and macdshort)
amount = (strategy.equity / close) //- ((strategy.equity / close / 10)%10)
bgclr = color(blue, transp=100) //#0c0c0c
if long
    strategy.entry("long", strategy.long, amount)
    bgclr := green
if short
    strategy.entry("short", strategy.short, amount)
    bgclr := maroon
bgcolor(bgclr, transp=20)
strategy.close("long", when=close>strategy.position_avg_price + Target)
strategy.close("short", when=close<strategy.position_avg_price - Target)
strategy.exit("STOPLOSS", "long", stop=strategy.position_avg_price - StopLoss)
strategy.exit("STOPLOSS", "short", stop=strategy.position_avg_price + StopLoss)
//plotshape(long, style=shape.labelup, location=location.bottom, color=green)
//plotshape(short, style=shape.labeldown, location=location.top, color=red)
pl = plot(diff, style=histogram, color=clr)
fill(hl, pl, color=clr)
Plus de
- Cette stratégie prend des décisions de trading basées sur la tendance de l'histogramme MACD
- L'oscillateur de dynamique et la stratégie de modèle 123
- Stratégie de contre-test basée sur l'indicateur de transformation de Fisher
- Stratégie de négociation de la moyenne mobile du spectre d'oscillation
- Stratégie de négociation d'inversion basée sur une fourchette de moyenne mobile
- Stratégie de suivi des tendances basée sur le filtre Kalman
- Stratégie de négociation intertemporelle de renversement saisonnier
- Stratégie de négociation algorithmique croisée de moyenne mobile à double exponentiel
- Stratégie pour trouver un élan
- Stratégie d'inversion de la barre de broche perforante
- Stratégie de négociation Nifty basée sur l'indicateur RSI
- Suivre la stratégie de tendance basée sur l'indice de volatilité et l'EMA
- Stratégie de suivi de la confirmation des tendances
- La stratégie de l'indicateur de divergence des IRS
- Stratégie de consolidation de la moyenne mobile dynamique
- Stratégie de négociation croisée rapide QQE basée sur le filtre de tendance