N Bars stratégie de rupture
Auteur:ChaoZhang est là., Date: 12 avril 2024 à 16 h 57 min 15 sLes étiquettes:

Résumé
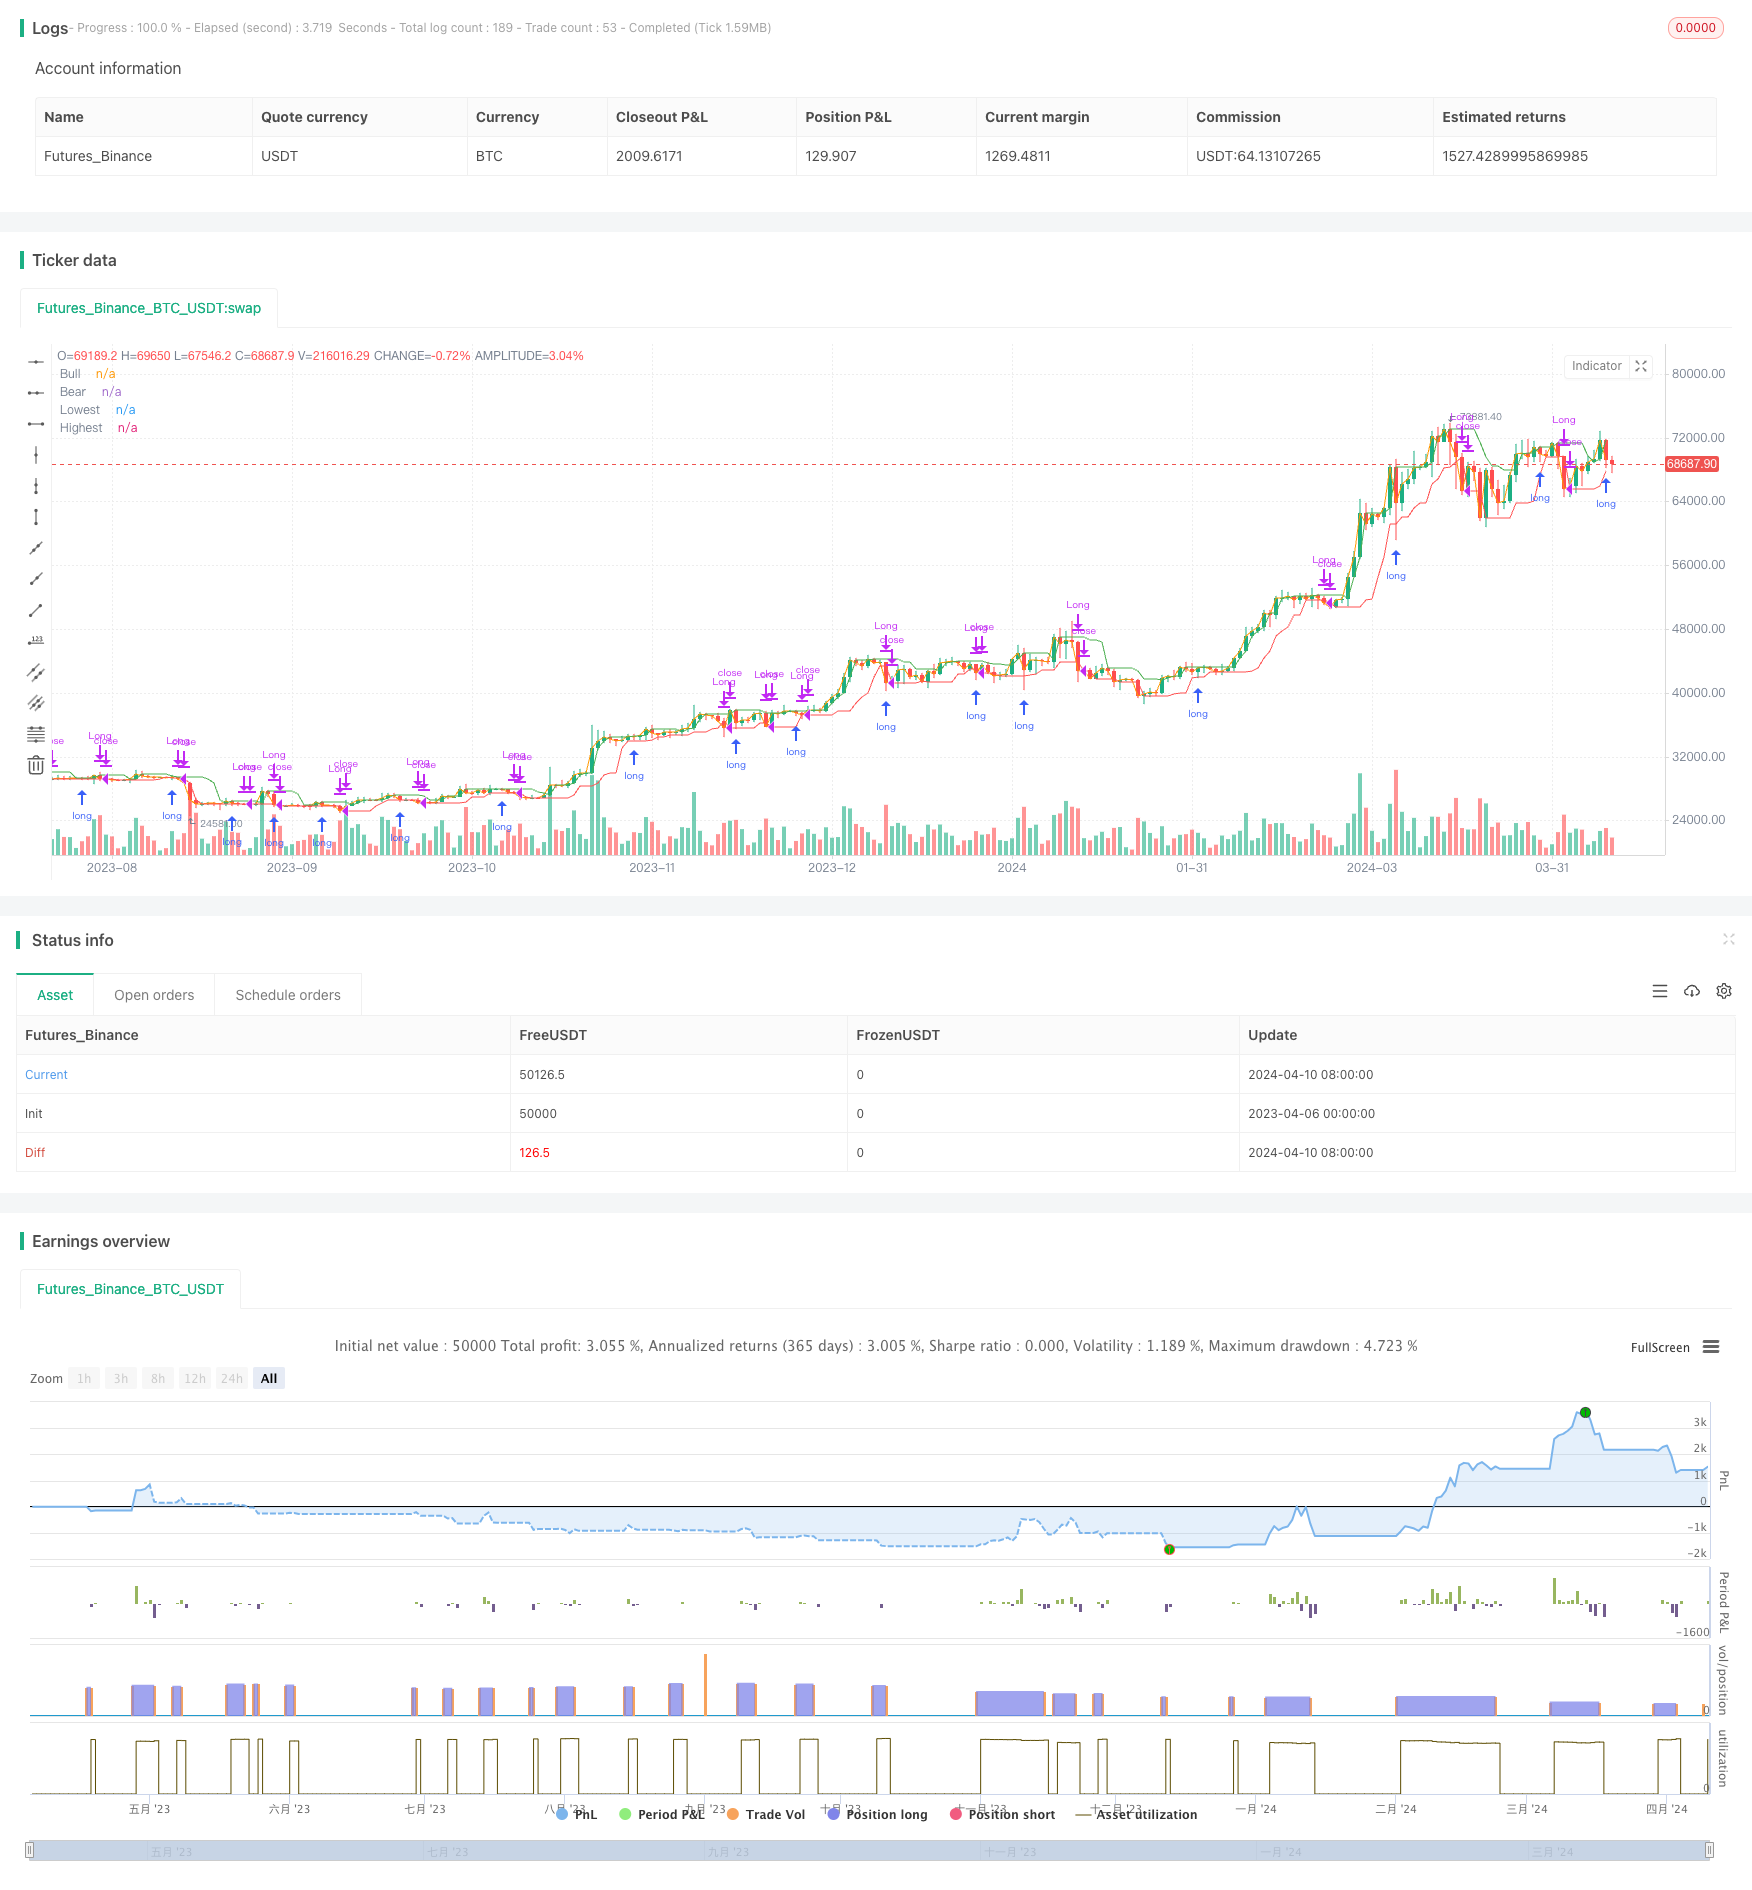
La stratégie N Bars Breakout est une stratégie de trading quantitative basée sur les ruptures de prix. L'idée principale de cette stratégie est d'ouvrir une position longue lorsque le prix de clôture dépasse le plus haut des N bars passés, et de fermer la position longue lorsque le prix de clôture dépasse le plus bas des N bars passés. En comparant le prix actuel avec les prix les plus élevés et les plus bas des N bars passés, cette stratégie vise à capturer les mouvements de rupture forts et à atteindre l'effet de suivi de tendance.
Principe de stratégie
- Calculer le plus haut (plus haut) et le plus bas (plus bas) des N barres passées.
- Si le prix de clôture actuel est supérieur au prix le plus élevé, ouvrir une position longue (long).
- Si le prix de clôture actuel est inférieur au plus bas, la position longue (short) est fermée.
- Vous pouvez choisir d'utiliser le prix de clôture (close) ou le prix haut/bas (high/low) comme source de signal.
- En fonction de la source de signal, utiliser ta.highest et ta.lowest pour calculer les prix les plus élevés et les plus bas.
- Utilisez ta.crossover et ta.crossunder pour déterminer les écarts de prix.
Les avantages de la stratégie
- Une logique simple et claire, facile à mettre en œuvre et à optimiser.
- Peut capturer efficacement les mouvements de rupture forts, avec une forte capacité de suivi des tendances.
- Une large marge d'optimisation des paramètres, peut être optimisée pour différents instruments et délais.
- Large application, fonctionne bien pour la plupart des instruments et des délais.
- Le choix flexible de la source de signal améliore l'adaptabilité de la stratégie.
Risques stratégiques
- Performe mal sur des marchés instables et à faibles fluctuations, avec des ouvertures et fermetures fréquentes de positions entraînant des coûts de transaction élevés.
- Une mauvaise sélection des paramètres peut entraîner un risque de surajustement.
- Il peut y avoir des retombées importantes lors d'inversions de tendance.
- Une seule source de signal peut présenter un risque de distorsion du signal.
Directions d'optimisation de la stratégie
- Ajouter des conditions de filtrage des tendances, telles que la direction de la tendance MA, ADX, etc., pour réduire les transactions sur les marchés agités.
- Optimiser la sélection des paramètres, tels que la valeur N, la source de signal, etc., pour améliorer la stabilité et la rentabilité de la stratégie.
- Ajouter une logique de stop-loss et de trailing stop-loss pour contrôler le risque de transaction unique.
- Combiner plusieurs sources de signaux pour améliorer la fiabilité du signal, par exemple en tenant compte à la fois du prix de clôture et des écarts de prix élevés/faibles.
- Optimiser les paramètres et la logique séparément pour différents instruments et délais.
Résumé
La stratégie N Bars Breakout est une stratégie de trading quantitative simple et pratique qui permet d'obtenir de bons effets de suivi de tendance en capturant les ruptures de prix.
/*backtest
start: 2023-04-06 00:00:00
end: 2024-04-11 00:00:00
period: 1d
basePeriod: 1h
exchanges: [{"eid":"Futures_Binance","currency":"BTC_USDT"}]
*/

//@version=5
strategy("Breakout", overlay=true, precision=6, pyramiding=0, initial_capital=1000, default_qty_type=strategy.percent_of_equity, default_qty_value=25.0, commission_value=0.05)

n = input.int(5, "N Bars", minval=1)
src_input = input.string("Close", "Source", ["Close", "High/Low"])

bull_src = switch src_input
	"Close" => close
	"High/Low" => high
	=>
		runtime.error("Invalid source input")
		na

bear_src = switch src_input
	"Close" => close
	"High/Low" => low
	=>
		runtime.error("Invalid source input")
		na

highest = ta.highest(bull_src[1], n)
lowest = ta.lowest(bear_src[1], n)

//-----------------------------------------------------------------------------------------------------------------------------------------------------------------
// Plots
//-----------------------------------------------------------------------------------------------------------------------------------------------------------------

bool long = ta.crossover(bull_src, highest)
bool short = ta.crossunder(bear_src, lowest)

//Plots
lowest_plot  = plot(lowest,  color=color.red, title="Lowest")
highest_plot  = plot(highest,  color=color.green, title="Highest")
bull_src_plot = plot(bull_src, color=color.blue, title="Bull")
bear_src_plot = plot(bear_src, color=color.orange, title="Bear")

// this message is an alert that can be sent to a webhook, which allows for simple automation if you have a server that listens to alerts and trades programmatically.
enter_long_alert = '{"side": "Long", "order": "Enter", "price": ' + str.tostring(open) + ', "timestamp": ' + str.tostring(timenow) + '}'
exit_long_alert = '{"side": "Long", "order": "Exit", "price": ' + str.tostring(open) + ', "timestamp": ' + str.tostring(timenow) + '}'

if long
    strategy.entry(id="Long", direction=strategy.long, limit=open, alert_message=enter_long_alert)

if short
    strategy.close(id="Long", comment="Close Long", alert_message=exit_long_alert)
Plus de
- Stratégie courte longue du MACD ZeroLag
- BBSR Stratégie extrême
- Stratégie de négociation à inversion à haute fréquence basée sur l'indicateur de dynamique RSI
- Stratégie de l'indice de résistance relative de l'indice RSI
- Stratégie de rupture des bandes de Bollinger
- Donchian Channel et Larry Williams Stratégie du grand indice du commerce
- SPARK Taille dynamique des positions et stratégie de négociation à double indicateur
- La moyenne mobile croisée + la stratégie de dynamique de la ligne lente du MACD
- Stratégie dynamique de DCA basée sur le volume
- Stratégie du détecteur de vallée MACD
- Stratégie de négociation à haute fréquence de crypto-monnaie stable à faible risque basée sur le RSI et le MACD
- Stratégie de signaux extrêmes pour les bandes de Bollinger
- RSI Stratégie de négociation à double face
- KRK ADA 1H Stratégie stochastique lente avec plus d'entrées et d'IA
- Stratégie de négociation dynamique basée sur le volume MA et sur la pyramide adaptative
- Stratégie de croisement MACD TEMA
- RSI et double stratégie des bandes de Bollinger
- VWMA-ADX Momentum et stratégie longue Bitcoin basée sur la tendance
- Tendance multi-indicateur à la suite d'une stratégie dynamique de gestion des risques
- La stratégie de négociation de la tendance Ruda Momentum