SPARK动态仓位与双重指标交易策略
Author: ChaoZhang, Date: 2024-04-12 17:22:47Tags: supertrendRSIATR

概述
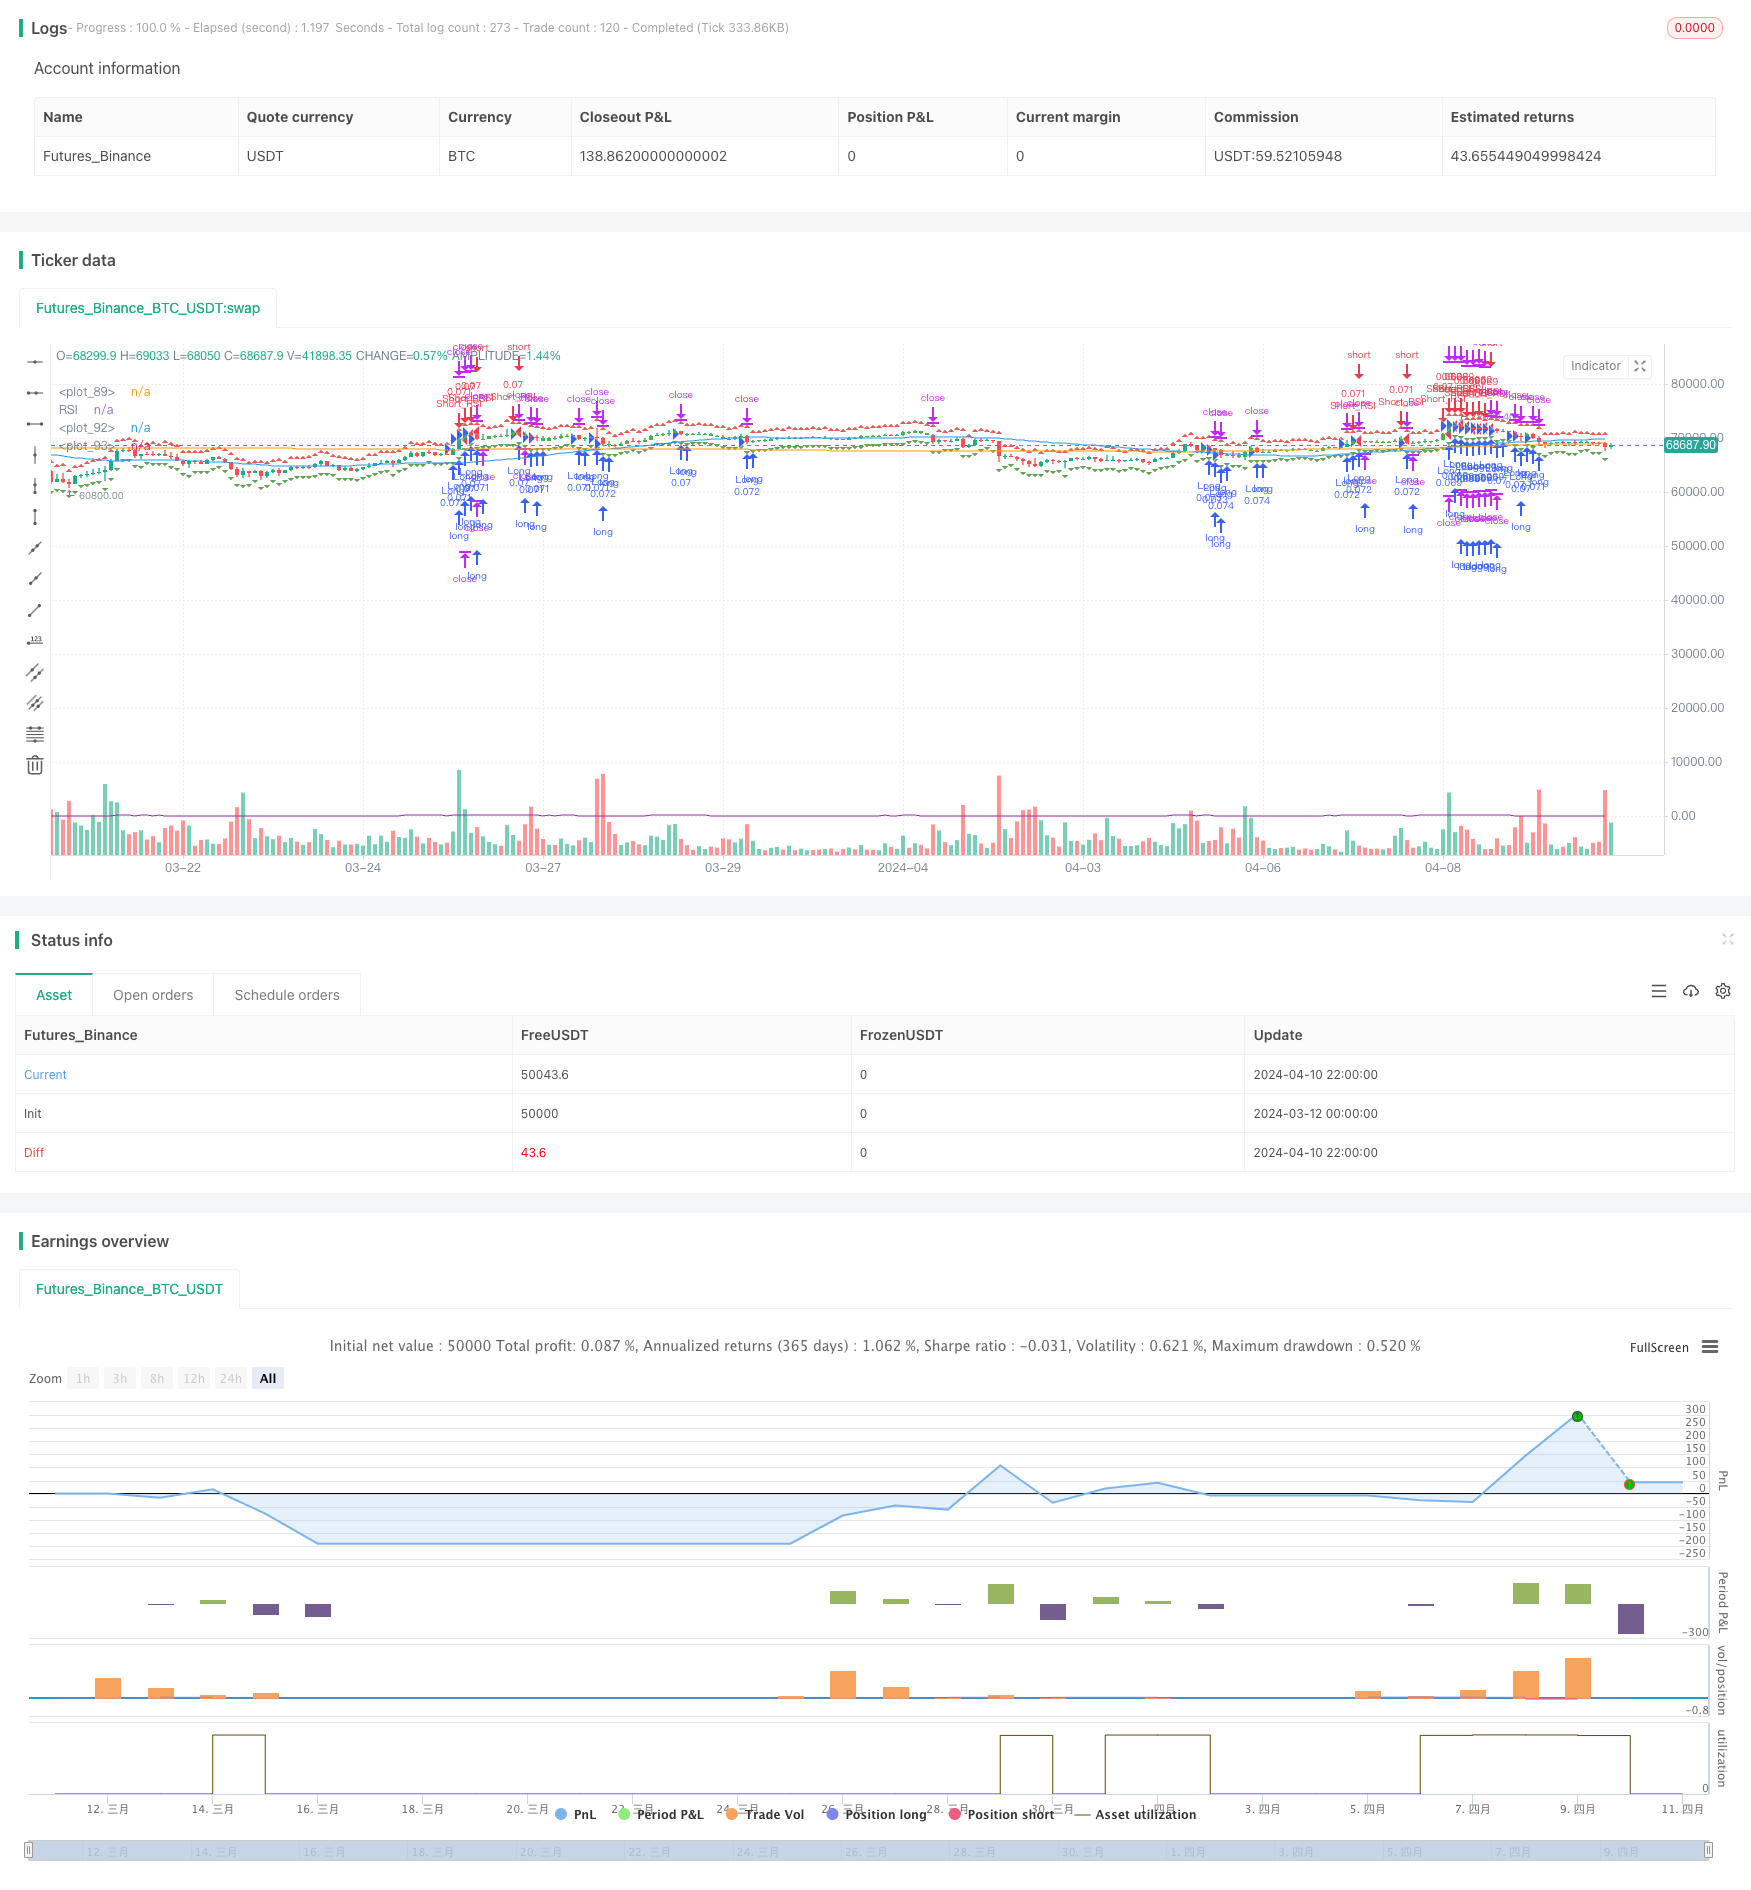
SPARK策略是一个结合动态仓位调整和双重指标确认的量化交易策略。该策略利用SuperTrend指标和相对强弱指数(RSI)来识别潜在的进场和出场点,同时使用动态仓位调整机制来优化资金分配。策略还提供了灵活的止盈止损设置,以及最小交易频率控制和方向性偏好选择等自定义参数。
策略原理
SPARK策略的核心是SuperTrend指标和RSI指标的结合应用。SuperTrend指标通过比较收盘价与动态支撑阻力位置关系来判断趋势方向,而RSI指标则用于识别市场超买超卖状态。当SuperTrend和RSI指标同时满足特定条件时,策略将发出进场信号。
策略使用动态仓位调整机制来优化每笔交易的资金分配。通过设置投资组合百分比和杠杆率,策略可以根据当前市场状况和账户余额自动计算最佳仓位大小。此外,策略还提供了灵活的止盈止损设置,可以选择固定百分比或动态计算方式。
策略优势
- 双重指标确认:通过结合SuperTrend和RSI两个指标,SPARK策略可以更准确地识别潜在的进场和出场点,减少误判的可能性。
- 动态仓位调整:策略采用动态仓位调整机制,可以根据投资组合百分比和杠杆率自动优化每笔交易的资金分配,提高资金利用效率。
- 灵活的风险管理:策略提供了灵活的止盈止损设置,可以根据个人风险偏好选择固定百分比或动态计算方式,实现精确的风险控制。
- 自定义参数:策略允许用户调整多个输入参数,如ATR长度、乘数、RSI阈值等,以适应不同的市场条件和交易偏好。
策略风险
- 市场风险:尽管SPARK策略采用了双重指标确认和动态仓位调整机制,但在极端市场条件下仍可能面临损失风险。
- 参数优化风险:策略的性能在很大程度上取决于输入参数的选择。不恰当的参数设置可能导致策略表现不佳。
- 过拟合风险:如果策略参数过度优化,可能导致策略在未来市场条件下表现不佳。
策略优化方向
- 引入更多指标:考虑引入其他技术指标,如MACD、布林带等,以进一步提高信号确认的准确性。
- 优化止盈止损机制:探索更高级的止盈止损策略,如移动止损、动态止盈等,以更好地保护利润和限制损失。
- 自适应参数调整:开发自适应机制,根据市场状况动态调整策略参数,以适应不断变化的市场环境。
总结
SPARK策略通过结合SuperTrend和RSI指标,并采用动态仓位调整机制和灵活的风险管理工具,为交易者提供了一个全面的量化交易解决方案。尽管策略可能面临一些风险,但通过不断优化和改进,SPARK策略有望在各种市场条件下实现稳定的性能。
/*backtest
start: 2024-03-12 00:00:00
end: 2024-04-11 00:00:00
period: 2h
basePeriod: 15m
exchanges: [{"eid":"Futures_Binance","currency":"BTC_USDT"}]
*/

//@version=4
strategy("SPARK", shorttitle="SPARK", overlay=true)

// Choose whether to activate the minimal bars in trade feature
minBarsEnabled = input(true, title="Activate Minimal Bars in Trade")
portfolioPercentage = input(10, title="Portfolio Percentage", minval=1, maxval=100)
// Leverage Input
leverage = input(1, title="Leverage", minval=1)

// Calculate position size according to portfolio percentage and leverage
positionSizePercent = portfolioPercentage / 100 * leverage
positionSize = (strategy.initial_capital / close) * positionSizePercent

// Take Profit and Stop Loss settings
useFixedTPSL = input(1, title="Use Fixed TP/SL", options=[1, 0])
tp_sl_step = 0.1
fixedTP = input(2.0, title="Fixed Take Profit (%)", step=tp_sl_step)
fixedSL = input(1.0, title="Fixed Stop Loss (%)", step=tp_sl_step)

// Calculate Take Profit and Stop Loss Levels
takeProfitLong = close * (1 + fixedTP / 100)
takeProfitShort = close * (1 - fixedTP / 100)
stopLossLong = close * (1 - fixedSL / 100)
stopLossShort = close * (1 + fixedSL / 100)

// Plot TP and SL levels on the chart
plotshape(series=takeProfitLong, title="Take Profit Long", color=color.green, style=shape.triangleup, location=location.abovebar)
plotshape(series=takeProfitShort, title="Take Profit Short", color=color.red, style=shape.triangledown, location=location.belowbar)
plotshape(series=stopLossLong, title="Stop Loss Long", color=color.red, style=shape.triangleup, location=location.abovebar)
plotshape(series=stopLossShort, title="Stop Loss Short", color=color.green, style=shape.triangledown, location=location.belowbar)

// Minimum Bars Between Trades Input
minBarsBetweenTrades = input(5, title="Minimum Bars Between Trades")

// Inputs for selecting trading direction
tradingDirection = input("Both", "Choose Trading Direction", options=["Long", "Short", "Both"])

// SuperTrend Function
trendFlow(src, atrLength, multiplier) =>
    atr = atr(atrLength)
    up = hl2 - (multiplier * atr)
    dn = hl2 + (multiplier * atr)
    trend = 1
    trend := nz(trend[1], 1)
    up := src > nz(up[1], 0) and src[1] > nz(up[1], 0) ? max(up, nz(up[1], 0)) : up
    dn := src < nz(dn[1], 0) and src[1] < nz(dn[1], 0) ? min(dn, nz(dn[1], 0)) : dn
    trend := src > nz(dn[1], 0) ? 1 : src < nz(up[1], 0)? -1 : nz(trend[1], 1)
    [up, dn, trend]

// Inputs for SuperTrend settings
atrLength1 = input(7, title="ATR Length for Trend 1")
multiplier1 = input(4.0, title="Multiplier for Trend 1")
atrLength2 = input(14, title="ATR Length for Trend 2")
multiplier2 = input(3.618, title="Multiplier for Trend 2")
atrLength3 = input(21, title="ATR Length for Trend 3")
multiplier3 = input(3.5, title="Multiplier for Trend 3")
atrLength4 = input(28, title="ATR Length for Trend 4")
multiplier4 = input(3.382, title="Multiplier for Trend 4")

// Calculate SuperTrend
[up1, dn1, trend1] = trendFlow(close, atrLength1, multiplier1)
[up2, dn2, trend2] = trendFlow(close, atrLength2, multiplier2)
[up3, dn3, trend3] = trendFlow(close, atrLength3, multiplier3)
[up4, dn4, trend4] = trendFlow(close, atrLength4, multiplier4)

// Entry Conditions based on SuperTrend and Elliott Wave-like patterns
longCondition = trend1 == 1 and trend2 == 1 and trend3 == 1 and trend4 == 1
shortCondition = trend1 == -1 and trend2 == -1 and trend3 == -1 and trend4 == -1

// Calculate bars since last trade
barsSinceLastTrade = barssince(tradingDirection == "Long" ? longCondition : shortCondition)

// Strategy Entry logic based on selected trading direction and minimum bars between trades
if tradingDirection == "Long" or tradingDirection == "Both"
    if longCondition and (not minBarsEnabled or barsSinceLastTrade >= minBarsBetweenTrades)
        strategy.entry("Long", strategy.long, qty=positionSize)
        strategy.exit("TP/SL Long", from_entry="Long", stop=stopLossLong, limit=takeProfitLong)

if tradingDirection == "Short" or tradingDirection == "Both"
    if shortCondition and (not minBarsEnabled or barsSinceLastTrade >= minBarsBetweenTrades)
        strategy.entry("Short", strategy.short, qty=positionSize)
        strategy.exit("TP/SL Short", from_entry="Short", stop=stopLossShort, limit=takeProfitShort)

// Color bars based on position
var color barColor = na
barColor := strategy.position_size > 0 ? color.green : strategy.position_size < 0 ? color.red : na

// Plot colored bars
plotcandle(open, high, low, close, color=barColor)

// Plot moving averages
plot(sma(close, 50), color=color.blue)
plot(sma(close, 200), color=color.orange)

// More customizable trading bot - adding a new indicator
// This indicator is the RSI (Relative Strength Index)

// RSI Inputs
rsi_length = input(14, title="RSI Length")
rsi_oversold = input(30, title="RSI Oversold")
rsi_overbought = input(70, title="RSI Overbought")

// Calculate RSI
rsi = rsi(close, rsi_length)

// Plot RSI
plot(rsi, color=color.purple, title="RSI")

// Entry Conditions based on RSI
rsi_long_condition = rsi < rsi_oversold
rsi_short_condition = rsi > rsi_overbought

// Strategy Entry logic based on RSI
if tradingDirection == "Long" or tradingDirection == "Both"
    if rsi_long_condition and (not minBarsEnabled or barsSinceLastTrade >= minBarsBetweenTrades)
        strategy.entry("Long_RSI", strategy.long, qty=positionSize)
        strategy.exit("TP/SL Long_RSI", from_entry="Long_RSI", stop=stopLossLong, limit=takeProfitLong)

if tradingDirection == "Short" or tradingDirection == "Both"
    if rsi_short_condition and (not minBarsEnabled or barsSinceLastTrade >= minBarsBetweenTrades)
        strategy.entry("Short_RSI", strategy.short, qty=positionSize)
        strategy.exit("TP/SL Short_RSI", from_entry="Short_RSI", stop=stopLossShort, limit=takeProfitShort)
相关内容
- 多重指标智能金字塔策略
- 多指标组合趋势跟踪策略
- 基于ATR止损和交易区间控制的RSI趋势反转交易策略
- 双时间周期超级趋势与RSI策略优化系统
- RSI趋势反转策略
- 双时间周期超趋势RSI智能交易策略
- RSI-ATR动量波动组合交易策略
- 周二反转策略(周末过滤)
- RSI-布林通道整合策略:动态自适应的多指标交易系统
- 多层级动态趋势跟随系统
更多内容
- MACD BB 波段突破策略
- Wavetrend 大幅指标超跌反弹网格交易策略
- MACD 交叉策略
- 基于MACD信号线交叉与ATR风险管理的优化趋势跟踪策略
- ZeroLag MACD 多空策略
- Bollinger Bands Stochastic RSI Extreme Strategy
- 基于动量RSI指标的高频反转交易策略
- RSI 相对强弱指数策略
- 布林线突破策略
- 唐奇安通道和拉里威廉斯大交易指数策略
- 均线交叉+MACD慢线动量策略
- 交易量动态调整DCA策略
- MACD Valley Detector 策略
- N Bars 突破策略
- 基于RSI和MACD的低风险稳健型加密货币高频交易策略
- 布林带随机RSI极值信号策略
- RSI双边交易策略
- 基于随机慢速指标的交易策略
- 基于成交量均线的自适应金字塔动态止盈止损交易策略
- MACD TEMA 交叉策略