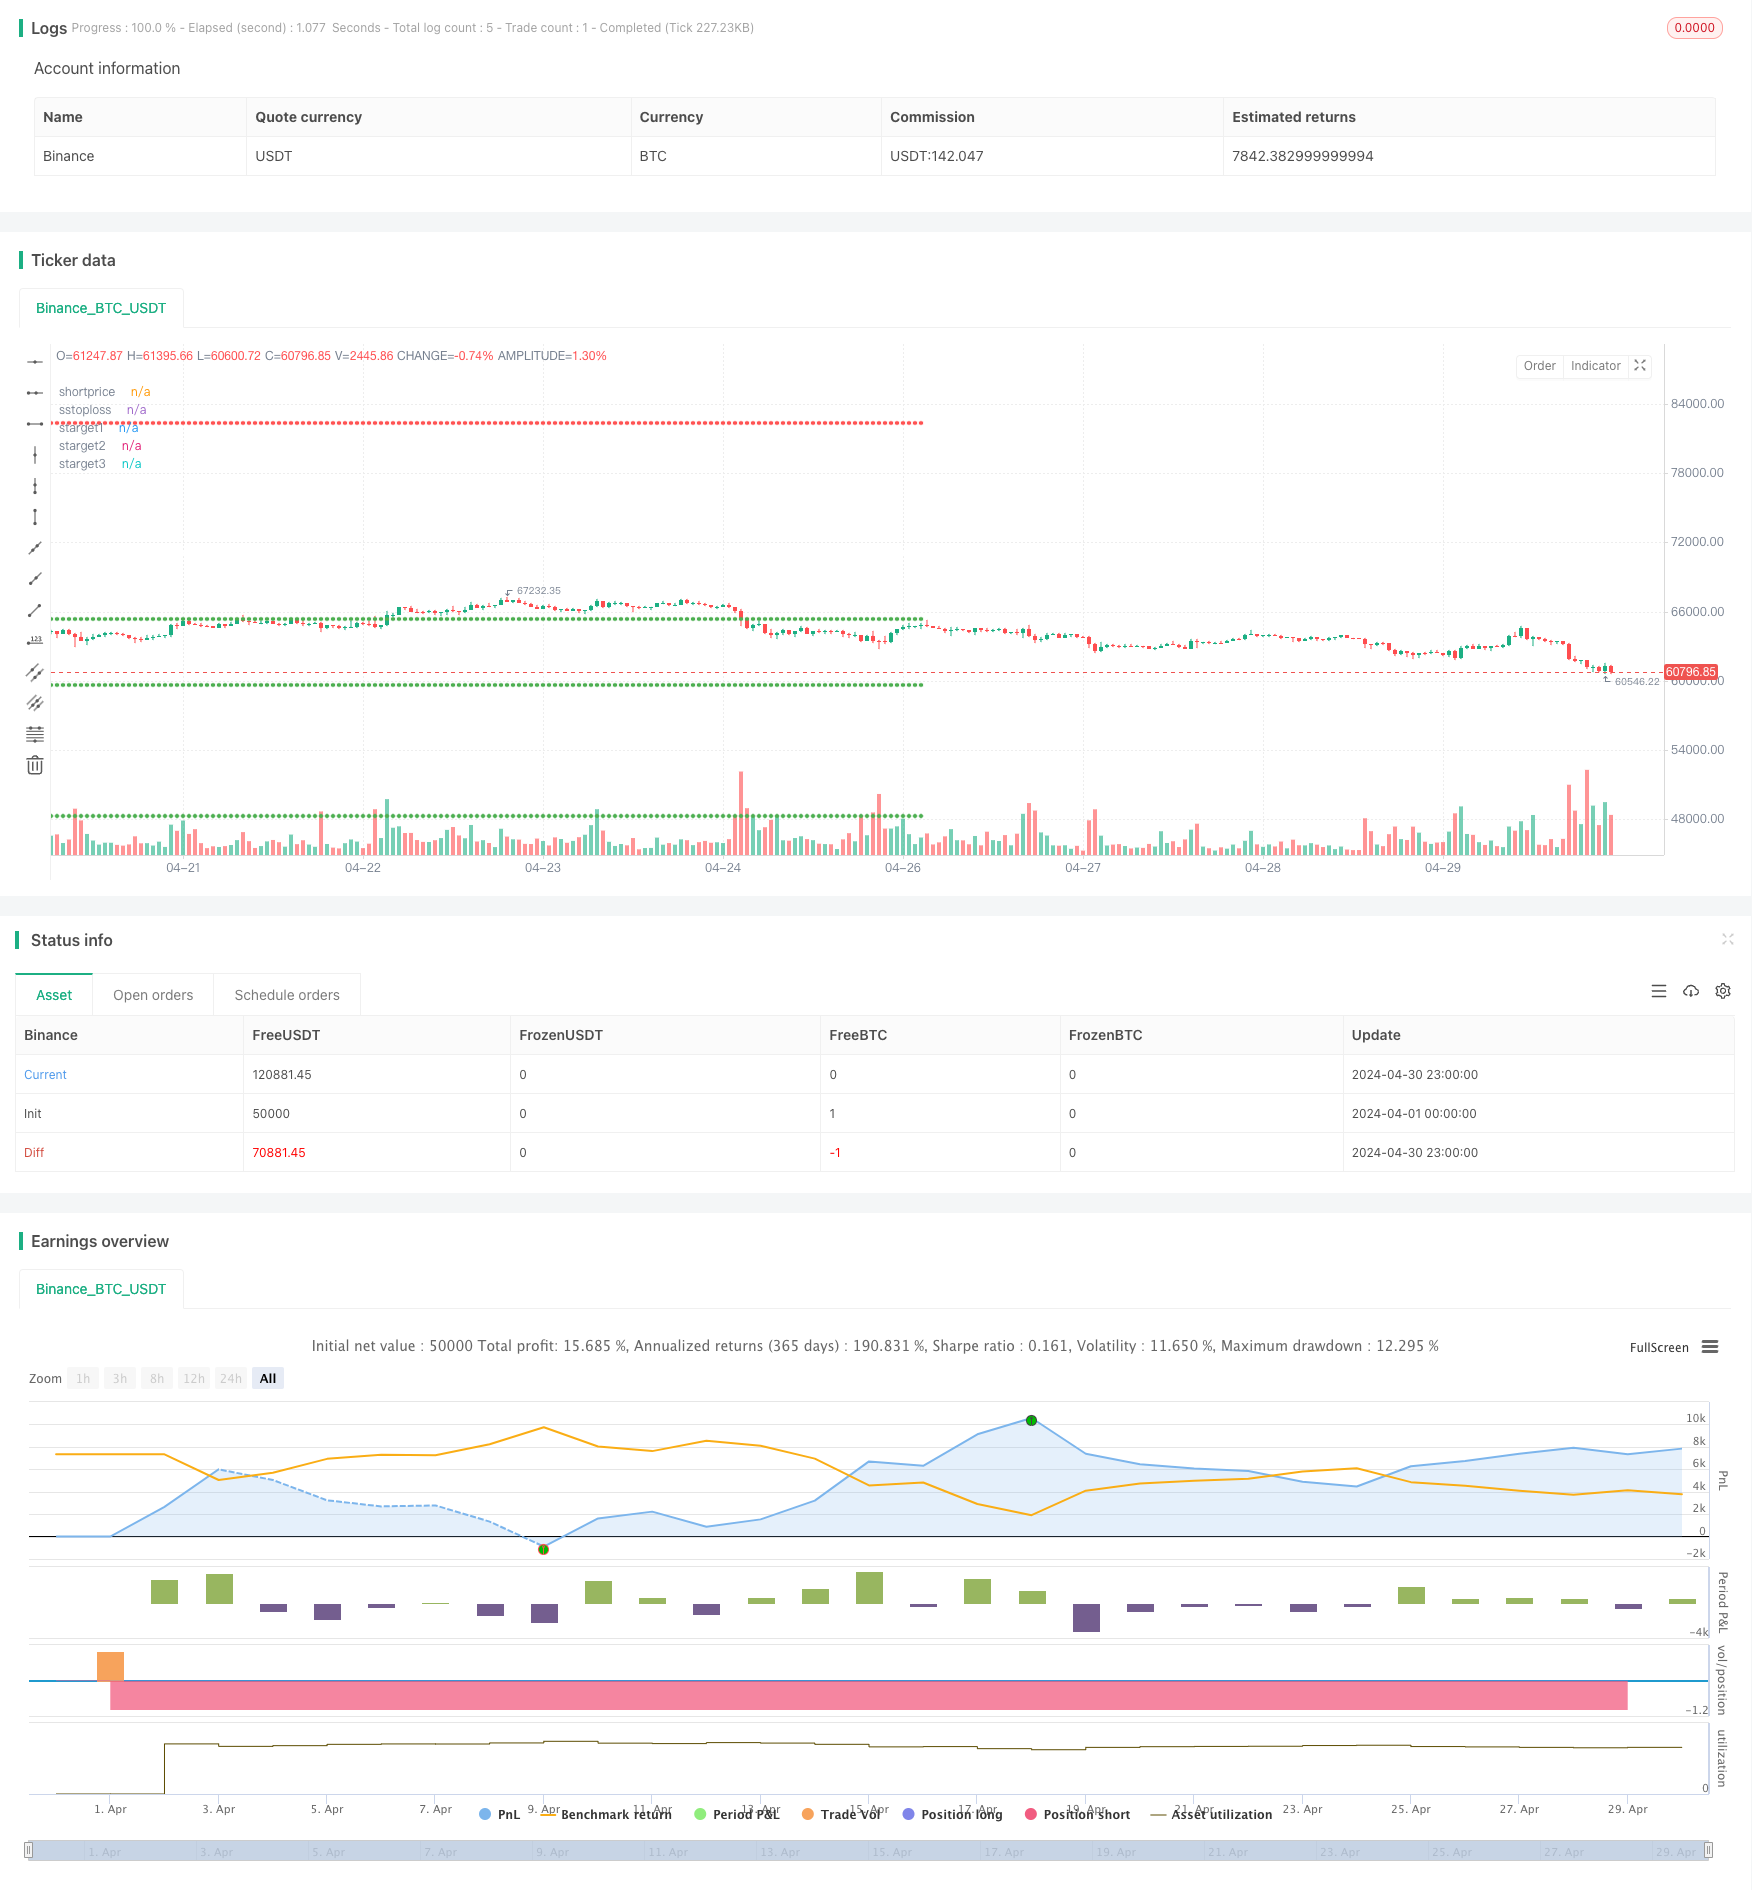
Aperçu
La stratégie quantifiée utilise principalement le signal croisé de l’indicateur SAR parallèle ((PSAR) et de l’indice des moyennes mobiles ((EMA)), combiné à plusieurs conditions personnalisées, pour générer des signaux d’achat et de vente. L’idée principale de la stratégie est de générer un signal d’achat lorsque le PSAR franchit l’EMA en dessous et satisfait à certaines conditions; et un signal de vente lorsque le PSAR franchit l’EMA en haut et satisfait à certaines conditions.
Principe de stratégie
- Calculer le PSAR et l’indicateur EMA à 30 cycles
- Déterminer la relation croisée entre le PSAR et l’EMA et définir le point de repère correspondant
- La définition de l’IGC (Ideal Green Candle) et de l’IRC (Ideal Red Candle) est basée sur la relation entre la position du PSAR et celle de l’EMA, ainsi que sur la couleur de la ligne K.
- L’émergence de l’IGC et de l’IRC pour juger des signaux d’achat et de vente
- La position stop et stop loss sont respectivement de 8%, 16% et 32% du prix d’achat; la position stop est de 16% du prix d’achat; la position stop est de 16% du prix d’achat et 32% du prix d’achat.
- Opérations d’achat, de vente ou de liquidation en fonction du moment de la transaction et de l’état de la position
Avantages stratégiques
- La combinaison de plusieurs indicateurs et conditions améliore la fiabilité du signal
- Plusieurs arrêts et arrêts de perte pour un contrôle flexible des risques et des bénéfices
- Les conditions de filtrage des achats et des ventes sont adaptées aux différentes conditions du marché, ce qui améliore l’adaptabilité de la stratégie.
- Code hautement modulaire, facile à comprendre et à modifier
Risque stratégique
- Les paramètres de la stratégie peuvent ne pas être adaptés à tous les environnements de marché et doivent être adaptés en fonction de la réalité
- Cette stratégie peut entraîner des signaux de trading fréquents dans des marchés en turbulence, entraînant une augmentation des coûts de transaction.
- La stratégie manque de jugement sur les tendances du marché et risque de manquer une opportunité dans un marché en forte tendance
- Les paramètres de stop-loss peuvent ne pas éviter complètement les risques liés aux conditions extrêmes.
Orientation de l’optimisation de la stratégie
- L’introduction de plus d’indicateurs techniques ou d’indicateurs de l’humeur du marché pour améliorer la précision et la fiabilité des signaux
- Optimisation des paramètres de stop-loss et de stop-loss, avec l’introduction de stop-loss dynamique ou de stop-loss basé sur les fluctuations
- Adaptation des stratégies en fonction des différentes conditions du marché, en définissant différents paramètres et règles de négociation
- Ajout d’un module de gestion de fonds pour ajuster dynamiquement les positions et l’exposition au risque en fonction de facteurs tels que le solde du ratio d’équité du compte
Résumer
La stratégie quantifiée est basée sur les indicateurs PSAR et EMA, générant des signaux d’achat et de vente via plusieurs conditions et règles personnalisées. La stratégie a une certaine adaptabilité et flexibilité, tout en établissant des points de stop-loss pour contrôler les risques. Cependant, il y a de la place pour l’optimisation en termes de paramètres de la stratégie et de contrôle des risques.
/*backtest
start: 2024-04-01 00:00:00
end: 2024-04-30 23:59:59
period: 1h
basePeriod: 15m
exchanges: [{"eid":"Binance","currency":"BTC_USDT"}]
*/

// This Pine Script™ code is subject to the terms of the Mozilla Public License 2.0 at https://mozilla.org/MPL/2.0/
// © SwapnilRaykar

//@version=5
strategy("aj sir second project", overlay=true, margin_long=100, margin_short=100)

start=input("0915-1515","session time")
st11=time(timeframe.period,start)
st=st11>0
et= not st

psar=ta.sar(0.02,0.02,0.2)
emared=ta.ema(close,30)
//plot(psar,"psar",color.yellow,style = plot.style_cross)
//plot(emared,"emared",color.red)
var crodownflag=0
var croupflag=0

var igcflag=0

var ircflag=0

cdown1=ta.crossunder(psar,emared)  and not (psar<close and psar[1]>close[1])
cup1=ta.crossover(psar,emared) and not (psar>close and psar[1]<close[1])

cdown=ta.crossunder(psar,emared)
cup=ta.crossover(psar,emared)


green_candle=close>open
red_candle=close<open

if ta.crossunder(psar,emared) and crodownflag==0  and not (psar<close and psar[1]>close[1])
    crodownflag:=1
else if cdown and crodownflag==1
    crodownflag:=0


if crodownflag==1 and green_candle and igcflag==0
    igcflag:=1
else if cdown and igcflag==1
    igcflag:=0

//plot(igcflag,"igcflag",color.lime)

if ta.crossover(psar,emared) and croupflag==0 and not (psar>close and psar[1]<close[1])
    croupflag:=1
else if cdown and croupflag==1
    croupflag:=0

//plot(crodownflag,"crodownflag",color.white)
irc_cond=croupflag==1 or cup

if (croupflag==1 and red_candle and ircflag==0)
    ircflag:=1
else if cup and croupflag==1
    ircflag:=0

igc_candle1=(igcflag==1 and igcflag[1]==0) or (cdown1 and green_candle)
irc_candle1=(ircflag==1 and ircflag[1]==0) or (cup1 and red_candle)
///////////////////////////
dm=dayofmonth(time)
newday=dm!=dm[1]
dmc=dm==ta.valuewhen(bar_index==last_bar_index,dm,0)

///////////////////////////////////////////
var irc_there=0

if irc_candle1[1] and irc_there==0
    irc_there:=1
else if cdown and irc_there==1
    irc_there:=0

irc_candle=irc_candle1 and irc_there==0// and dmc

var igc_there=0

if igc_candle1[1] and igc_there==0
    igc_there:=1
else if cup and igc_there ==1
    igc_there:=0

igc_candle=igc_candle1 and igc_there==0// and dmc
/////////// to get rid of irc being valid even after crossdown
var valid_igc_low=0
var valid_irc_high=0

if irc_candle[1] and valid_irc_high==0
    valid_irc_high:=1
else if igc_candle and valid_irc_high==1
    valid_irc_high:=0

if igc_candle and valid_igc_low==0
    valid_igc_low:=1
else if irc_candle and valid_igc_low==1
    valid_igc_low:=0


igc_low=ta.valuewhen(igc_candle,low,0)
irc_high=ta.valuewhen(irc_candle,high,0)
//////////////////////////////
//plot(irc_high,"irc_high",color.red)

//plot(valid_irc_high,"valid_irc_high",color.purple)

buy12=ta.crossunder(close,igc_low) and valid_igc_low==1
buy1=buy12[1]

short12=ta.crossover(close,irc_high) and valid_irc_high==1
short1=short12[1]
//plotshape(short12,"short12",shape.arrowdown,color=color.purple)

// plotshape(igc_candle,"igc_candle",shape.arrowdown,color=color.green)
// plotshape(irc_candle,"irc_candle",shape.arrowdown,color=color.red)
//plotshape((psar<close and psar[1]>close[1]) ,"croup",shape.arrowdown,color=color.red)
//plotshape(cup ,"croup",shape.arrowdown,color=color.orange)

buyprice=ta.valuewhen(buy1 and strategy.position_size[1]==0,open,0)
shortprice=ta.valuewhen(short1 and strategy.position_size[1]==0,open,0)

btarget1=buyprice+(buyprice*0.08)
btarget2=buyprice+(buyprice*0.16)
btarget3=buyprice+(buyprice*0.32)
bstoploss=buyprice-(buyprice*0.16)

starget1=shortprice-(shortprice*0.08)
starget2=shortprice-(shortprice*0.16)
starget3=shortprice-(shortprice*0.32)
sstoploss=shortprice+(shortprice*0.16)

if buy12 and strategy.position_size==0 and st11
    strategy.entry("buy",strategy.long)

if strategy.position_size >0
    strategy.exit("sell",from_entry = "buy",stop=bstoploss,limit=btarget3)

if short12 and strategy.position_size==0 and st11
    strategy.entry("short",strategy.short)

if strategy.position_size<0
    strategy.exit("cover",from_entry = "short",stop = sstoploss,limit = starget3)

if et
    strategy.close_all(comment = "timeover")

plot(strategy.position_size>0?buyprice:na,"buyprice",color.white, style=plot.style_circles )
plot(strategy.position_size>0?bstoploss:na,"bstoploss",color.red, style=plot.style_circles )
plot(strategy.position_size>0?btarget1:na,"btarget1",color.green, style=plot.style_circles )
plot(strategy.position_size>0?btarget2:na,"btarget2",color.green, style=plot.style_circles )
plot(strategy.position_size>0?btarget3:na,"btarget3",color.green, style=plot.style_circles )

plot(strategy.position_size<0?shortprice:na,"shortprice",color.white, style=plot.style_circles )
plot(strategy.position_size<0?sstoploss:na,"sstoploss",color.red, style=plot.style_circles )
plot(strategy.position_size<0?starget1:na,"starget1",color.green, style=plot.style_circles )
plot(strategy.position_size<0?starget2:na,"starget2",color.green, style=plot.style_circles )
plot(strategy.position_size<0?starget3:na,"starget3",color.green, style=plot.style_circles )