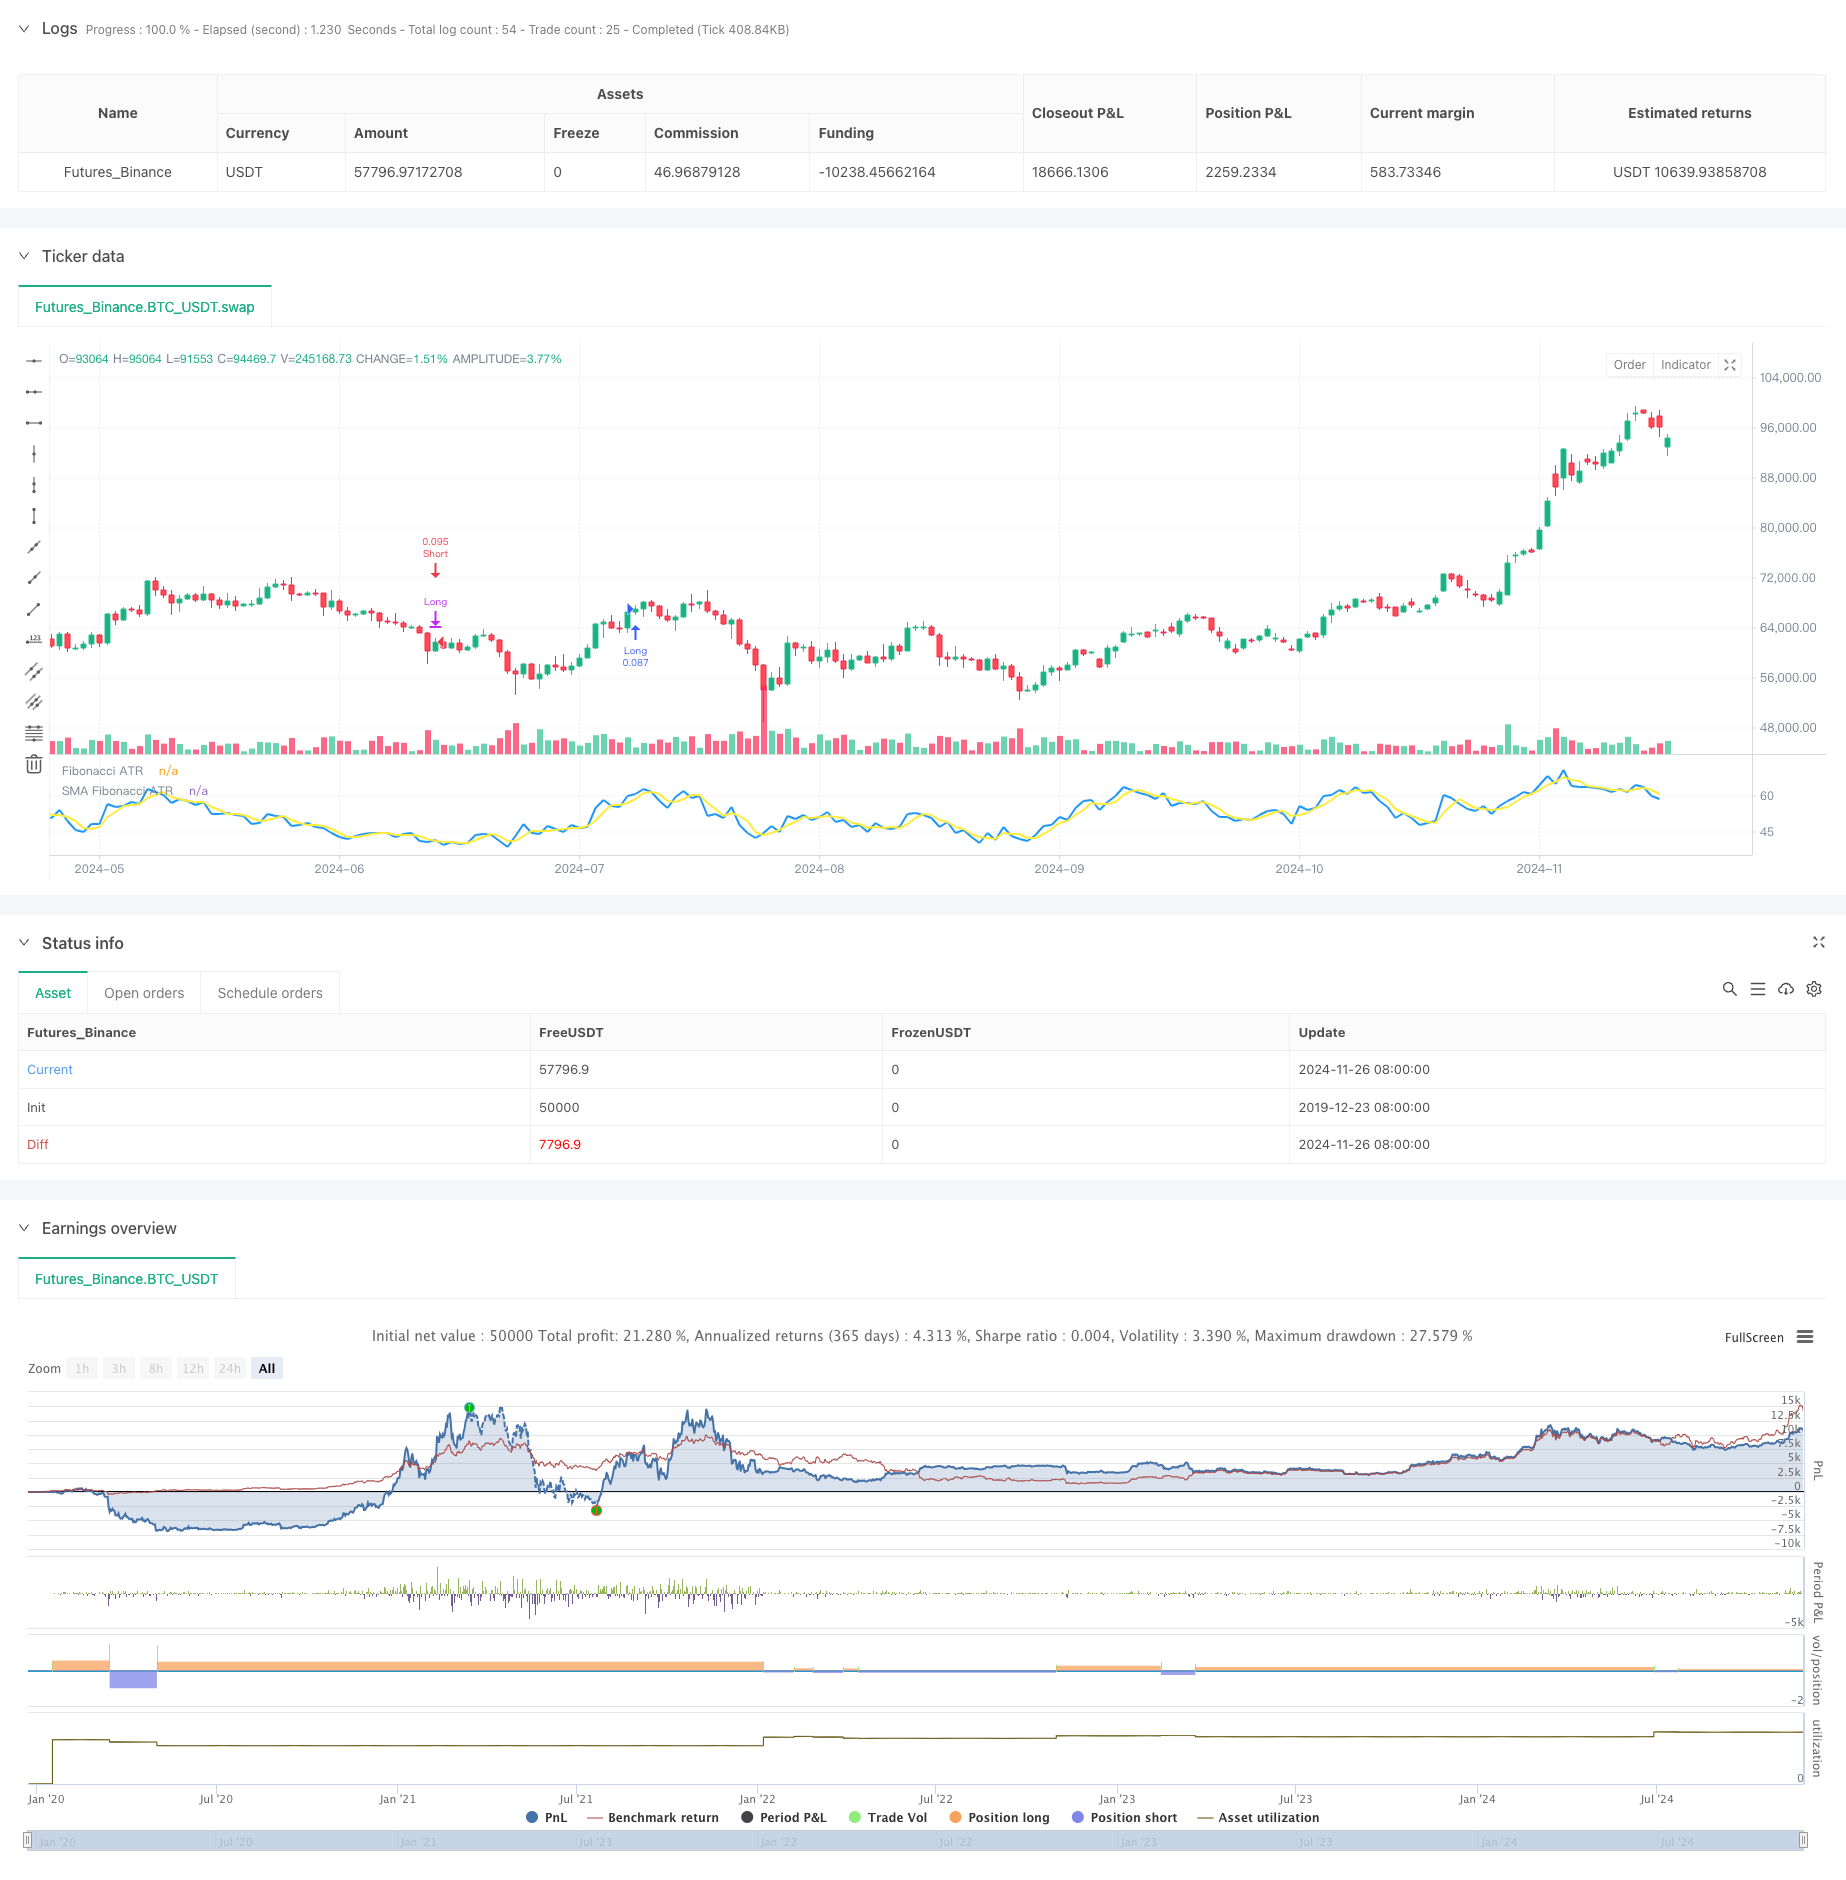
Aperçu
Cette stratégie est un système de suivi de tendance avancé basé sur l’ATR et les séries pondérées de Fibonacci. Elle construit un modèle de négociation réactif et adaptable en combinant l’analyse de la volatilité sur plusieurs périodes de temps avec la moyenne pondérée de Fibonacci.
Principe de stratégie
La stratégie utilise une approche de combinaison d’indicateurs techniques à plusieurs niveaux: on calcule d’abord la gamme de fluctuation réelle (TR) et la pression d’achat (BP), puis on calcule le rapport de pression pour chaque période sur la base d’une série de périodes de temps de Fibonacci (8,13,21,34,55); on construit une moyenne pondérée en appliquant différents poids (5,4,3,2,1) à différentes périodes; et on applique ensuite le traitement de lissage de la SMA à 3 périodes. Le système déclenche un signal de transaction en fonction de la croisée de la SMA avec les seuils prédéfinis (58.0 et 42.0) et utilise l’ATR pour concevoir un mécanisme de profit en quatre étapes.
Avantages stratégiques
- Analyse multidimensionnelle: des données couvrant plusieurs périodes permettent d’avoir une vision plus complète du marché
- Adaptation dynamique: Adaptation aux fluctuations du marché grâce à l’ATR pour améliorer la stabilité stratégique
- Profit intelligent: un mécanisme de profit en quatre étapes qui s’adapte avec souplesse à différents environnements de marché
- Risques maîtrisés: conditions d’entrée et de sortie claires, réduisant les risques liés aux jugements subjectifs
- Opérations systématisées: logique stratégique claire, facilité de mise en œuvre quantifiable et de vérification de retour
Risque stratégique
- Sensibilité des paramètres: plusieurs paramètres de valeurs et de poids doivent être ajustés avec soin
- Risque de retard: le relâchement de la SMA peut entraîner un retard de signal
- La dépendance aux conditions du marché: des signaux erronés peuvent être générés dans un marché en crise
- Adaptation des paramètres: les paramètres doivent être ré-optimisés pour les différentes conditions du marché Solution: Optimisation et rétro-évaluation des paramètres et adaptation des paramètres en fonction de la dynamique des différentes phases du marché.
Orientation de l’optimisation de la stratégie
- Adaptation des paramètres: développer des mécanismes d’ajustement des paramètres d’adaptation pour améliorer l’adaptabilité des stratégies
- Filtrage du marché: ajout d’un module d’identification de l’environnement du marché pour exécuter des transactions dans les conditions du marché appropriées
- Optimisation du signal: introduction d’indicateurs de confirmation auxiliaires pour améliorer la fiabilité du signal
- Amélioration du contrôle du vent: ajout d’un module de gestion dynamique des pertes et des positions
- Contrôle de retrait: ajout d’une limite de retrait maximale pour améliorer la stabilité de la stratégie
Résumer
La stratégie a pour avantage d’être multidimensionnelle et dynamique, mais nécessite également une attention particulière à l’optimisation des paramètres et au filtrage des conditions de marché. Grâce à une optimisation continue et à un renforcement des vents, la stratégie devrait être stable dans différents environnements de marché.
/*backtest
start: 2019-12-23 08:00:00
end: 2024-11-27 00:00:00
period: 1d
basePeriod: 1d
exchanges: [{"eid":"Futures_Binance","currency":"BTC_USDT"}]
*/

// This Pine Script™ code is subject to the terms of the Mozilla Public License 2.0 at https://mozilla.org/MPL/2.0/
// © PresentTrading

// The Fibonacci ATR Fusion Strategy is an advanced trading methodology that uniquely integrates Fibonacci-based weighted averages with the Average True Range (ATR) to
// identify and exploit significant market trends. Unlike traditional strategies that rely on single indicators or fixed parameters, this approach leverages multiple timeframes and
// dynamic volatility measurements to enhance accuracy and adaptability.

//@version=5
strategy("Fibonacci ATR Fusion - Strategy [presentTrading]", overlay=false, precision=3, commission_value= 0.1, commission_type=strategy.commission.percent, slippage= 1, currency=currency.USD, default_qty_type = strategy.percent_of_equity, default_qty_value = 10, initial_capital=10000)

// Calculate True High and True Low
tradingDirection = input.string(title="Trading Direction", defval="Both", options=["Long", "Short", "Both"])

// Trading Condition Thresholds
long_entry_threshold = input.float(58.0, title="Long Entry Threshold")
short_entry_threshold = input.float(42.0, title="Short Entry Threshold")
long_exit_threshold = input.float(42.0, title="Long Exit Threshold")
short_exit_threshold = input.float(58.0, title="Short Exit Threshold")

// Enable or Disable 4-Step Take Profit
useTakeProfit = input.bool(false, title="Enable 4-Step Take Profit")

// Take Profit Levels (as multiples of ATR)
tp1ATR = input.float(3.0, title="Take Profit Level 1 ATR Multiplier")
tp2ATR = input.float(8.0, title="Take Profit Level 2 ATR Multiplier")
tp3ATR = input.float(14.0, title="Take Profit Level 3 ATR Multiplier")

// Take Profit Percentages
tp1_percent = input.float(12.0, title="TP Level 1 Percentage", minval=0.0, maxval=100.0)
tp2_percent = input.float(12.0, title="TP Level 2 Percentage", minval=0.0, maxval=100.0)
tp3_percent = input.float(12.0, title="TP Level 3 Percentage", minval=0.0, maxval=100.0)

true_low = math.min(low, close[1])
true_high = math.max(high, close[1])

// Calculate True Range
true_range = true_high - true_low

// Calculate BP (Buying Pressure)
bp = close - true_low

// Calculate ratios for different periods
calc_ratio(len) =>
    sum_bp = math.sum(bp, len)
    sum_tr = math.sum(true_range, len)
    100 * sum_bp / sum_tr

// Calculate weighted average of different timeframes
weighted_avg = (5 * calc_ratio(8) + 4 * calc_ratio(13) + 3 * calc_ratio(21) + 2 * calc_ratio(34) + calc_ratio(55)) / (5 + 4 + 3 + 2 + 1)
weighted_avg_sma = ta.sma(weighted_avg,3)

// Plot the indicator
plot(weighted_avg, "Fibonacci ATR", color=color.blue, linewidth=2)
plot(weighted_avg_sma, "SMA Fibonacci ATR", color=color.yellow, linewidth=2)

// Define trading conditions
longCondition = ta.crossover(weighted_avg_sma, long_entry_threshold)  // Enter long when weighted average crosses above threshold
shortCondition = ta.crossunder(weighted_avg_sma, short_entry_threshold) // Enter short when weighted average crosses below threshold
longExit = ta.crossunder(weighted_avg_sma, long_exit_threshold)
shortExit = ta.crossover(weighted_avg_sma, short_exit_threshold)


atrPeriod = 14
atrValue = ta.atr(atrPeriod)

if (tradingDirection == "Long" or tradingDirection == "Both")
    if (longCondition)
        strategy.entry("Long", strategy.long)
        // Set Take Profit levels for Long positions
        if useTakeProfit
            tpPrice1 = strategy.position_avg_price + tp1ATR * atrValue
            tpPrice2 = strategy.position_avg_price + tp2ATR * atrValue
            tpPrice3 = strategy.position_avg_price + tp3ATR * atrValue
            // Close partial positions at each Take Profit level
            strategy.exit("TP1 Long", from_entry="Long", qty_percent=tp1_percent, limit=tpPrice1)
            strategy.exit("TP2 Long", from_entry="Long", qty_percent=tp2_percent, limit=tpPrice2)
            strategy.exit("TP3 Long", from_entry="Long", qty_percent=tp3_percent, limit=tpPrice3)
    if (longExit)
        strategy.close("Long")

if (tradingDirection == "Short" or tradingDirection == "Both")
    if (shortCondition)
        strategy.entry("Short", strategy.short)
        // Set Take Profit levels for Short positions
        if useTakeProfit
            tpPrice1 = strategy.position_avg_price - tp1ATR * atrValue
            tpPrice2 = strategy.position_avg_price - tp2ATR * atrValue
            tpPrice3 = strategy.position_avg_price - tp3ATR * atrValue
            // Close partial positions at each Take Profit level
            strategy.exit("TP1 Short", from_entry="Short", qty_percent=tp1_percent, limit=tpPrice1)
            strategy.exit("TP2 Short", from_entry="Short", qty_percent=tp2_percent, limit=tpPrice2)
            strategy.exit("TP3 Short", from_entry="Short", qty_percent=tp3_percent, limit=tpPrice3)
    if (shortExit)
        strategy.close("Short")