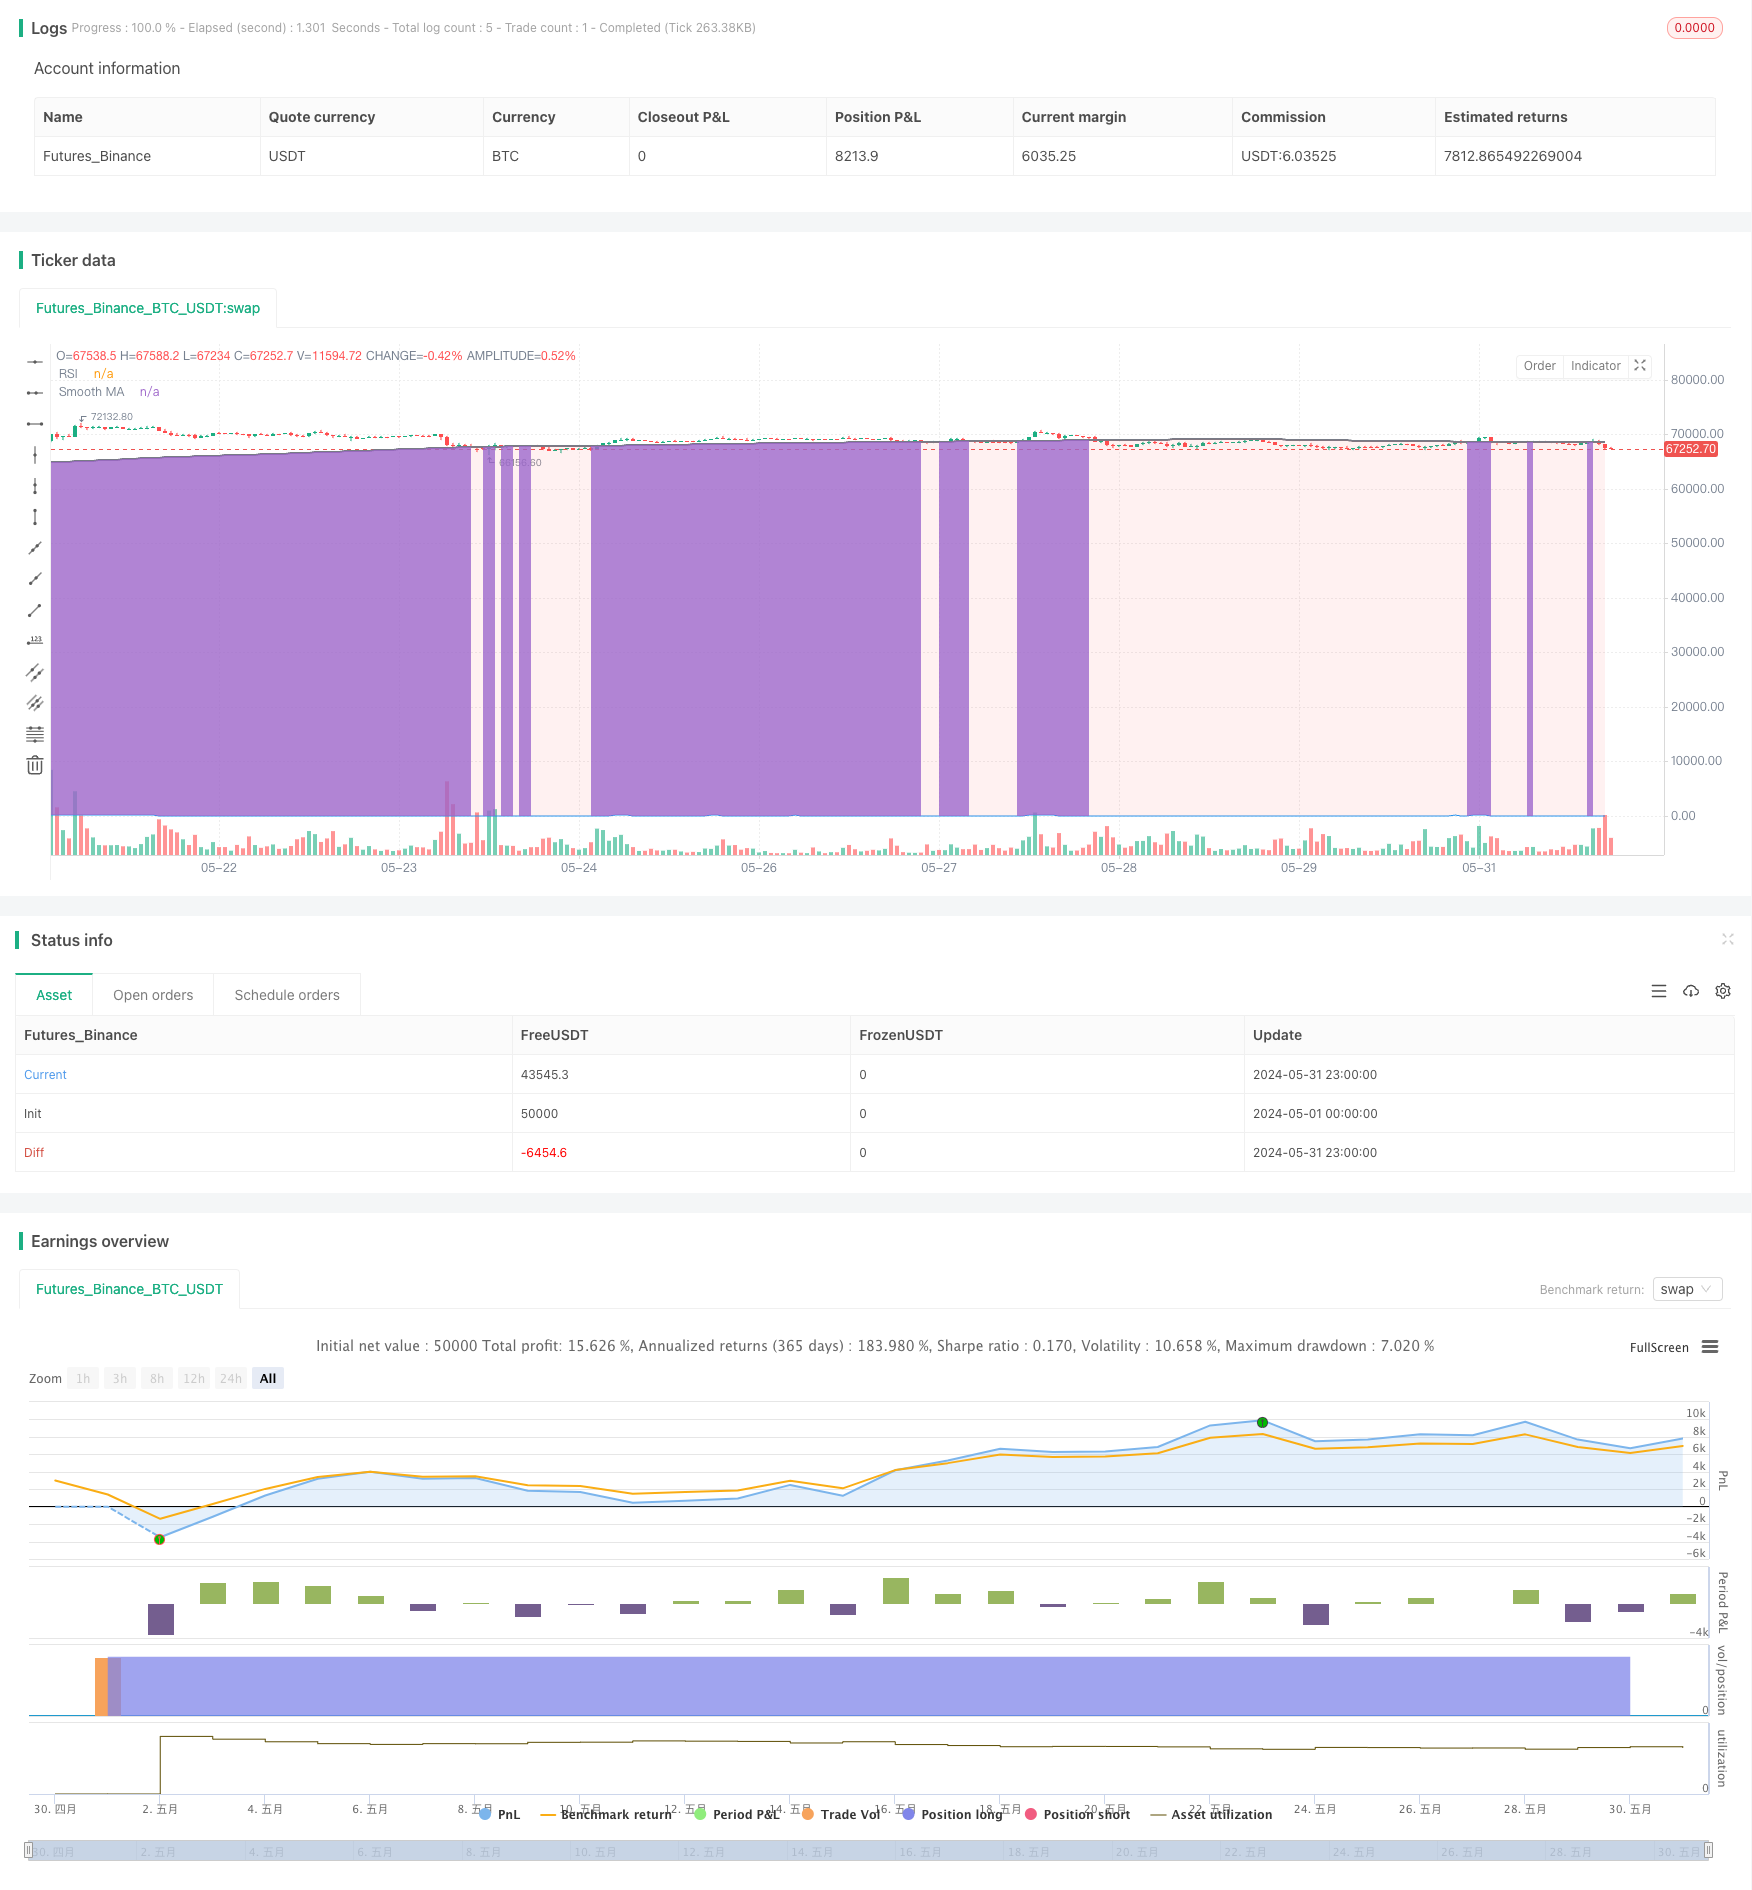
概述
该策略通过使用平滑移动平均线(SMA)、相对强弱指数(RSI)、真实范围(TR)和成交量移动平均线(Volume MA)等指标,结合趋势过滤、交易量和波动率条件,在满足特定条件时进行交易。该策略的主要思路是在价格低于SMA200且处于下跌趋势、低交易量和低波动率的情况下进行买入,并设置止损和止盈位。同时,该策略还具有异常退出机制,即当RSI超过70或达到预设的止损止盈位时退出交易。
策略原理
- 计算SMA、RSI、交易量MA和TR MA等指标
- 判断当前是否处于上升或下降趋势
- 判断当前交易量和波动率是否处于低位
- 当价格低于SMA200且满足低交易量和低波动率条件时,进行买入
- 设置止损位为买入价的95%,止盈位为买入价的150%
- 当RSI超过70或达到预设的止损止盈位时,退出交易
- 当趋势发生变化且价格突破SMA时,强制平仓
优势分析
- 该策略结合了多个技术指标,可以更全面地分析市场状况
- 通过趋势过滤和交易量、波动率条件,可以避免在不利的市场环境下进行交易
- 设置明确的止损止盈位,可以有效控制风险
- 异常退出机制可以在特定情况下及时平仓,防止进一步损失
风险分析
- 该策略依赖于多个参数的设置,参数的选择可能会影响策略表现
- 在某些情况下,价格可能会在触发买入条件后快速反转,导致损失
- 该策略没有考虑基本面因素,可能会受到重大事件的影响
优化方向
- 可以考虑引入更多的技术指标,如MACD、布林带等,以提高入场和出场的精确度
- 可以优化止损止盈位的设置,如使用移动止损或动态止盈
- 可以根据不同的市场状况,动态调整策略参数
- 可以加入风险管理模块,如仓位管理、资金管理等
总结
该策略通过综合使用多个技术指标,结合趋势过滤和交易量、波动率条件,在特定情况下进行交易。同时,设置明确的止损止盈位和异常退出机制,可以有效控制风险。但该策略也存在一定的局限性,如参数选择、市场异常等因素可能会影响策略表现。未来可以通过引入更多指标、优化参数设置、加入风险管理等方式来进一步改进该策略。
策略源码
/*backtest
start: 2024-05-01 00:00:00
end: 2024-05-31 23:59:59
period: 1h
basePeriod: 15m
exchanges: [{"eid":"Futures_Binance","currency":"BTC_USDT"}]
*/

//@version=5
strategy("Strategia Stop Loss & Take Profit z Filtrem Trendu i Wyjątkiem", shorttitle="Smooth MA SL & TP with Exception", overlay=true)

// Parametry
tp_multiplier = input.float(1.5, title="Mnożnik Take Profit")
sl_percent = input.float(5, title="Procent Stop Loss")
wait_bars = input.int(3, title="Liczba Oczekiwanych Świec")
sma_period = input.int(200, title="Okres SMA")
rsi_period = input.int(14, title="Okres RSI")
vol_ma_period = input.int(20, title="Okres Średniej Wolumenu")
tr_ma_period = input.int(20, title="Okres Średniej Rzeczywistego Zakresu")

// Obliczenie Gładkiej Średniej Kroczącej
sma = ta.sma(close, sma_period)

// Obliczenie RSI
rsi = ta.rsi(close, rsi_period)

// Filtr Trendu
uptrend = close > sma
downtrend = close < sma

// Warunek konsolidacji: Niski wolumen i niska zmienność
niski_wolumen = volume < ta.sma(volume, vol_ma_period)
niska_zmienosc = ta.tr(true) < ta.sma(ta.tr(true), tr_ma_period)

// Warunek Wejścia (Long): Cena poniżej SMA 200 i filtr trendu w strefie czerwonej
warunek_wejscia = close < sma and niski_wolumen and niska_zmienosc and not uptrend

// Warunek Wyjścia ze strategii
warunek_wyjscia = downtrend and close > sma and ta.crossover(close, sma)

// Ustalanie Stop Loss i Take Profit
var float stop_loss = na
var float take_profit = na

var int indeks_wejscia = na

if (warunek_wejscia)
    stop_loss := close * (1 - sl_percent / 100)
    take_profit := close * (1 + tp_multiplier)
    indeks_wejscia := bar_index

// Handel
if (warunek_wejscia)
    strategy.entry("Long", strategy.long)

// Warunek Wyjścia: RSI w strefie wykupienia lub Stop Loss/Take Profit
if (strategy.opentrades != 0)
    if (rsi > 70)
        strategy.exit("Take Profit/Stop Loss", "Long", limit=take_profit)
    else if (bar_index - indeks_wejscia == wait_bars)
        strategy.exit("Take Profit/Stop Loss", "Long", stop=stop_loss, limit=take_profit)

// Wyjątek: Warunek Wyjścia z Longów na podstawie zmiany trendu
if (warunek_wyjscia)
    strategy.close("Long")

// Rysowanie RSI
rsi_plot = plot(rsi, title="RSI", color=color.blue)

// Rysowanie Gładkiej Średniej Kroczącej
sma_plot = plot(sma, color=color.gray, title="Smooth MA", linewidth=2)

// Rysowanie Filtru Trendu
fill(sma_plot, rsi_plot, color=downtrend ? color.new(color.red, 90) : na)
相关推荐