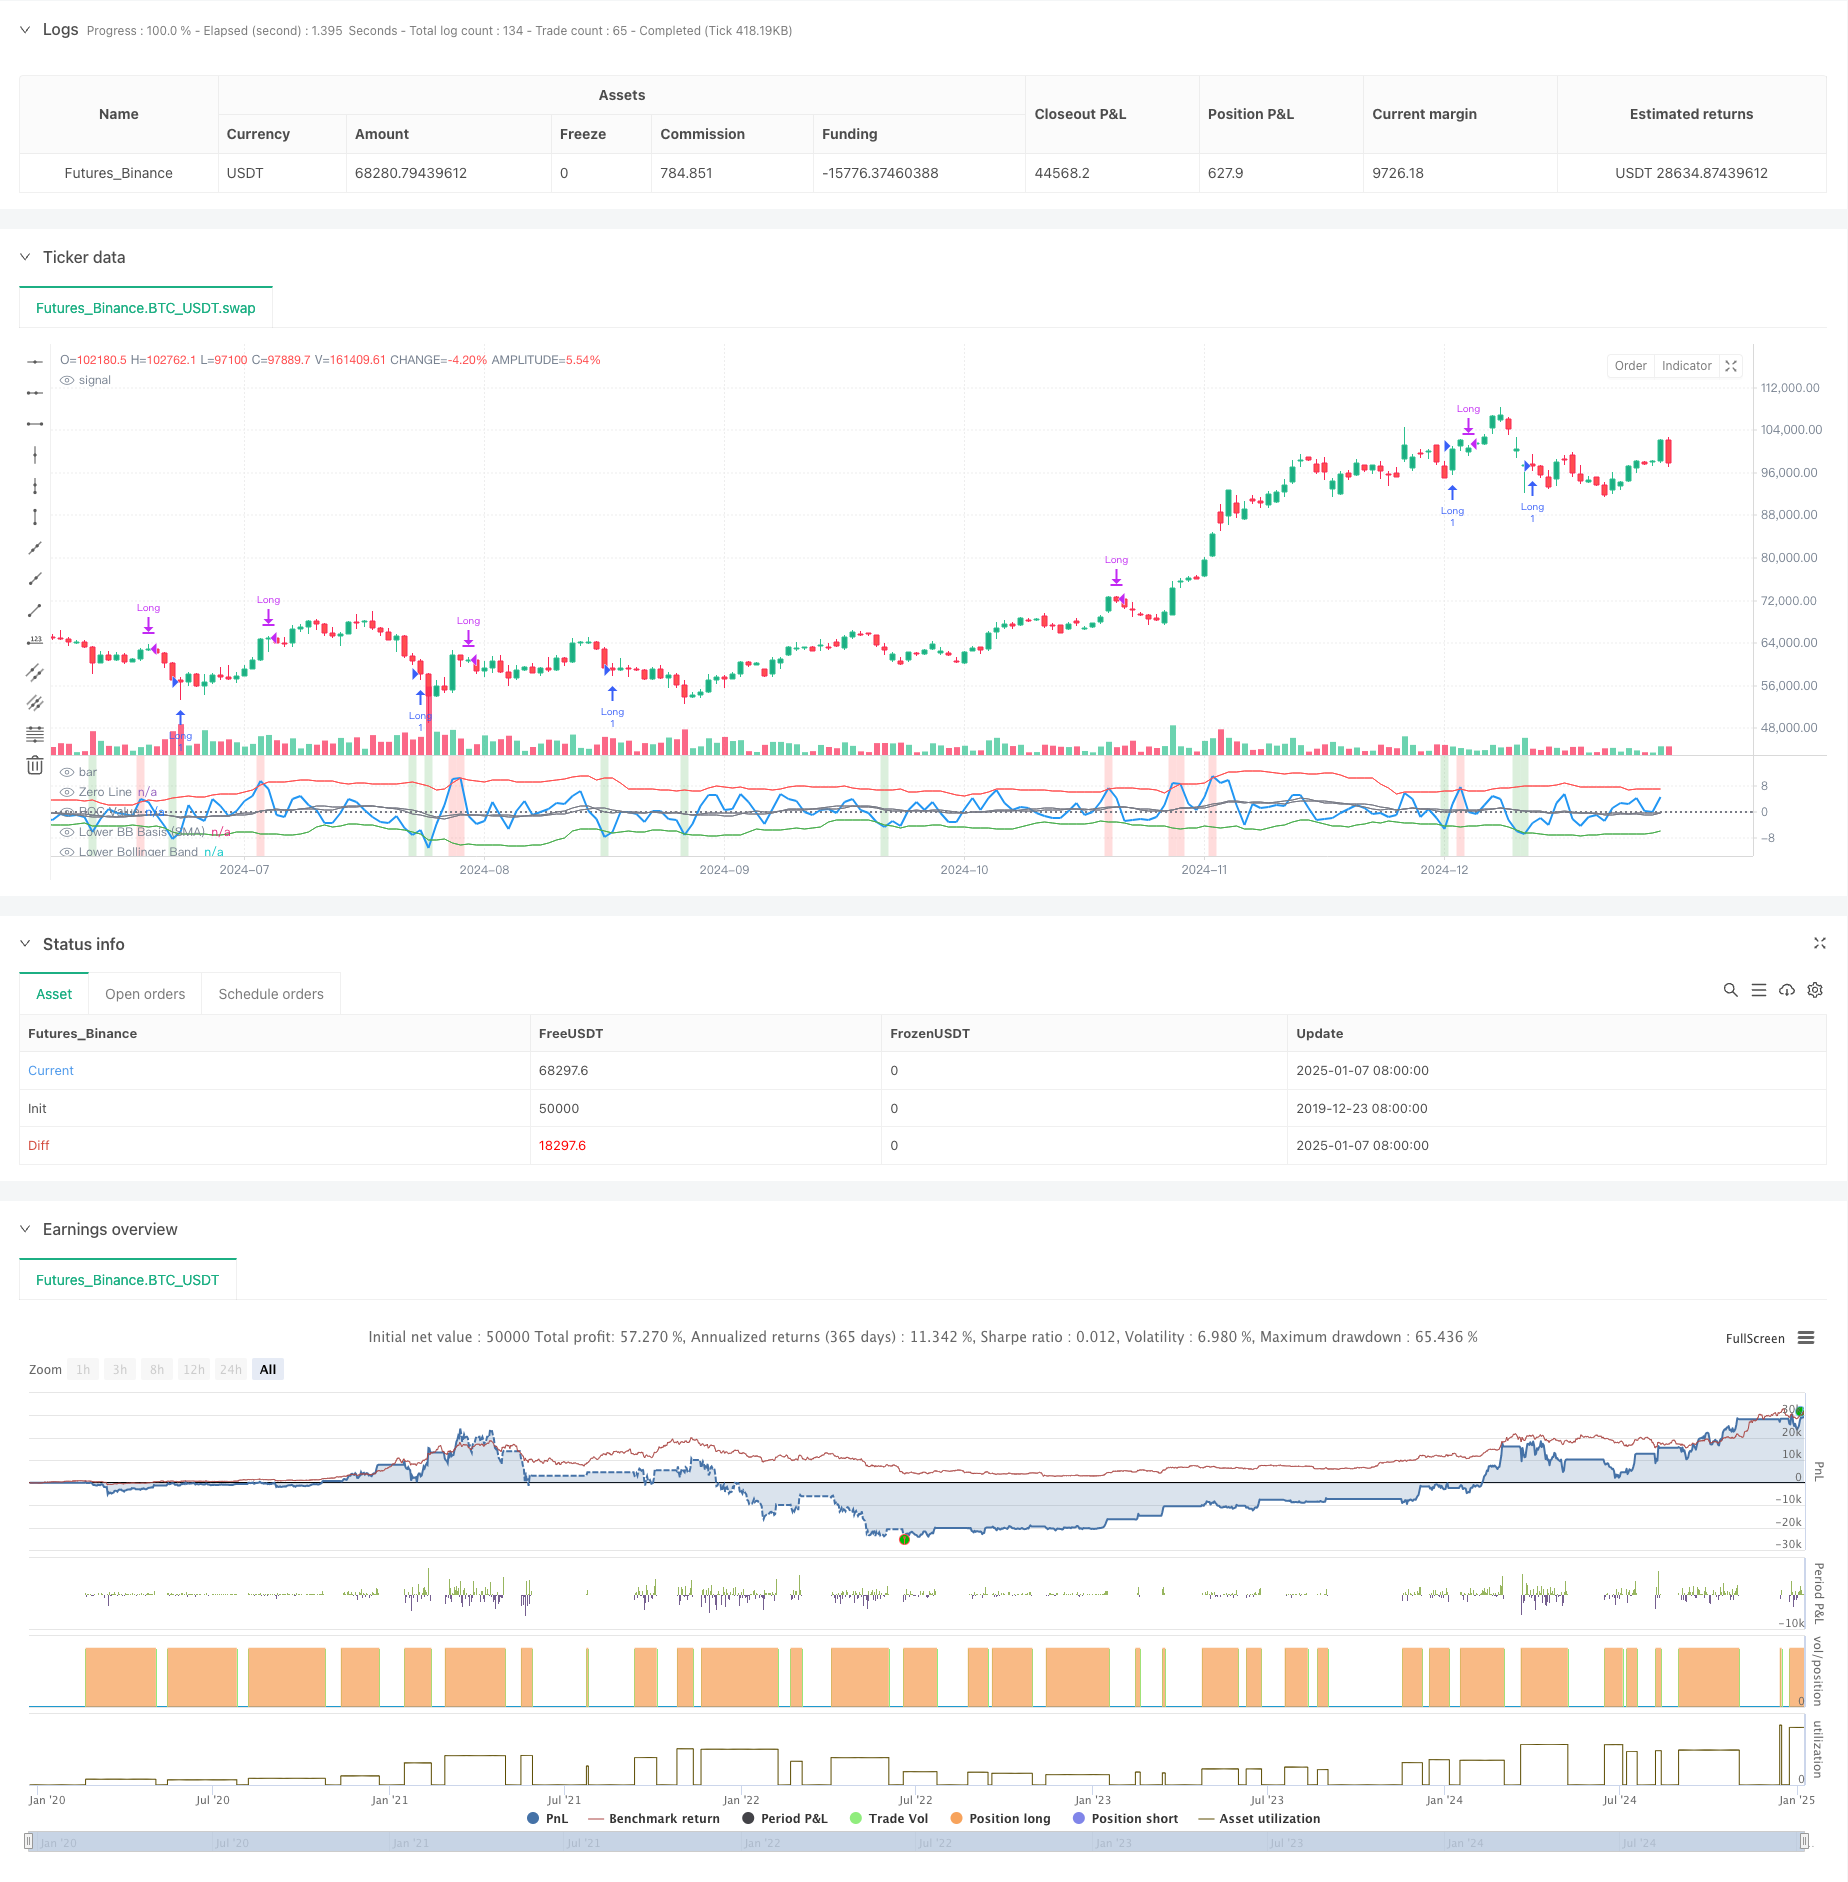
Aperçu
La stratégie est un système de trading hybride qui combine la théorie du momentum et du retour à la moyenne. Il utilise l’indicateur de taux de variation (ROC) et les bandes de Bollinger pour identifier les conditions de surachat et de survente sur le marché, déclenchant des signaux de trading lorsque des seuils spécifiques sont franchis. Le cœur de la stratégie consiste à obtenir des rendements en détectant les points de retournement de la dynamique et en tirant parti de la propriété de retour des prix à la moyenne.
Principe de stratégie
La stratégie utilise un indicateur ROC à 2 périodes pour calculer les variations de prix à court terme et utilise deux ensembles de bandes de Bollinger avec des paramètres différents : les bandes de Bollinger à court terme (18 périodes, 1,7 écart type) sont utilisées pour déterminer les conditions de survente et les signaux d’entrée. , et les bandes de Bollinger à long terme (21 périodes, 2,1 écart type) sont utilisées pour déterminer les conditions de surachat et les signaux de sortie. Lorsque le ROC franchit la bande de Bollinger inférieure vers le haut, cela indique que la dynamique des prix passe de faible à forte et le système ouvre une position longue ; lorsque le ROC franchit la bande de Bollinger supérieure vers le bas, cela indique que la dynamique s’affaiblit et le système ferme la position longue. position. La stratégie marque également les zones de surachat et de survente par une couleur d’arrière-plan, le vert indique la survente (susceptible d’augmenter) et le rouge indique le surachat (susceptible de baisser).
Avantages stratégiques
- Forte adaptabilité : les bandes de Bollinger ajustent automatiquement la bande passante en fonction de la volatilité du marché et peuvent maintenir leur efficacité dans différents environnements de marché
- Contrôle des risques amélioré : désactivez le pyramidage (pyramiding=0), assurez-vous qu’une seule position est détenue à la fois
- Fiabilité élevée du signal : la combinaison de stratégies de momentum et de retour à la moyenne permet de mieux appréhender les points de retournement du marché
- Forte praticité : en tenant compte des coûts de transaction et du glissement, elle est plus conforme à l’environnement commercial réel
Risque stratégique
- Risque de marché volatil : des transactions fréquentes peuvent entraîner des pertes dans la gamme des conditions de marché volatiles.
- Risque de fausse cassure : L’indicateur ROC peut générer de faux signaux de cassure
- Sensibilité des paramètres : les paramètres des bandes de Bollinger et du ROC ont un impact plus important sur les performances de la stratégie
- Dépendance à l’environnement du marché : les stratégies fonctionnent mieux sur les marchés à tendance et peuvent échouer sur les marchés volatils
Orientation de l’optimisation de la stratégie
- Présentation des filtres de tendance : des moyennes mobiles à long terme peuvent être ajoutées pour filtrer la tendance principale du marché et améliorer la précision de la direction des transactions
- Optimiser les paramètres : vous pouvez trouver la combinaison optimale de paramètres du cycle ROC et de la bande de Bollinger grâce au backtesting des données historiques
- Ajoutez un mécanisme de stop loss : définissez un stop loss fixe ou un stop loss suiveur pour contrôler le risque
- Ajouter une confirmation de volume : Combinez les indicateurs de volume pour vérifier la validité des cassures de prix
Résumer
La stratégie de croisement de retour à la moyenne adaptative de la dynamique combine l’indicateur ROC et la double bande de Bollinger pour créer un système de trading capable de s’adapter à différents environnements de marché. La stratégie met l’accent sur le contrôle des risques tout en maintenant la flexibilité et présente une bonne valeur pratique. Grâce à une optimisation et une amélioration continues, cette stratégie devrait permettre d’obtenir de meilleures performances dans le trading réel.
/*backtest
start: 2019-12-23 08:00:00
end: 2025-01-08 08:00:00
period: 1d
basePeriod: 1d
exchanges: [{"eid":"Futures_Binance","currency":"BTC_USDT"}]
*/

//@version=6
strategy("Adaptive Momentum Reversion Strategy ", overlay=false, initial_capital=50000, pyramiding=0, commission_type=strategy.commission.cash_per_contract, commission_value=0.05, slippage=1)

// Input: ROC Period
rocPeriod = input.int(2, title="ROC Period", minval=1)

// Input: Bollinger Bands Settings (Lower Band)
bbLowerLength = input.int(18, title="Lower Bollinger Band Length", minval=1)
bbLowerStdDev = input.float(1.7, title="Lower Bollinger Band StdDev", minval=0.1, step=0.1)

// Input: Bollinger Bands Settings (Upper Band)
bbUpperLength = input.int(21, title="Upper Bollinger Band Length", minval=1)
bbUpperStdDev = input.float(2.1, title="Upper Bollinger Band StdDev", minval=0.1, step=0.1)

// ROC Calculation
rocValue = (close - close[rocPeriod]) / close[rocPeriod] * 100

// Bollinger Bands Calculation
bbLowerBasis = ta.sma(rocValue, bbLowerLength)  // Basis for Lower Band
bbLower = bbLowerBasis - bbLowerStdDev * ta.stdev(rocValue, bbLowerLength)  // Lower Band

bbUpperBasis = ta.sma(rocValue, bbUpperLength)  // Basis for Upper Band
bbUpper = bbUpperBasis + bbUpperStdDev * ta.stdev(rocValue, bbUpperLength)  // Upper Band

// Plot ROC
plot(rocValue, color=color.blue, linewidth=2, title="ROC Value")

// Plot Bollinger Bands
plot(bbLowerBasis, color=color.gray, linewidth=1, title="Lower BB Basis (SMA)")
plot(bbLower, color=color.green, linewidth=1, title="Lower Bollinger Band")
plot(bbUpperBasis, color=color.gray, linewidth=1, title="Upper BB Basis (SMA)")
plot(bbUpper, color=color.red, linewidth=1, title="Upper Bollinger Band")

// Add Zero Line for Reference
hline(0, "Zero Line", color=color.gray, linestyle=hline.style_dotted)

// Entry Condition: Long when ROC crosses above the lower Bollinger Band
longCondition = ta.crossover(rocValue, bbLower)
if (longCondition)
    strategy.entry("Long", strategy.long)

// Exit Condition: Exit on Upper Bollinger Band Cross or ROC drops below Lower Band again
exitCondition = ta.crossunder(rocValue, bbUpper)
if (exitCondition)
    strategy.close("Long")

// Background Color for Extreme Conditions
bgcolor(rocValue > bbUpper ? color.new(color.red, 80) : na, title="Overbought (ROC above Upper BB)")
bgcolor(rocValue < bbLower ? color.new(color.green, 80) : na, title="Oversold (ROC below Lower BB)")