Tren Mengikuti Strategi Berdasarkan Stop Loss Dinamis dari Crossover EMA Dual
Penulis:ChaoZhang, Tanggal: 2024-01-29 09:57:20Tag:

Gambaran umum
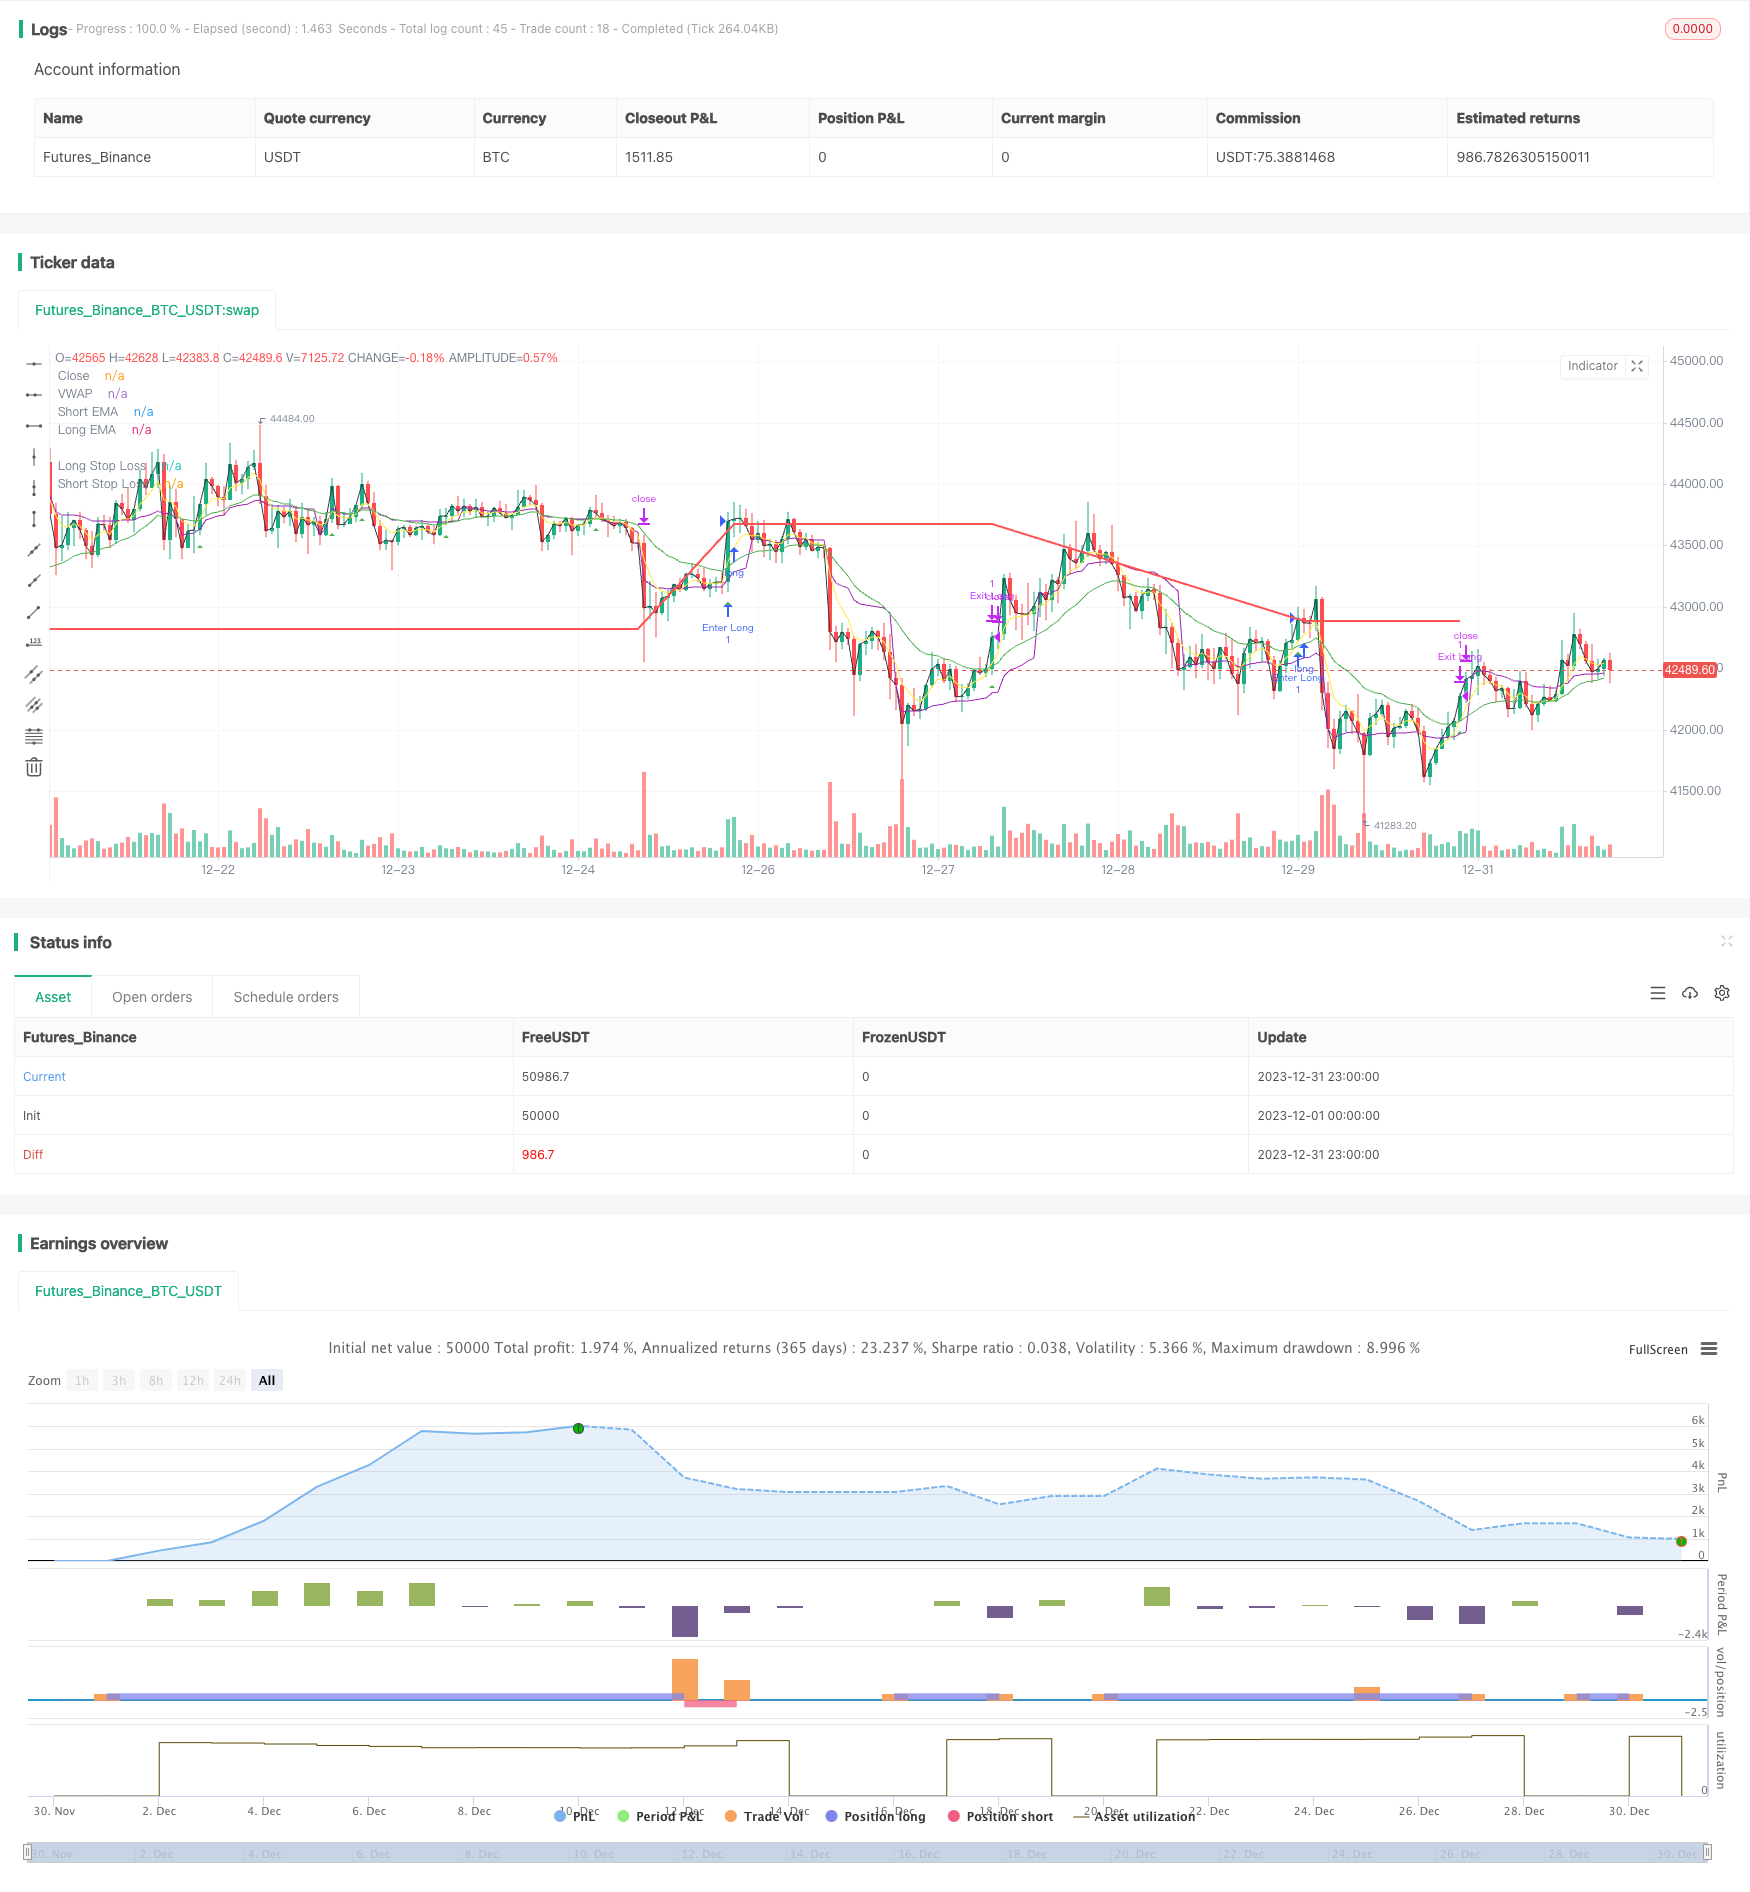
Strategi ini memanfaatkan garis EMA untuk mengikuti tren dua arah, dan mengatur garis stop loss dinamis untuk posisi panjang dan pendek untuk menangkap pergerakan tren di pasar.
Logika Strategi
- Menghitung garis EMA cepat (5 hari) dan garis EMA lambat (20 hari)
- Pergi panjang ketika garis cepat melintasi di atas garis lambat dari bawah; Pergi pendek ketika garis cepat melintasi di bawah garis lambat dari atas
- Setelah masuk panjang, atur stop loss dinamis pada harga masuk * (1 - persentase stop loss panjang); Setelah masuk pendek, atur stop loss dinamis pada harga masuk * (1 + persentase stop loss pendek)
- Posisi keluar dengan stop loss setelah harga mencapai level stop loss
Analisis Keuntungan
- Garis EMA memiliki kemampuan yang lebih kuat dalam melacak tren.
- Stop loss yang dinamis bergerak bersama dengan keuntungan, memaksimalkan keuntungan menangkap tren
- Filter tambahan dengan vwap menghindari terjebak dalam whipsaws dan meningkatkan kualitas sinyal
Analisis Risiko
- Sebagai tren murni mengikuti strategi, ia rentan terhadap pasar yang bervariasi dengan whipsaws
- Stop loss yang terlalu longgar dapat menyebabkan kerugian yang diperbesar
- Sifat keterlambatan sinyal silang EMA dapat melewatkan titik masuk terbaik
Peningkatan seperti manajemen risiko berbasis ATR, mengoptimalkan aturan stop loss, menambahkan indikator filter dll dapat membantu meningkatkan strategi.
Arah Peningkatan
- Mengintegrasikan indikator stop loss dinamis seperti ATR atau DONCH untuk mengatur stop adaptif yang lebih baik
- Tambahkan lebih banyak indikator filter seperti MACD, KDJ untuk menghindari perdagangan buruk
- Optimalkan parameter untuk menemukan kombinasi panjang EMA terbaik
- Menggunakan metode pembelajaran mesin untuk menemukan parameter optimal
Kesimpulan
Pada akhirnya, ini adalah tren yang sangat tipikal mengikuti strategi. crossover EMA ganda dengan stop loss dinamis dapat secara efektif mengunci keuntungan tren. Sementara itu risiko seperti sinyal tertinggal dan stop overwide masih ada. melalui penyesuaian parameter, manajemen risiko, penambahan filter dll, penyempurnaan lebih lanjut dapat mengarah pada hasil yang lebih baik.
/*backtest
start: 2023-12-01 00:00:00
end: 2023-12-31 23:59:59
period: 1h
basePeriod: 15m
exchanges: [{"eid":"Futures_Binance","currency":"BTC_USDT"}]
*/

//@version=5

strategy("EMA Crossover Strategy", shorttitle="EMAC", overlay=true,calc_on_every_tick=true)

// Input parameters
shortEmaLength = input(5, title="Short EMA Length")
longEmaLength = input(20, title="Long EMA Length")
priceEmaLength = input(1, title="Price EMA Length")

// Set stop loss level with input options (optional)
longLossPerc = input.float(0.05, title="Long Stop Loss (%)",
     minval=0.0, step=0.1) * 0.01

shortLossPerc = input.float(0.05, title="Short Stop Loss (%)",
     minval=0.0, step=0.1) * 0.01

// Calculating indicators
shortEma = ta.ema(close, shortEmaLength)
longEma = ta.ema(close, longEmaLength)
//priceEma = ta.ema(close, priceEmaLength)
vwap = ta.vwap(close)

// Long entry conditions
longCondition = ta.crossover(shortEma, longEma) and close > vwap
// Short entry conditions
shortCondition = ta.crossunder(shortEma, longEma) and close > vwap

// STEP 2:
// Determine stop loss price
longStopPrice  = strategy.position_avg_price * (1 - longLossPerc)
shortStopPrice = strategy.position_avg_price * (1 + shortLossPerc)


if (longCondition)
    strategy.entry("Enter Long", strategy.long)
    strategy.exit("Exit Long",from_entry = "Enter Long",stop= longStopPrice)
plotshape(series=longCondition, title="Long Signal", color=color.green, style=shape.triangleup, location=location.belowbar)


if (shortCondition)
    strategy.entry("Enter Short", strategy.short)
    strategy.exit("Exit Short", from_entry = "Enter Short",stop = shortStopPrice)
plotshape(series=shortCondition, title="Short Signal", color=color.red, style=shape.triangledown, location=location.abovebar)

// Stop loss levels
//longStopLoss = (1 - stopLossPercent) * close
//shortStopLoss = (1 + stopLossPercent) * close

// Exit conditions
//strategy.exit("Long", from_entry="Long", loss=longStopLoss)
//strategy.exit("Short", from_entry="Short", loss=shortStopLoss)

// Plotting indicators on the chart
plot(shortEma, color=color.yellow, title="Short EMA")
plot(longEma, color=color.green, title="Long EMA")
plot(close, color=color.black, title="Close")
plot(vwap, color=color.purple, title="VWAP")

// Plot stop loss values for confirmation
plot(strategy.position_size > 0 ? longStopPrice : na,
     color=color.red, style=plot.style_line,
     linewidth=2, title="Long Stop Loss")

plot(strategy.position_size < 0 ? shortStopPrice : na,
     color=color.blue, style=plot.style_line,
     linewidth=2, title="Short Stop Loss")
// Plotting stop loss lines
//plot(longStopLoss, color=color.red, title="Long Stop Loss", linewidth=2, style=plot.style_line)
//plot(shortStopLoss, color=color.aqua, title="Short Stop Loss", linewidth=2, style=plot.style_line)
Lebih banyak
- Strategi Arbitrage lintas siklus berdasarkan beberapa indikator
- Strategi Bollinger Band breakout adalah strategi mengejar momentum yang hanya panjang
- Strategi perdagangan kuantitatif kemenangan yang sempurna berdasarkan indikator BB ganda dan RSI
- Strategi Stop Loss dan Take Profit berbasis RSI
- Strategi Penembusan Saluran Rata-rata yang Bergerak
- Strategi pengujian breakback waktu tetap
- Strategi MACD Multi Timeframe yang Dioptimalkan Waktu dan Ruang
- Strategi perdagangan kuantitatif berdasarkan Stock RSI dan MFI
- Strategi perdagangan komposit multi-indikator
- Strategi perdagangan jangka pendek EMA lintas
- Bursa Bursa Breakout Darvas Box Beli Strategi
- Strategi momentum relatif
- Tren Gelombang dan Tren Berbasis VWMA Mengikuti Strategi Quant
- Strategi Crossover Rata-rata Bergerak
- Market Cypher Wave B Strategi Perdagangan Otomatis
- Strategi Pembalikan Kunci Backtest