Strategi fluktuasi adaptif berdasarkan terobosan rentang kuantitatif
Penulis:ChaoZhang, Tanggal: 2024-02-22 16:50:46Tag:

Gambaran umum
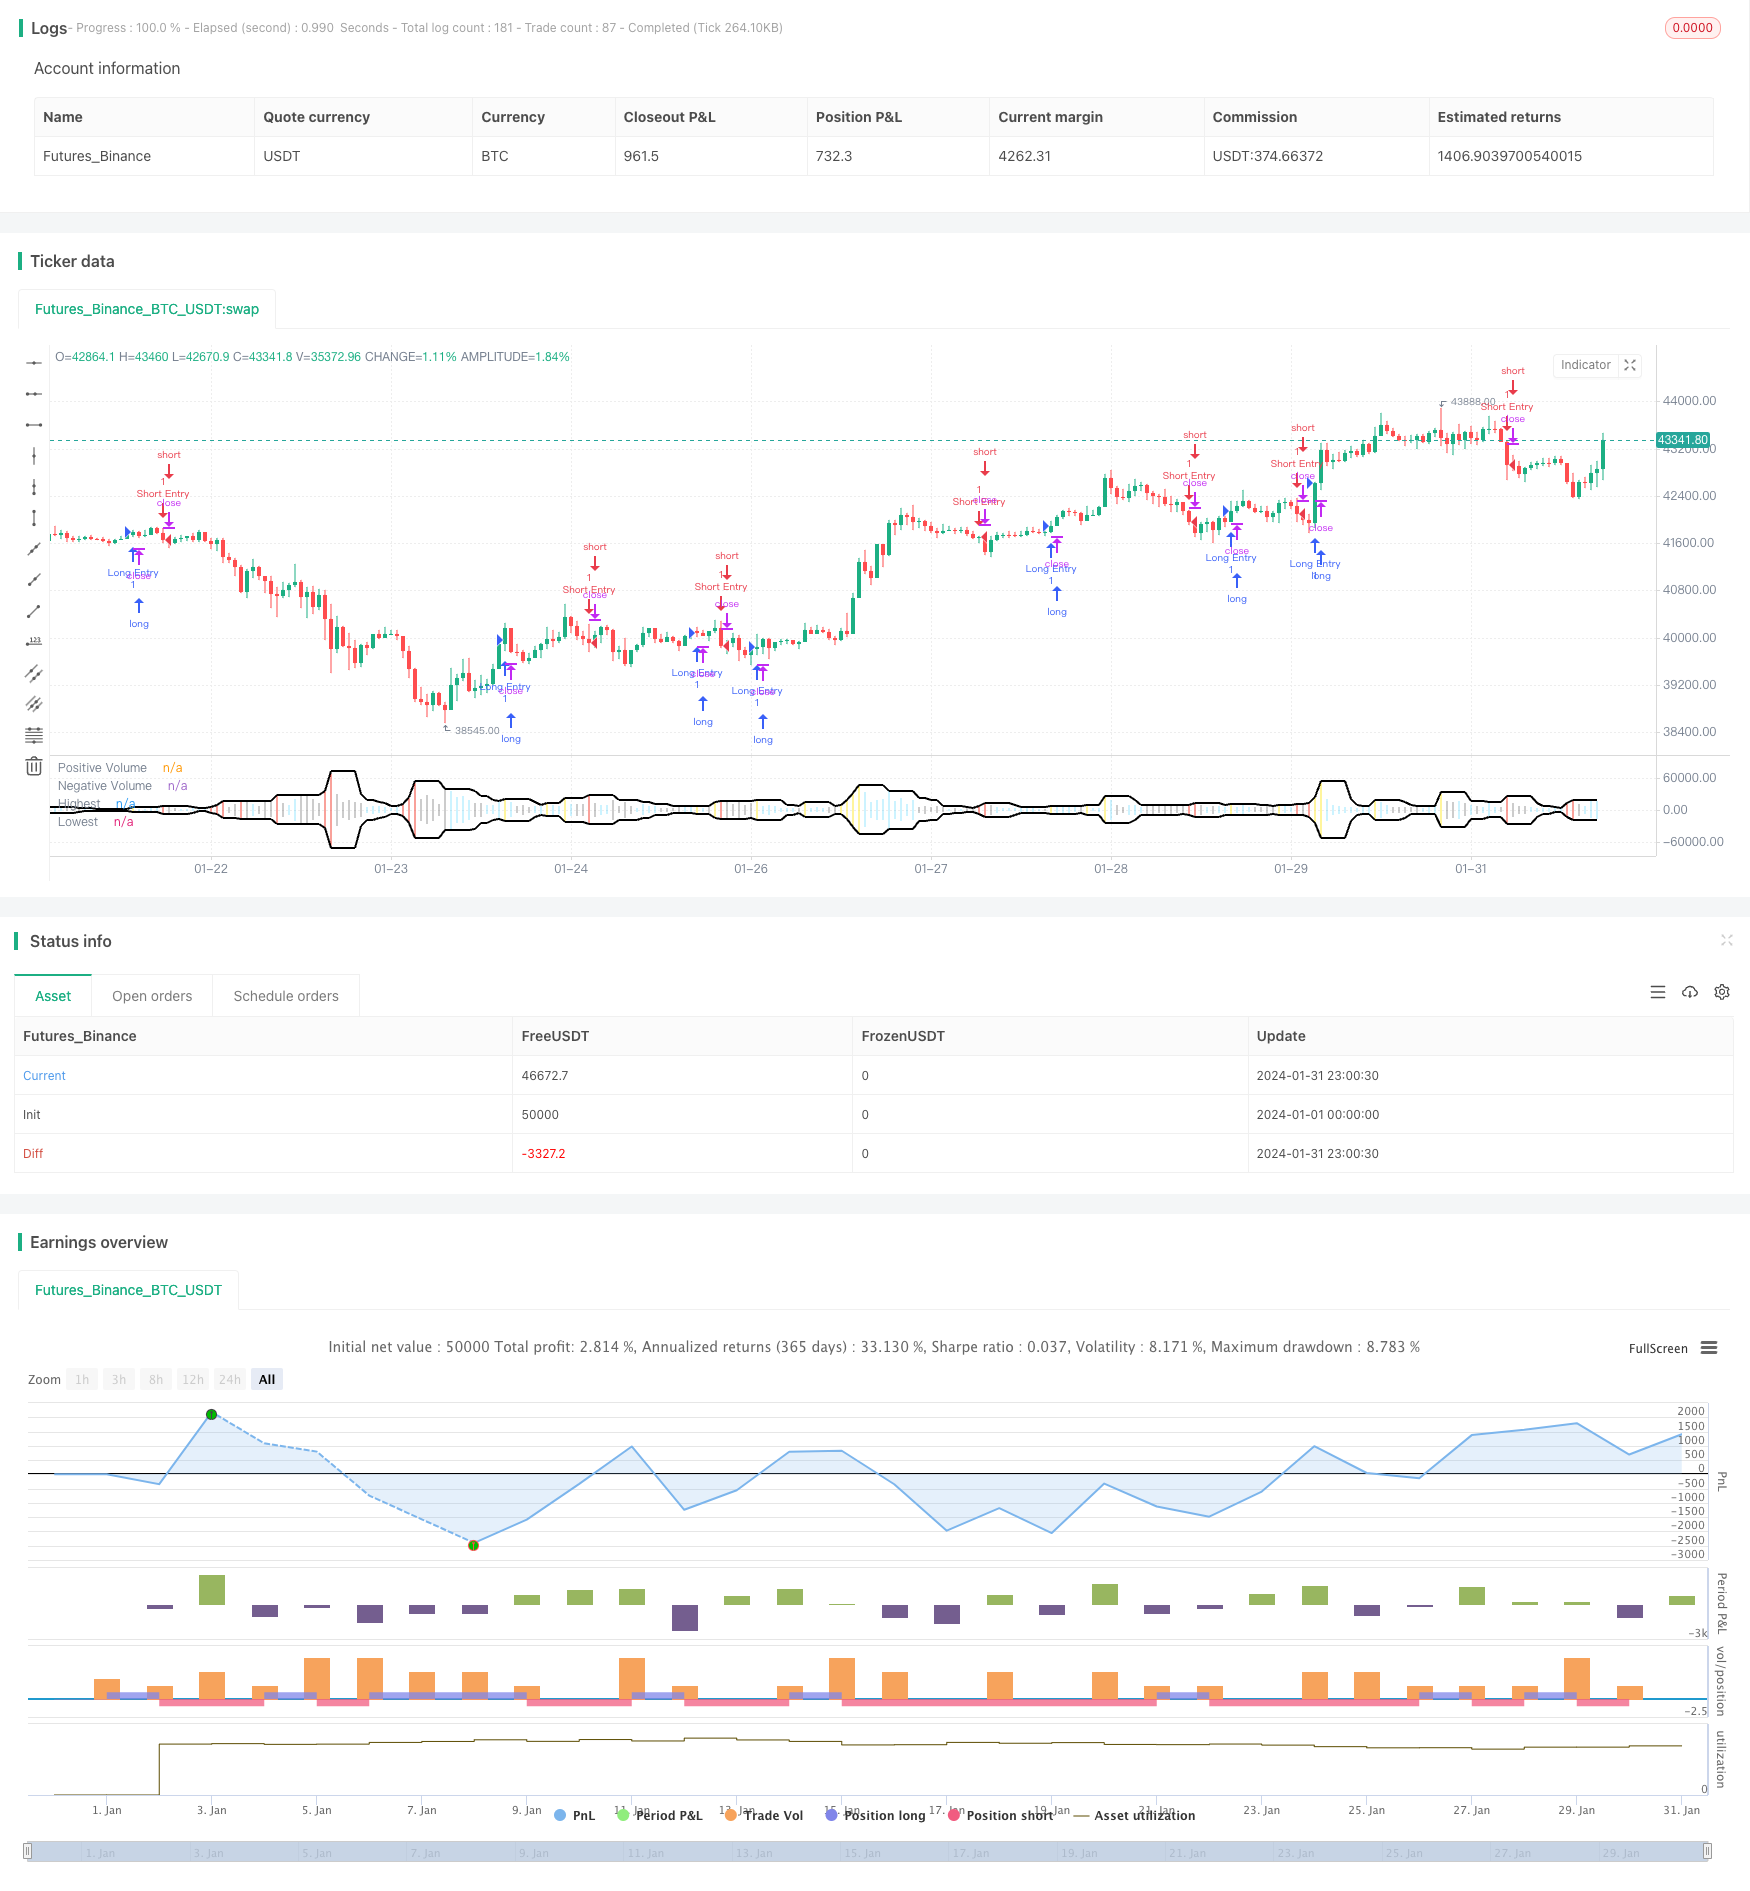
Strategi ini menghitung volume transaksi tertinggi dan terendah selama periode terakhir tertentu untuk membentuk kisaran fluktuasi adaptif. Ketika volume transaksi siklus saat ini menembus kisaran ini, sinyal perdagangan dihasilkan. Arah sinyal ditentukan oleh candlestick Yin Yang, yang merupakan strategi sederhana dan efektif untuk melacak transaksi tunggal besar tiba-tiba di pasar.
Logika Strategi
Logika inti adalah untuk menghitung nilai tertinggi dan terendah dari volume transaksi positif dan negatif dalam N siklus terbaru untuk membentuk kisaran fluktuasi adaptif. Tentukan apakah terobosan terjadi pada periode saat ini berdasarkan kisaran ini sambil memperhitungkan sinyal garis Yin Yang untuk menyelesaikan penilaian.
Proses perhitungan spesifik adalah:
- Menghitung volume transaksi tertinggi tertinggi dan volume transaksi terendah Terendah dalam N siklus terbaru
- Tentukan apakah volume transaksi Volume siklus saat ini lebih besar dari tertinggi
- Menggabungkan apakah lilin saat ini adalah Yin atau Yang untuk menyelesaikan penilaian sinyal terobosan
- Menghasilkan sinyal panjang dan pendek
Analisis Keuntungan
Keuntungan utama dari strategi ini adalah:
- Pengaturan rentang adaptif sensitif terhadap perubahan pasar
- Menangkap tren lonjakan volatilitas tinggi, mengurangi tingkat transaksi yang hilang
- Gabungkan penilaian bentuk lilin untuk menghindari terobosan palsu
- Mudah diterapkan dan dimodifikasi
- Parameter dapat disesuaikan dengan produk yang berbeda
Analisis Risiko
Strategi ini juga memiliki beberapa risiko:
- Cenderung untuk mengejar tinggi dan membunuh rendah, perlu menyesuaikan parameter untuk mengontrol
- Dapat sering menghasilkan sinyal palsu di pasar berosilasi siklus besar
- Tidak dapat membedakan terobosan normal dan abnormal, perlu memasukkan indikator atau pola lain untuk penilaian
- Hanya satu kesempatan masuk untuk setiap terobosan, tidak dapat melacak tren
Mengatur parameter siklus dan memasukkan indikator lain untuk penyaringan dapat dioptimalkan.
Arahan Optimasi
Strategi dapat dioptimalkan dengan beberapa cara:
- Meningkatkan interval untuk menyesuaikan panjang rentang sesuai dengan siklus pasar yang berbeda
- Menggabungkan MA, Bollinger Bands dll untuk menyaring sinyal
- Mengoptimalkan kombinasi dengan pola candlestick untuk menghindari sinyal palsu
- Tambahkan modul masuk kembali dan stop loss sehingga strategi dapat melacak tren
Ringkasan
Strategi ini secara keseluruhan sederhana dan praktis. Dengan menggabungkan analisis harga kisaran adaptif dan volume, dapat secara efektif menangkap pasar eksplosif satu sisi. Namun, ada juga risiko sinyal palsu tertentu, yang membutuhkan tweak parameter yang tepat dan alat pelengkap sebelum dapat mencapai dampak maksimum.
/*backtest
start: 2024-01-01 00:00:00
end: 2024-01-31 23:59:59
period: 1h
basePeriod: 15m
exchanges: [{"eid":"Futures_Binance","currency":"BTC_USDT"}]
*/

// This source code is subject to the terms of the Mozilla Public License 2.0 at https://mozilla.org/MPL/2.0/
// © EvoCrypto

//@version=4
strategy("Ranged Volume Strategy - evo", shorttitle="Ranged Volume", format=format.volume)

// INPUTS {
Range_Length    =   input(5,        title="Range Length",                       minval=1)

Heikin_Ashi     =   input(true,     title="Heikin Ashi Colors")
Display_Bars    =   input(true,     title="Show Bar Colors")
Display_Break   =   input(true,     title="Show Break-Out")
Display_Range   =   input(true,     title="Show Range")
// }

// SETTINGS {
Close           =   Heikin_Ashi ? security(heikinashi(syminfo.tickerid), timeframe.period, close)    : close
Open            =   Heikin_Ashi ? security(heikinashi(syminfo.tickerid), timeframe.period, open)     : open

Positive        =    volume
Negative        =   -volume

Highest         =   highest(volume, Range_Length)
Lowest          =   lowest(-volume, Range_Length)

Up              =   Highest > Highest[1] and Close > Open
Dn              =   Highest > Highest[1] and Close < Open

Volume_Color    =
 Display_Break and Up   ? color.new(#ffeb3b, 0)     :
 Display_Break and Dn   ? color.new(#f44336, 0)     :
 Close > Open           ? color.new(#00c0ff, 60)    :
 Close < Open           ? color.new(#000000, 60)    : na
// }

//PLOTS {
plot(Positive,                      title="Positive Volume",    color=Volume_Color,             style=plot.style_histogram,  linewidth=4)
plot(Negative,                      title="Negative Volume",    color=Volume_Color,             style=plot.style_histogram,  linewidth=4)

plot(Display_Range ? Highest : na,  title="Highest",            color=color.new(#000000, 0),    style=plot.style_line,       linewidth=2)
plot(Display_Range ? Lowest  : na,  title="Lowest",             color=color.new(#000000, 0),    style=plot.style_line,       linewidth=2)

barcolor(Display_Bars ? Volume_Color : na)
// }

if (Up)
    strategy.entry("Long Entry", strategy.long)
if (Dn)
    strategy.entry("Short Entry", strategy.short)
- Strategi Perdagangan Cryptocurrency Sederhana Berdasarkan RSI
- Strategi Perdagangan Kuantitatif Berdasarkan Price Crossover dengan SMA
- Strategi crossover rata-rata bergerak ganda dengan stop loss dan take profit
- Strategi Pelacakan Momentum dan Tren
- Tren Mengikuti Strategi Berdasarkan Garis MA
- Tren Mengikuti Strategi Berdasarkan Bollinger Bands
- Strategi Terobosan Osilasi
- Adaptive Moving Average Trading Strategy (Strategi Perdagangan Rata-rata Bergerak yang Adaptif)
- RSI Golden Cross Pendek Strategi
- Strategi Pelacakan Tren Kombinasi Rata-rata Bergerak dan Bollinger Band
- Bull Flag Breakout Strategi
- Strategi perdagangan lintas rata-rata bergerak
- Strategi Perdagangan Emas Crossover Moving Average
- EMA dan MACD Trend Mengikuti Strategi
- Strategi perdagangan MACD Crossover Moving Average
- Strategi Pembalikan Tren Super Harian
- Strategi Crossover EMA Dual
- Strategi Pelacakan Tren Berdasarkan Indikator RSI dan ZigZag
- Strategi Penembusan Rata-rata Bergerak Crossover
- Momentum Breakout Backtesting Dukungan Resistensi Strategi