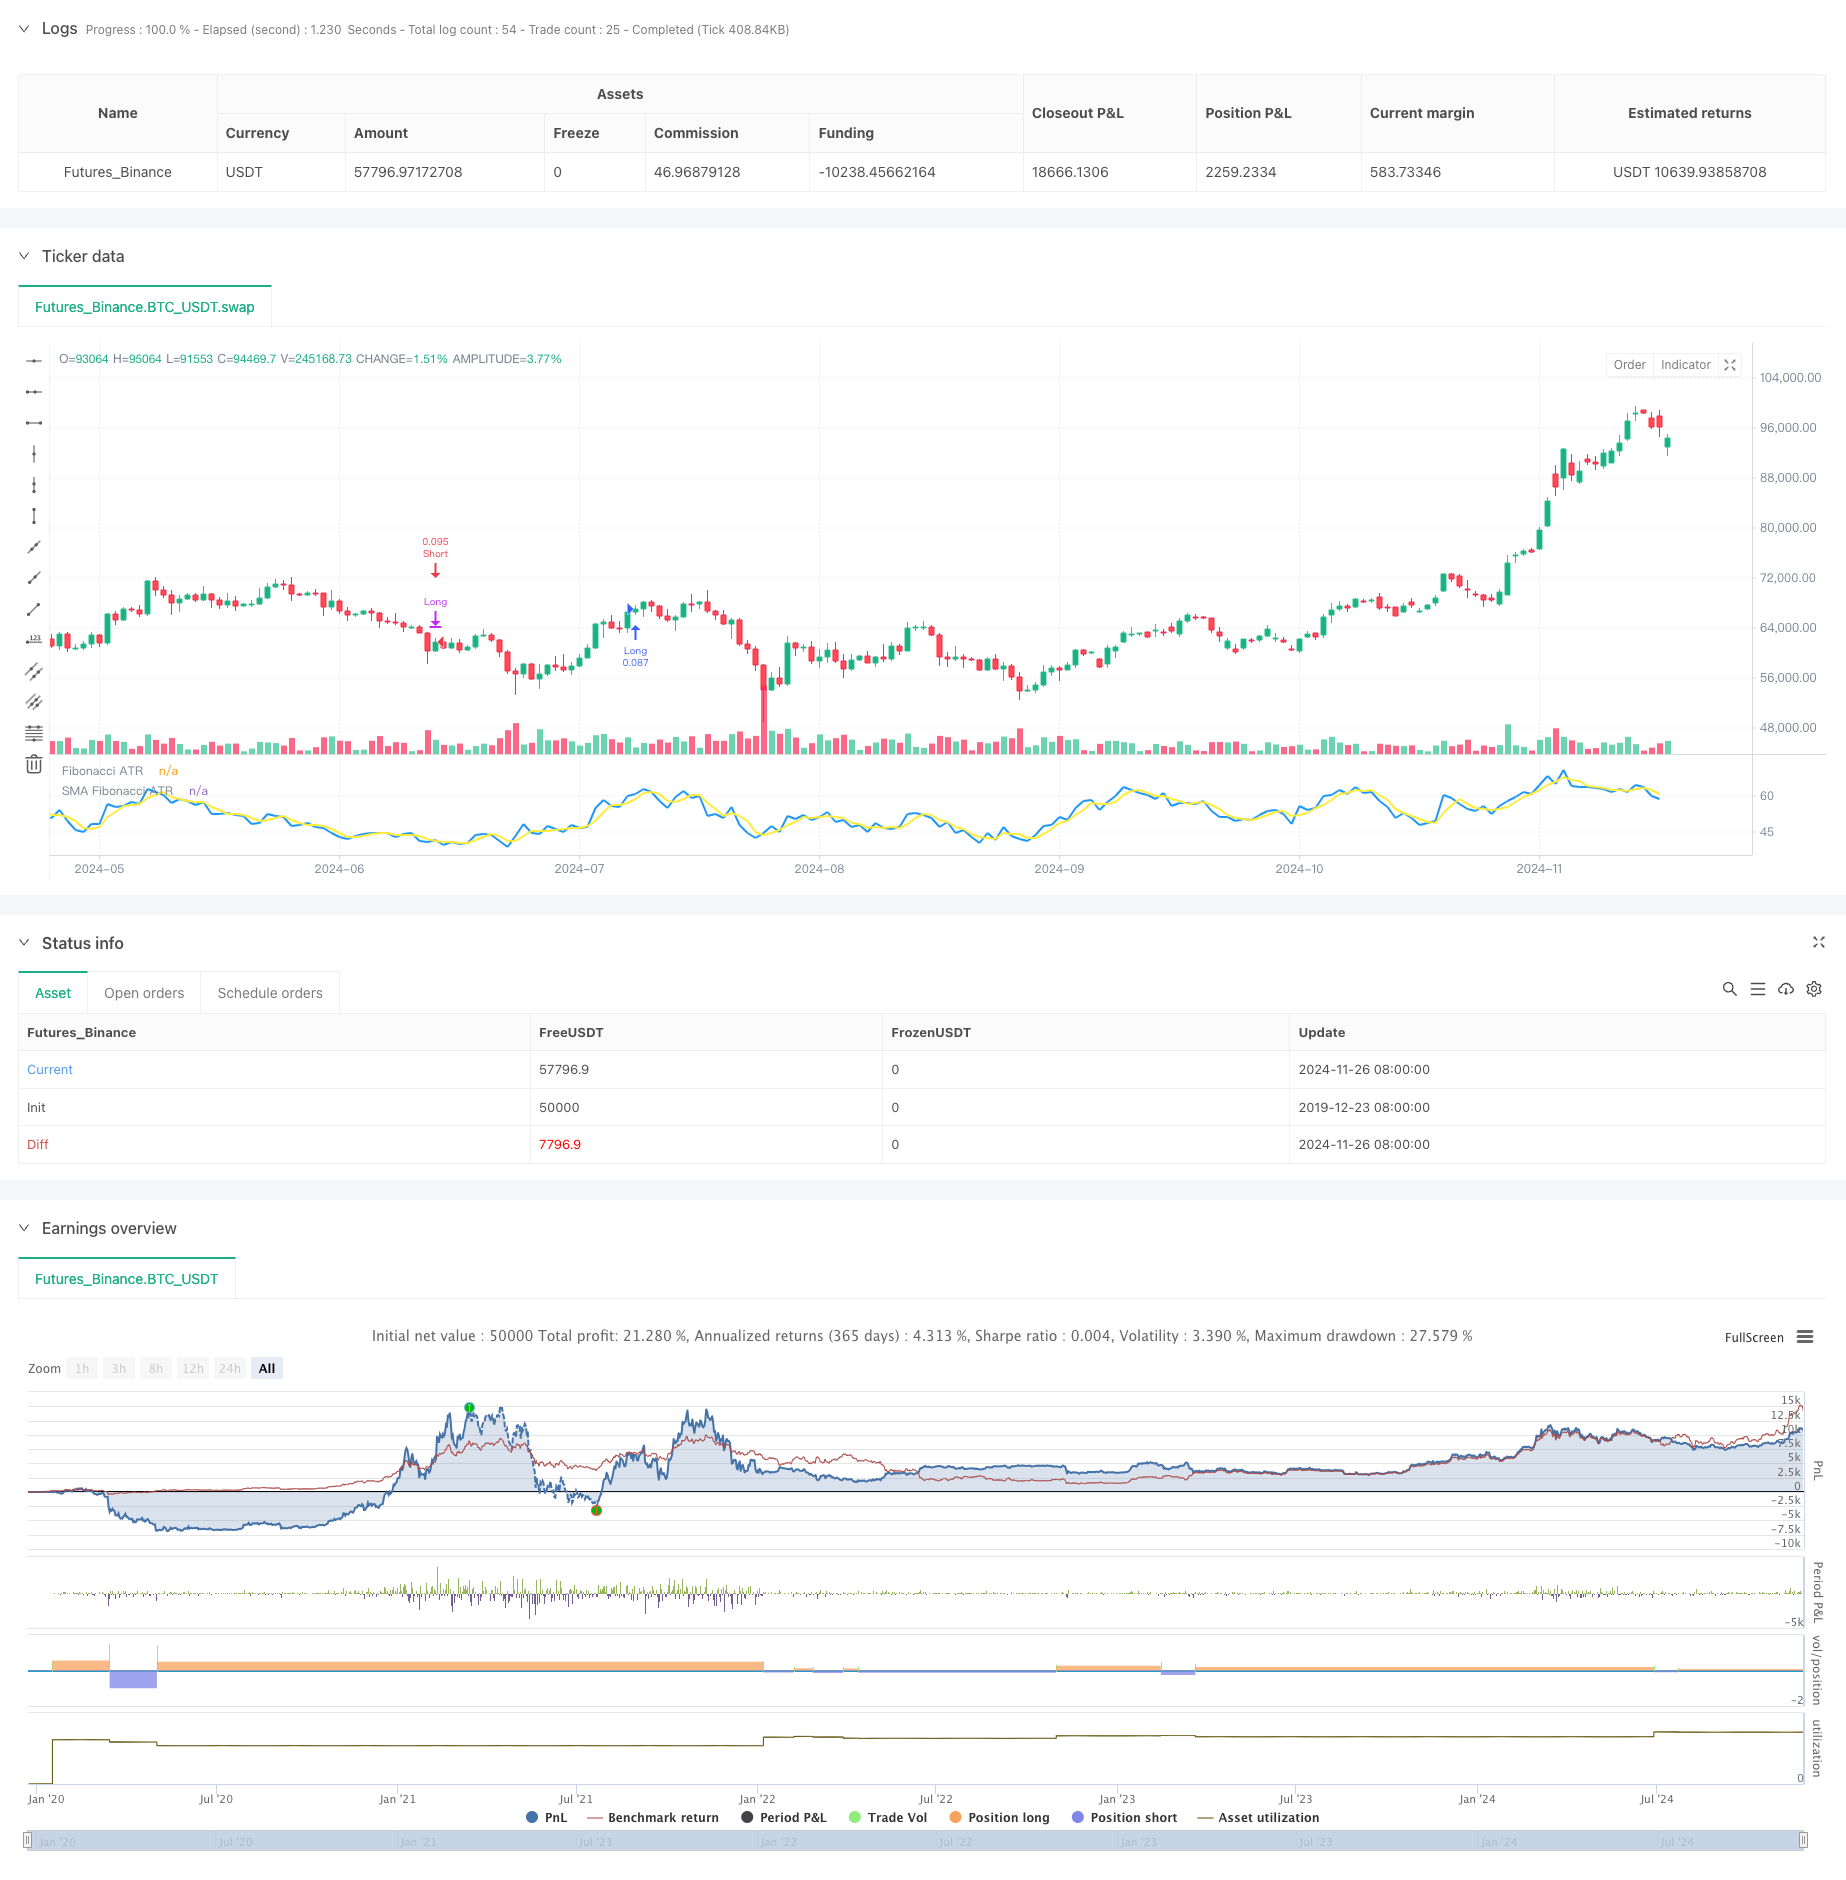
Ringkasan
Strategi ini adalah sistem pelacakan tren canggih yang didasarkan pada ATR dan Fibonacci series weighted. Dengan menggabungkan analisis volatilitas dari beberapa periode waktu dengan Fibonacci weighted average, strategi ini membangun model perdagangan yang responsif dan adaptif. Inti dari strategi ini adalah untuk menangkap tren pasar dengan lebih baik melalui alokasi bobot dinamis, dan menggunakan ATR untuk mencapai keuntungan yang tepat.
Prinsip Strategi
Strategi ini menggunakan kombinasi indikator teknis bertingkat: pertama, menghitung rentang fluktuasi aktual (TR) dan tekanan beli (BP), kemudian menghitung rasio tekanan untuk setiap siklus berdasarkan siklus waktu berangka Fibonacci (8, 13, 21, 34, 55). Membangun rata-rata tertimbang dengan menerapkan bobot yang berbeda pada siklus yang berbeda (5, 4, 3, 2, 1), dan selanjutnya menerapkan pemrosesan rata-rata SMA 3 siklus. Sistem ini memicu sinyal perdagangan berdasarkan perpotongan SMA dengan ambang batas yang telah ditentukan (58.0 dan 42.0), dan menggunakan ATR untuk merancang mekanisme profit-making empat langkah.
Keunggulan Strategis
- Analisis multi-dimensi: menggabungkan data dari beberapa periode waktu untuk memberikan pandangan pasar yang lebih komprehensif
- Adaptasi Dinamis: Adaptasi terhadap perubahan pasar melalui ATR untuk meningkatkan stabilitas strategi
- Keuntungan cerdas: mekanisme keuntungan empat langkah yang dapat disesuaikan secara fleksibel dalam berbagai kondisi pasar
- Mengontrol risiko: masuk dan keluar dengan kondisi yang jelas, mengurangi risiko dari penilaian subjektif
- Operasi sistematis: logika strategi jelas, mudah untuk diimplementasikan secara kuantitatif dan divalidasi ulang
Risiko Strategis
- Sensitivitas parameter: beberapa parameter threshold dan weight yang perlu disesuaikan dengan hati-hati
- Risiko keterlambatan: Smoothing SMA dapat menyebabkan keterlambatan sinyal
- Ketergantungan pada kondisi pasar: sinyal palsu yang mungkin muncul di pasar yang bergejolak
- Adaptasi parameter: parameter yang perlu dioptimalkan kembali dalam kondisi pasar yang berbeda Solusi: Optimasi dan pengujian parameter yang memadai disarankan, dan menyesuaikan parameter secara dinamis sesuai dengan fase pasar yang berbeda.
Arah optimasi strategi
- Adaptasi parameter: Mengembangkan mekanisme penyesuaian parameter adaptasi untuk meningkatkan adaptasi strategi
- Pemfilteran pasar: menambahkan modul identifikasi lingkungan pasar untuk melakukan transaksi dalam kondisi pasar yang sesuai
- Optimasi sinyal: memperkenalkan indikator konfirmasi tambahan untuk meningkatkan keandalan sinyal
- Peningkatan kontrol angin: menambahkan modul stop loss dan manajemen posisi dinamis
- Pengendalian penarikan: Tambahkan batas penarikan maksimum untuk meningkatkan stabilitas strategi
Meringkaskan
Strategi ini membangun sistem pelacakan tren yang komprehensif dengan mengintegrasikan teknologi ATR dan Fibonacci weighted average. Keunggulan strategi ini adalah analisis multi-dimensi dan kemampuan beradaptasi dinamis, tetapi juga perlu memperhatikan optimasi parameter dan penyaringan lingkungan pasar.
/*backtest
start: 2019-12-23 08:00:00
end: 2024-11-27 00:00:00
period: 1d
basePeriod: 1d
exchanges: [{"eid":"Futures_Binance","currency":"BTC_USDT"}]
*/

// This Pine Script™ code is subject to the terms of the Mozilla Public License 2.0 at https://mozilla.org/MPL/2.0/
// © PresentTrading

// The Fibonacci ATR Fusion Strategy is an advanced trading methodology that uniquely integrates Fibonacci-based weighted averages with the Average True Range (ATR) to
// identify and exploit significant market trends. Unlike traditional strategies that rely on single indicators or fixed parameters, this approach leverages multiple timeframes and
// dynamic volatility measurements to enhance accuracy and adaptability.

//@version=5
strategy("Fibonacci ATR Fusion - Strategy [presentTrading]", overlay=false, precision=3, commission_value= 0.1, commission_type=strategy.commission.percent, slippage= 1, currency=currency.USD, default_qty_type = strategy.percent_of_equity, default_qty_value = 10, initial_capital=10000)

// Calculate True High and True Low
tradingDirection = input.string(title="Trading Direction", defval="Both", options=["Long", "Short", "Both"])

// Trading Condition Thresholds
long_entry_threshold = input.float(58.0, title="Long Entry Threshold")
short_entry_threshold = input.float(42.0, title="Short Entry Threshold")
long_exit_threshold = input.float(42.0, title="Long Exit Threshold")
short_exit_threshold = input.float(58.0, title="Short Exit Threshold")

// Enable or Disable 4-Step Take Profit
useTakeProfit = input.bool(false, title="Enable 4-Step Take Profit")

// Take Profit Levels (as multiples of ATR)
tp1ATR = input.float(3.0, title="Take Profit Level 1 ATR Multiplier")
tp2ATR = input.float(8.0, title="Take Profit Level 2 ATR Multiplier")
tp3ATR = input.float(14.0, title="Take Profit Level 3 ATR Multiplier")

// Take Profit Percentages
tp1_percent = input.float(12.0, title="TP Level 1 Percentage", minval=0.0, maxval=100.0)
tp2_percent = input.float(12.0, title="TP Level 2 Percentage", minval=0.0, maxval=100.0)
tp3_percent = input.float(12.0, title="TP Level 3 Percentage", minval=0.0, maxval=100.0)

true_low = math.min(low, close[1])
true_high = math.max(high, close[1])

// Calculate True Range
true_range = true_high - true_low

// Calculate BP (Buying Pressure)
bp = close - true_low

// Calculate ratios for different periods
calc_ratio(len) =>
    sum_bp = math.sum(bp, len)
    sum_tr = math.sum(true_range, len)
    100 * sum_bp / sum_tr

// Calculate weighted average of different timeframes
weighted_avg = (5 * calc_ratio(8) + 4 * calc_ratio(13) + 3 * calc_ratio(21) + 2 * calc_ratio(34) + calc_ratio(55)) / (5 + 4 + 3 + 2 + 1)
weighted_avg_sma = ta.sma(weighted_avg,3)

// Plot the indicator
plot(weighted_avg, "Fibonacci ATR", color=color.blue, linewidth=2)
plot(weighted_avg_sma, "SMA Fibonacci ATR", color=color.yellow, linewidth=2)

// Define trading conditions
longCondition = ta.crossover(weighted_avg_sma, long_entry_threshold)  // Enter long when weighted average crosses above threshold
shortCondition = ta.crossunder(weighted_avg_sma, short_entry_threshold) // Enter short when weighted average crosses below threshold
longExit = ta.crossunder(weighted_avg_sma, long_exit_threshold)
shortExit = ta.crossover(weighted_avg_sma, short_exit_threshold)


atrPeriod = 14
atrValue = ta.atr(atrPeriod)

if (tradingDirection == "Long" or tradingDirection == "Both")
    if (longCondition)
        strategy.entry("Long", strategy.long)
        // Set Take Profit levels for Long positions
        if useTakeProfit
            tpPrice1 = strategy.position_avg_price + tp1ATR * atrValue
            tpPrice2 = strategy.position_avg_price + tp2ATR * atrValue
            tpPrice3 = strategy.position_avg_price + tp3ATR * atrValue
            // Close partial positions at each Take Profit level
            strategy.exit("TP1 Long", from_entry="Long", qty_percent=tp1_percent, limit=tpPrice1)
            strategy.exit("TP2 Long", from_entry="Long", qty_percent=tp2_percent, limit=tpPrice2)
            strategy.exit("TP3 Long", from_entry="Long", qty_percent=tp3_percent, limit=tpPrice3)
    if (longExit)
        strategy.close("Long")

if (tradingDirection == "Short" or tradingDirection == "Both")
    if (shortCondition)
        strategy.entry("Short", strategy.short)
        // Set Take Profit levels for Short positions
        if useTakeProfit
            tpPrice1 = strategy.position_avg_price - tp1ATR * atrValue
            tpPrice2 = strategy.position_avg_price - tp2ATR * atrValue
            tpPrice3 = strategy.position_avg_price - tp3ATR * atrValue
            // Close partial positions at each Take Profit level
            strategy.exit("TP1 Short", from_entry="Short", qty_percent=tp1_percent, limit=tpPrice1)
            strategy.exit("TP2 Short", from_entry="Short", qty_percent=tp2_percent, limit=tpPrice2)
            strategy.exit("TP3 Short", from_entry="Short", qty_percent=tp3_percent, limit=tpPrice3)
    if (shortExit)
        strategy.close("Short")