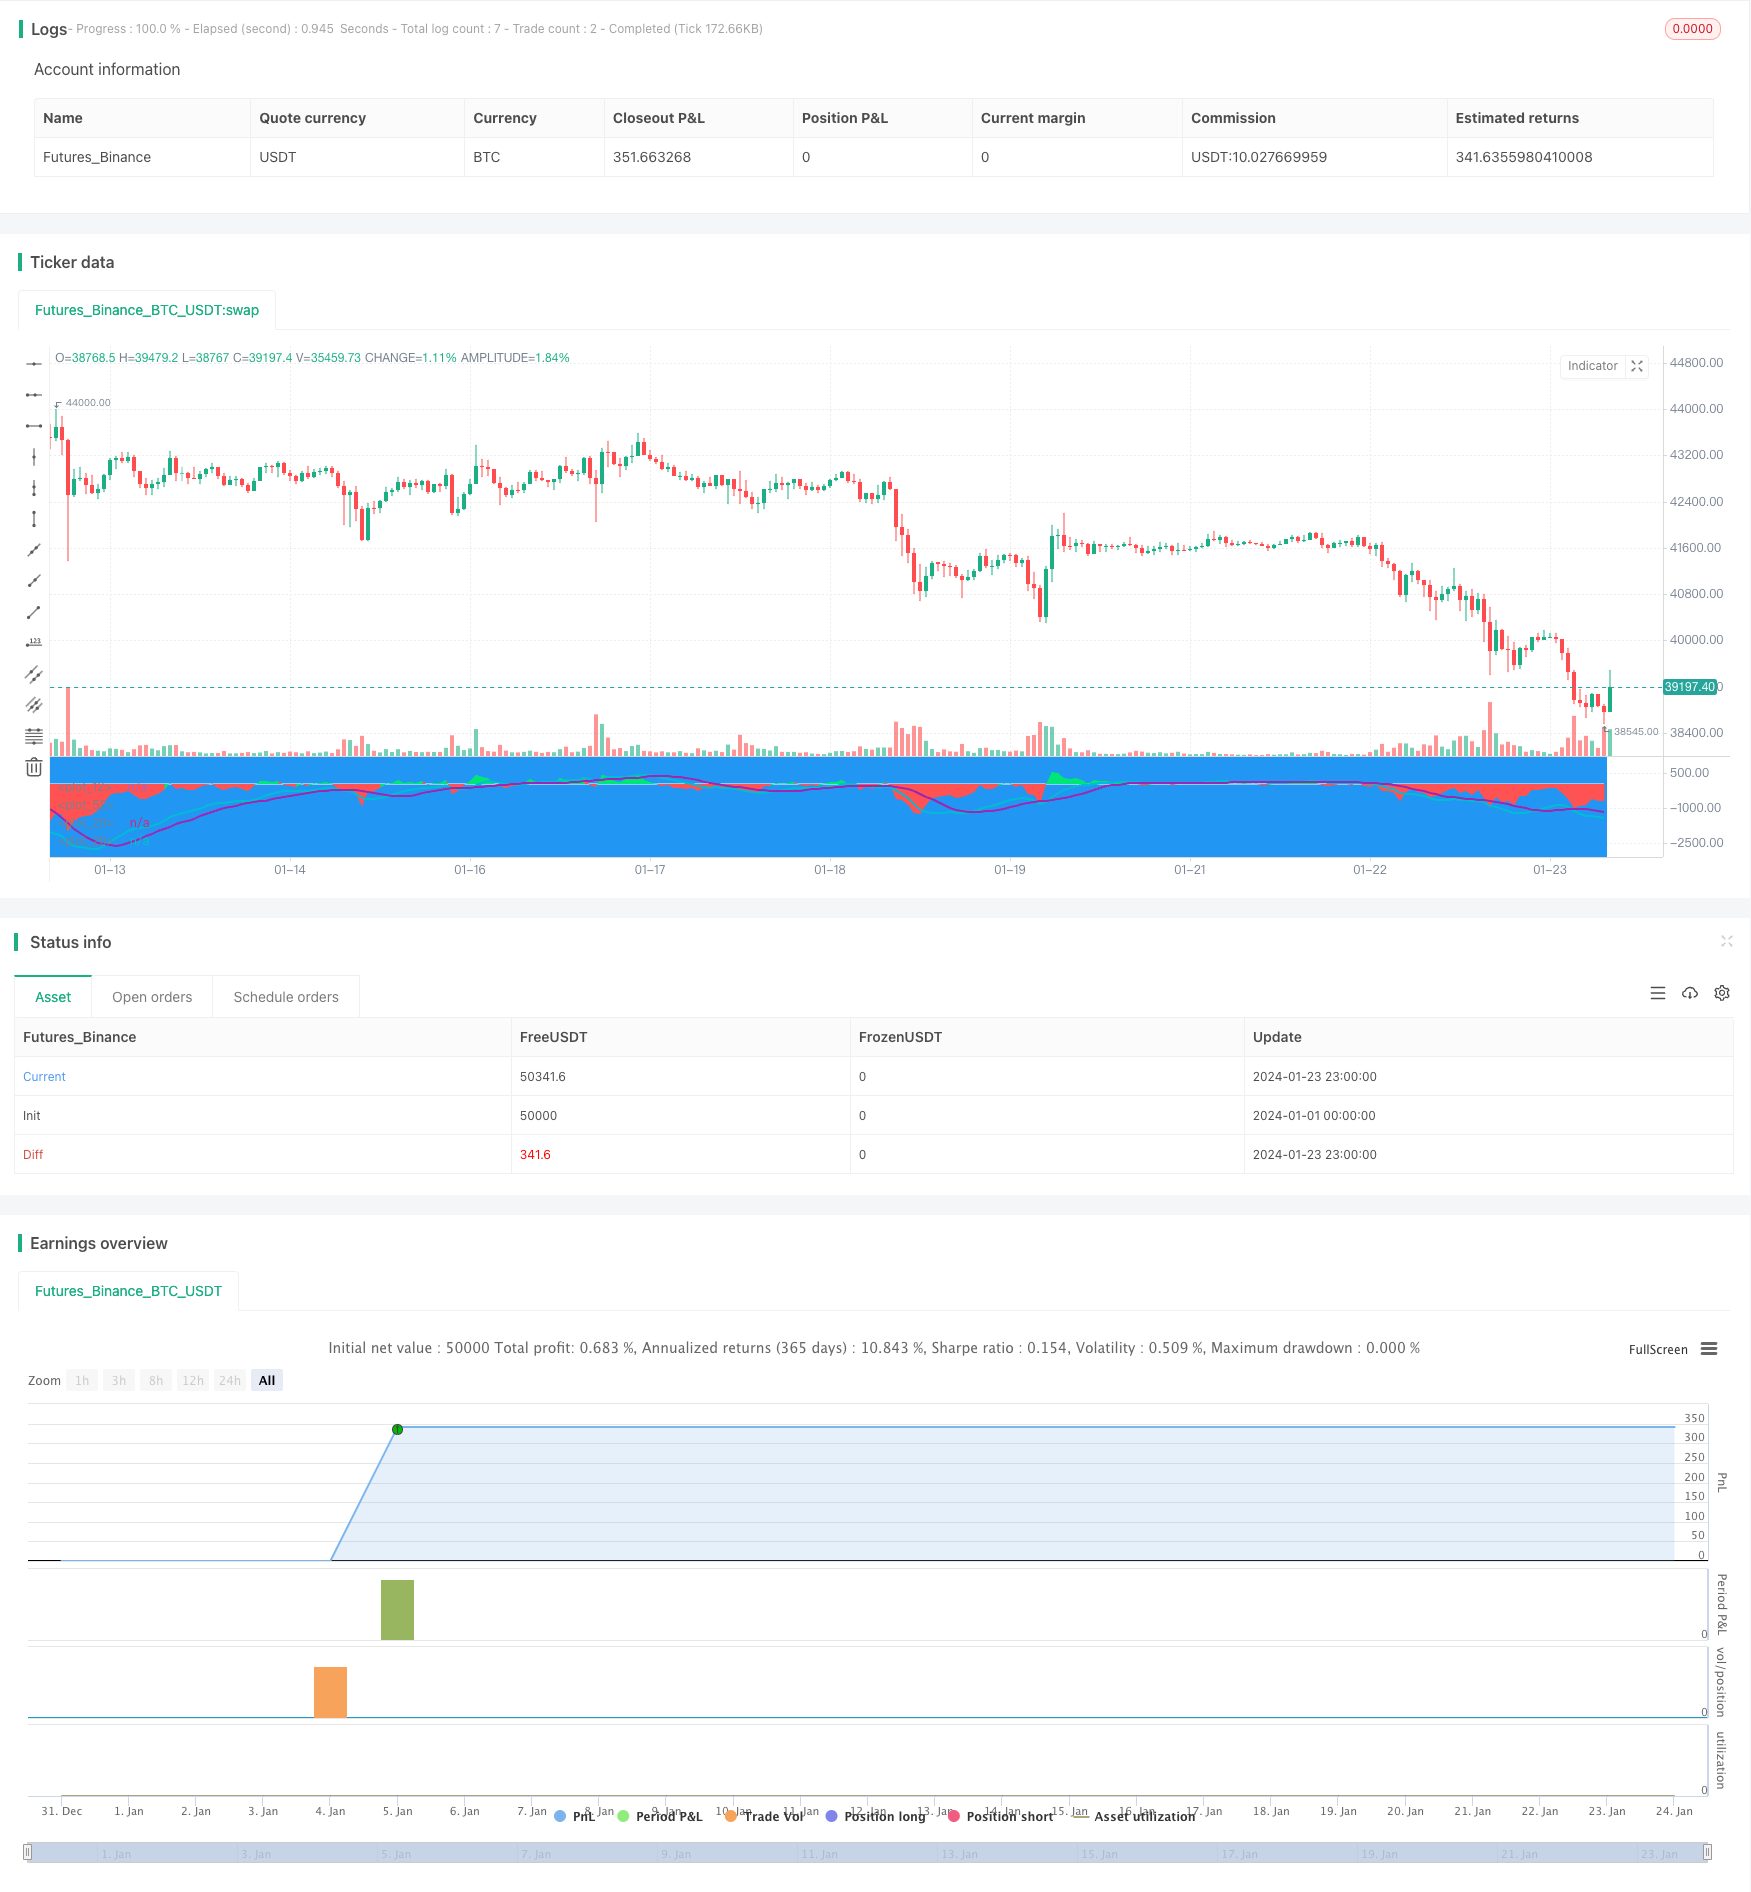
EMAとMACDに基づくBTC取引戦略
作者: リン・ハーンチャオチャン, 日付: 2024-01-25 12:54:16タグ:

概要
この戦略は,短期BTC取引のためのEMA差とMACD指標に基づいた複合戦略である.EMAとMACDからの信号を組み合わせ,特定の条件下で購入および販売信号を生成する.
戦略の論理
差がマイナスで
利点分析
- 複合指標を使用し,より信頼性の高い信号
- 短期取引に適した短期的なパラメータを採用します
- リスク制御のためにストップ・ロストと収益設定を行っています.
リスク分析
- ストップ・ロスは,巨大な市場の変動中に破られる可能性があります.
- パラメータは異なる市場環境に最適化する必要があります
- 効果は異なるコインや取引所でテストする必要があります
オプティマイゼーションの方向性
- BTCの変動に合わせて EMA と MACD パラメータを最適化
- 資本効率を向上させるために,ポジションサイズとピラミッド戦略を追加する
- リスクを減らすため,ストップ・ロスのストップ・ロスのようにストップ・ロスの方法を追加します.
- 異なる取引所とコインに対するテスト効果
結論
この戦略は,EMAとMACDの両方の指標の強みを統合し,複合信号を使用して誤った信号を効果的にフィルタリングする.最適化されたパラメータとポジション戦略により,安定したリターンを達成することができます.しかし,ストップロスのヒットなどのリスクは注意を払い,さらなるテストと改善が必要です.
/*backtest
start: 2024-01-01 00:00:00
end: 2024-01-24 00:00:00
period: 1h
basePeriod: 15m
exchanges: [{"eid":"Futures_Binance","currency":"BTC_USDT"}]
*/

//@version=3
strategy("EMA50Diff & MACD Strategy", overlay=false)
EMA = input(18, step=1)
MACDfast = input(12)
MACDslow = input(26)
EMADiffThreshold = input(8)
MACDThreshold = input(80)
TargetValidityThreshold = input(65, step=5)
Target = input(120, step=5)
StopLoss = input(650, step=5)
ema = ema(close, EMA)
hl = plot(0, color=white, linewidth=1)
diff = close - ema
clr = color(blue, transp=100)
if diff>0
    clr := lime
else
    if diff<0
        clr := red

fastMA = ema(close, MACDfast)
slowMA = ema(close, MACDslow)
macd = (fastMA - slowMA)*3
signal = sma(macd, 9)
plot(macd, color=aqua, linewidth=2)
plot(signal, color=purple, linewidth=2)

macdlong = macd<-MACDThreshold and signal<-MACDThreshold and crossover(macd, signal)
macdshort = macd>MACDThreshold and signal>MACDThreshold and crossunder(macd, signal)
position = 0.0
position := nz(strategy.position_size, 0.0)
long = (position < 0 and close < strategy.position_avg_price - TargetValidityThreshold and macdlong) or
     (position == 0.0 and diff < -EMADiffThreshold and diff > diff[1] and diff[1] < diff[2] and macdlong)

short = (position > 0 and close > strategy.position_avg_price + TargetValidityThreshold and macdshort) or
      (position == 0.0 and diff > EMADiffThreshold and diff < diff[1] and diff[1] > diff[2] and macdshort)
amount = (strategy.equity / close) //- ((strategy.equity / close / 10)%10)
bgclr = color(blue, transp=100) //#0c0c0c
if long
    strategy.entry("long", strategy.long, amount)
    bgclr := green
if short
    strategy.entry("short", strategy.short, amount)
    bgclr := maroon
bgcolor(bgclr, transp=20)
strategy.close("long", when=close>strategy.position_avg_price + Target)
strategy.close("short", when=close<strategy.position_avg_price - Target)
strategy.exit("STOPLOSS", "long", stop=strategy.position_avg_price - StopLoss)
strategy.exit("STOPLOSS", "short", stop=strategy.position_avg_price + StopLoss)
//plotshape(long, style=shape.labelup, location=location.bottom, color=green)
//plotshape(short, style=shape.labeldown, location=location.top, color=red)
pl = plot(diff, style=histogram, color=clr)
fill(hl, pl, color=clr)
もっと
- この戦略は,MACDヒストグラムのトレンドに基づいて取引の決定を下します.
- モメントオシレーター&123 パターン戦略
- フィッシャー変換指標に基づくバックテスト戦略
- 振動スペクトル移動平均取引戦略
- 移動平均範囲に基づく逆転取引戦略
- カルマンフィルターに基づくトレンド追跡戦略
- 季節性逆転 期間間取引戦略
- 二重指数関数移動平均クロスオーバーアルゴリズム取引戦略
- 多因子を持つ量的な取引戦略
- インテリジェント トレイリング ストップ ロス 戦略
- アダプティブ・ボラティリティ・ブレイク
- ピアスピンバー逆転戦略
- RSI インディケーターに基づくニフティ取引戦略
- RSI と EMA ベース トレンド フォロー 戦略
- トレンド確認追跡戦略
- RSI 差異指標戦略
- モメントム・ムービング・平均 konsolidiation 戦略
- トレンドフィルターに基づくQQEクロスオーバー取引戦略