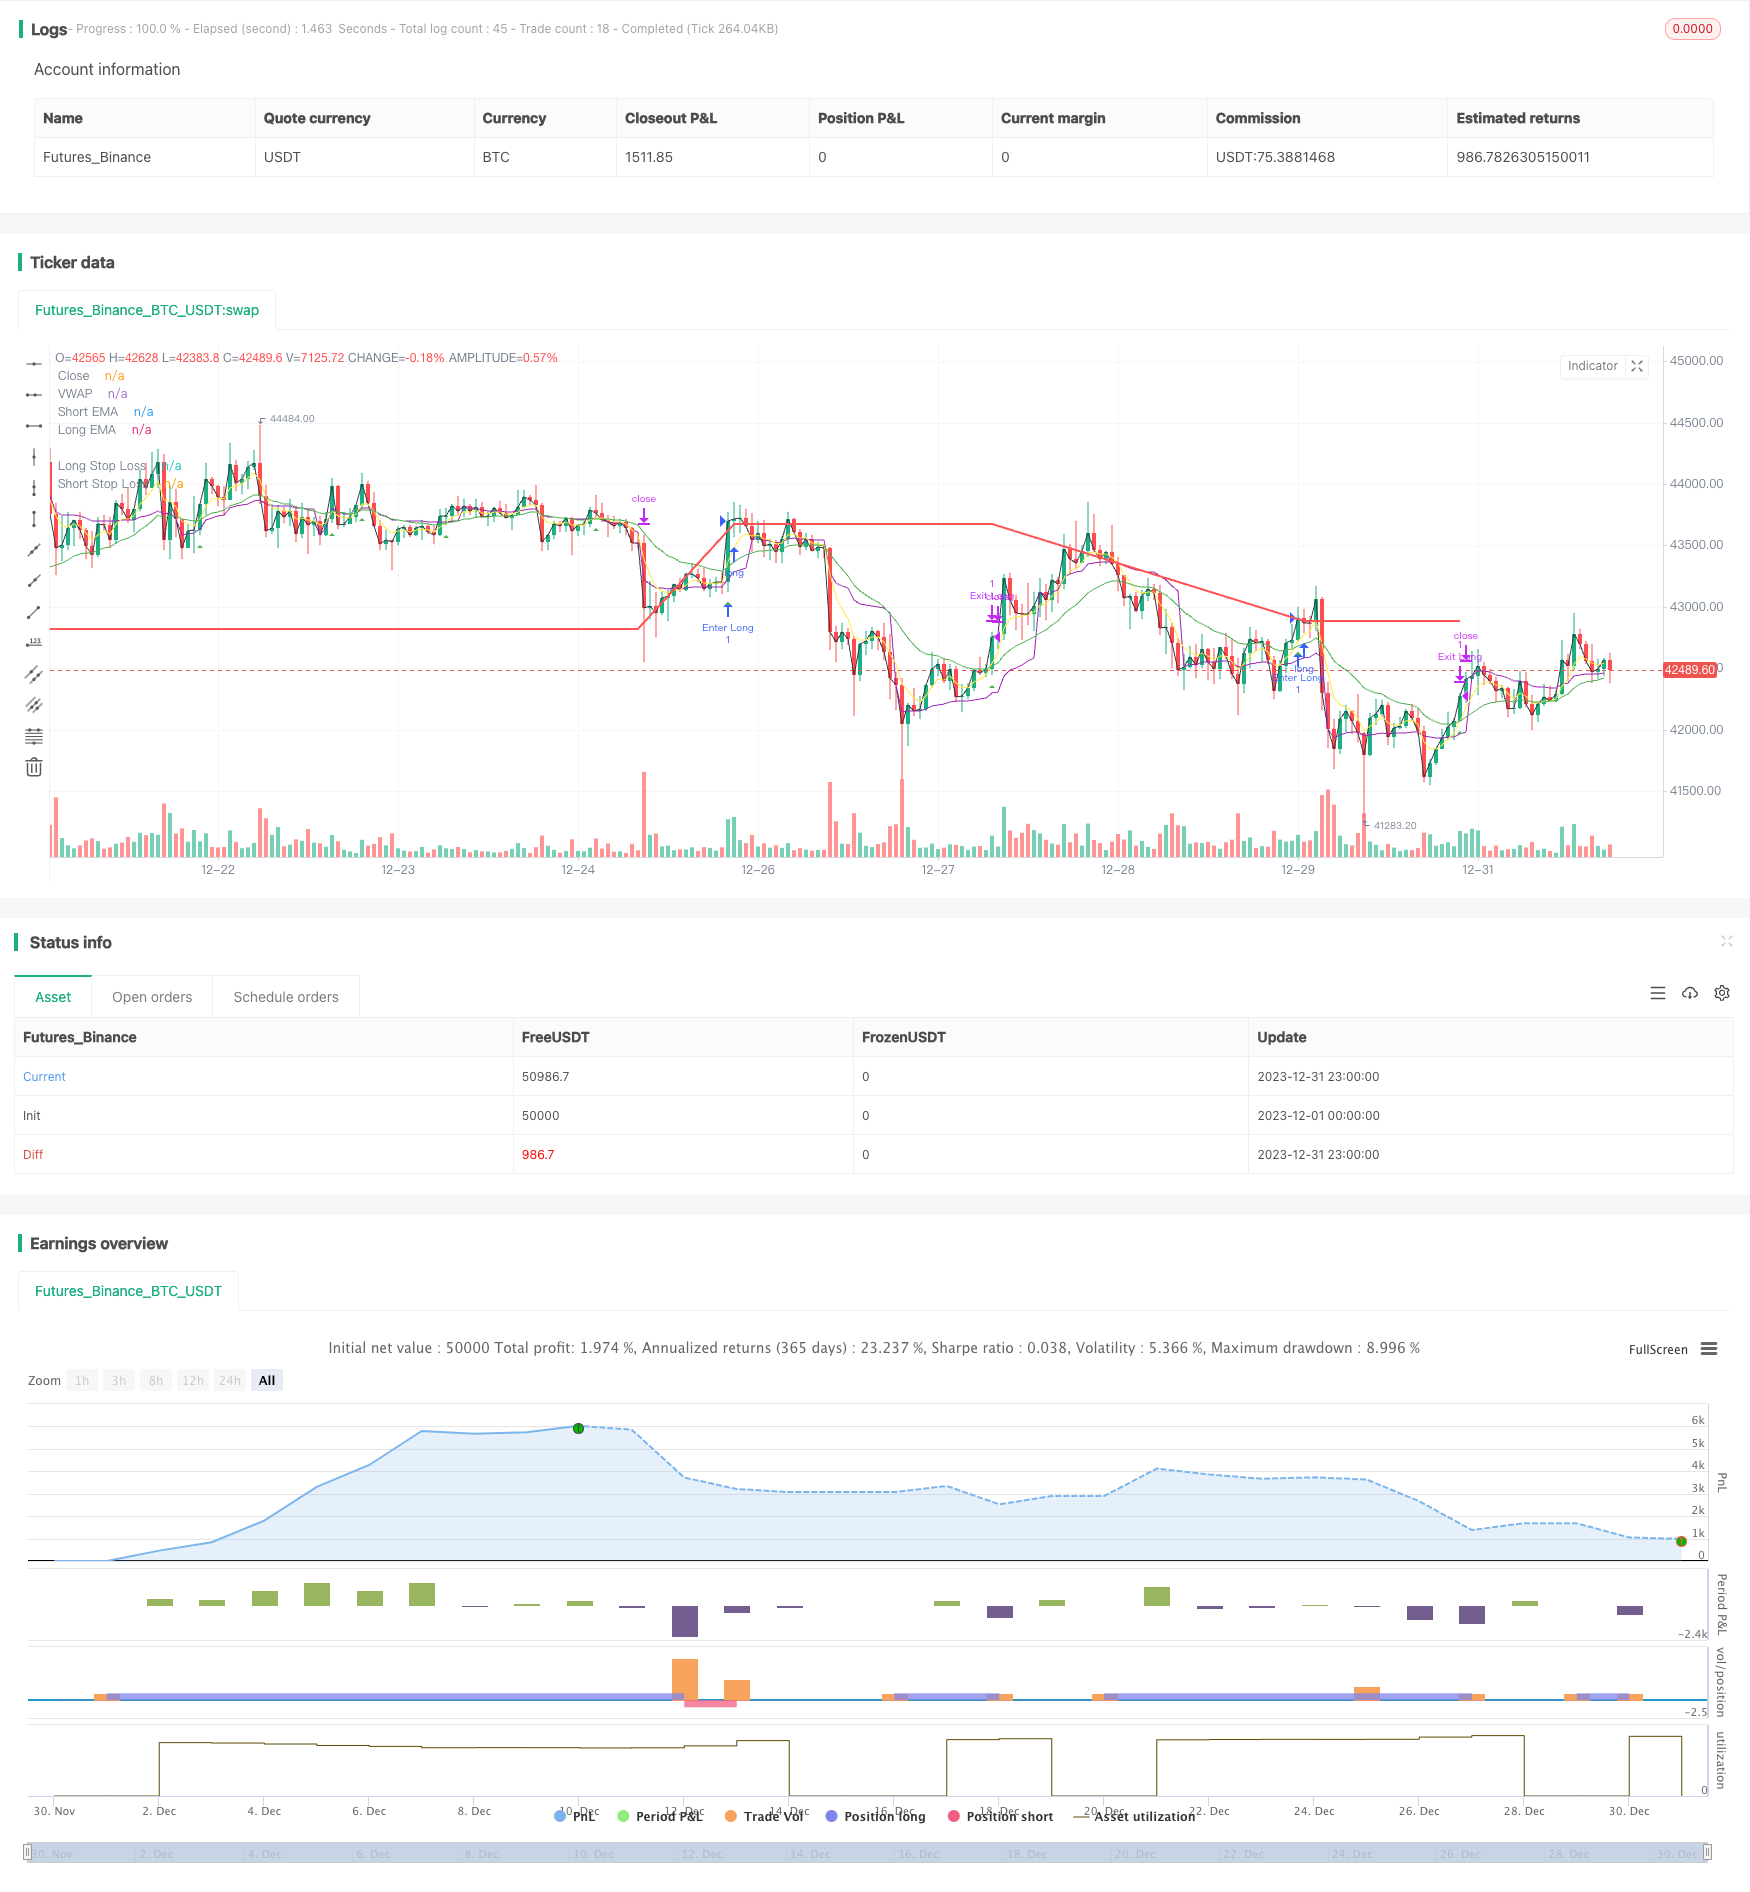
動的ストップロスの戦略をフォローする傾向
作者: リン・ハーンチャオチャン開催日:2024-01-29 09:57:20タグ:

概要
この戦略は,両方向のトレンドフォローのために EMAラインの黄金十字と死十字を利用し,市場のトレンド動きを把握するために,ロングとショートポジションのためのダイナミックストップ損失ラインを設定します.
戦略の論理
- 速度のEMA線 (5日) と遅度のEMA線 (20日) を計算する
- 低速線が低速線を横切る時,長引く.低速線が低速線を横切る時,短引く.
- ロング エントリー後,エントリー価格でダイナミックストップ・ロスを設定する * (1 - ロング・ストップ・ロスのパーセント);ショート エントリー後,エントリー価格でダイナミックストップ・ロスを設定する * (1 +ショート・ストップ・ロスのパーセント)
- 価格がストップロスのレベルに達するとストップロスの出口ポジション
利点分析
- EMA線はトレンドを追跡する能力が強くなっている.ダブルクロスオーバーはトレンド機会を効果的に捉えるためのタイミングツールとして機能する.
- 動的なストップ・ロスは利益とともに動いて,トレンド捕獲利益を最大化します
- vwap の追加フィルタ は,鞭
に 閉じ込め られ ない よう に し,信号 の 品質 を 改善 する
リスク分析
- 戦略に従う純粋なトレンドとして,それはウィップソーで市場を範囲に脆弱です
- ストップ損失が過度に緩い場合は,損失が大きくなることがあります.
- EMAのクロスオーバー信号の遅延性により,最良のエントリーポイントが逃れることがあります.
ATRベースのリスク管理,ストップロスのルールの最適化,フィルター指標の追加などの改善は戦略を改善するのに役立ちます.
改善の方向性
- より適性的なストップを設定するためにATRやDONCHのようなダイナミックストップ損失指標を組み込む
- MACD,KDJなどのフィルター指標を追加して,悪い取引を避ける
- 最適なEMA長さの組み合わせを見つけるためにパラメータを最適化
- 最適なパラメータを発見するために機械学習方法を活用する
結論
結論として,これは戦略に従う非常に典型的なトレンドである. 動的ストップロスの二重EMAクロスオーバーは,トレンド利益を効果的にロックすることができます. 一方,遅れの信号やオーバーワイドストップなどのリスクはまだ存在しています. パラメータチューニング,リスク管理,フィルター追加などを通じて,さらなる精製によりより良い結果が得られます.
/*backtest
start: 2023-12-01 00:00:00
end: 2023-12-31 23:59:59
period: 1h
basePeriod: 15m
exchanges: [{"eid":"Futures_Binance","currency":"BTC_USDT"}]
*/

//@version=5

strategy("EMA Crossover Strategy", shorttitle="EMAC", overlay=true,calc_on_every_tick=true)

// Input parameters
shortEmaLength = input(5, title="Short EMA Length")
longEmaLength = input(20, title="Long EMA Length")
priceEmaLength = input(1, title="Price EMA Length")

// Set stop loss level with input options (optional)
longLossPerc = input.float(0.05, title="Long Stop Loss (%)",
     minval=0.0, step=0.1) * 0.01

shortLossPerc = input.float(0.05, title="Short Stop Loss (%)",
     minval=0.0, step=0.1) * 0.01

// Calculating indicators
shortEma = ta.ema(close, shortEmaLength)
longEma = ta.ema(close, longEmaLength)
//priceEma = ta.ema(close, priceEmaLength)
vwap = ta.vwap(close)

// Long entry conditions
longCondition = ta.crossover(shortEma, longEma) and close > vwap
// Short entry conditions
shortCondition = ta.crossunder(shortEma, longEma) and close > vwap

// STEP 2:
// Determine stop loss price
longStopPrice  = strategy.position_avg_price * (1 - longLossPerc)
shortStopPrice = strategy.position_avg_price * (1 + shortLossPerc)


if (longCondition)
    strategy.entry("Enter Long", strategy.long)
    strategy.exit("Exit Long",from_entry = "Enter Long",stop= longStopPrice)
plotshape(series=longCondition, title="Long Signal", color=color.green, style=shape.triangleup, location=location.belowbar)


if (shortCondition)
    strategy.entry("Enter Short", strategy.short)
    strategy.exit("Exit Short", from_entry = "Enter Short",stop = shortStopPrice)
plotshape(series=shortCondition, title="Short Signal", color=color.red, style=shape.triangledown, location=location.abovebar)

// Stop loss levels
//longStopLoss = (1 - stopLossPercent) * close
//shortStopLoss = (1 + stopLossPercent) * close

// Exit conditions
//strategy.exit("Long", from_entry="Long", loss=longStopLoss)
//strategy.exit("Short", from_entry="Short", loss=shortStopLoss)

// Plotting indicators on the chart
plot(shortEma, color=color.yellow, title="Short EMA")
plot(longEma, color=color.green, title="Long EMA")
plot(close, color=color.black, title="Close")
plot(vwap, color=color.purple, title="VWAP")

// Plot stop loss values for confirmation
plot(strategy.position_size > 0 ? longStopPrice : na,
     color=color.red, style=plot.style_line,
     linewidth=2, title="Long Stop Loss")

plot(strategy.position_size < 0 ? shortStopPrice : na,
     color=color.blue, style=plot.style_line,
     linewidth=2, title="Short Stop Loss")
// Plotting stop loss lines
//plot(longStopLoss, color=color.red, title="Long Stop Loss", linewidth=2, style=plot.style_line)
//plot(shortStopLoss, color=color.aqua, title="Short Stop Loss", linewidth=2, style=plot.style_line)
もっと
- 複数の指標に基づいたクロスサイクル仲裁戦略
- ボリンジャー・バンドのブレイクアウト戦略は,長時間だけ動力を追求する戦略です.
- ダブルBB指標とRSIをベースにした無欠の勝利量的な取引戦略
- RSIに基づくストップ・ロスト・アンド・テイク・プロフィート戦略
- 移動平均チャネルブレイク戦略
- 固定時間分断テスト戦略
- 時間と空間を最適化したマルチタイムフレームMACD戦略
- ストックRSIとMFIをベースにした量的な取引戦略
- 多指標複合取引戦略
- クロスオーバー EMA 短期取引戦略
- ブールマーケットのブレイク ダルバス・ボックス・バイ・戦略
- 相対的な動力戦略
- 波動傾向とVWMAベースの傾向
- アダプティブ・トリプル・スーパートレンド戦略
- 移動平均のクロスオーバー戦略
- 重要な逆転バックテスト戦略
- 3つのEMAストカスティックRSIクロスオーバーゴールデンクロス戦略