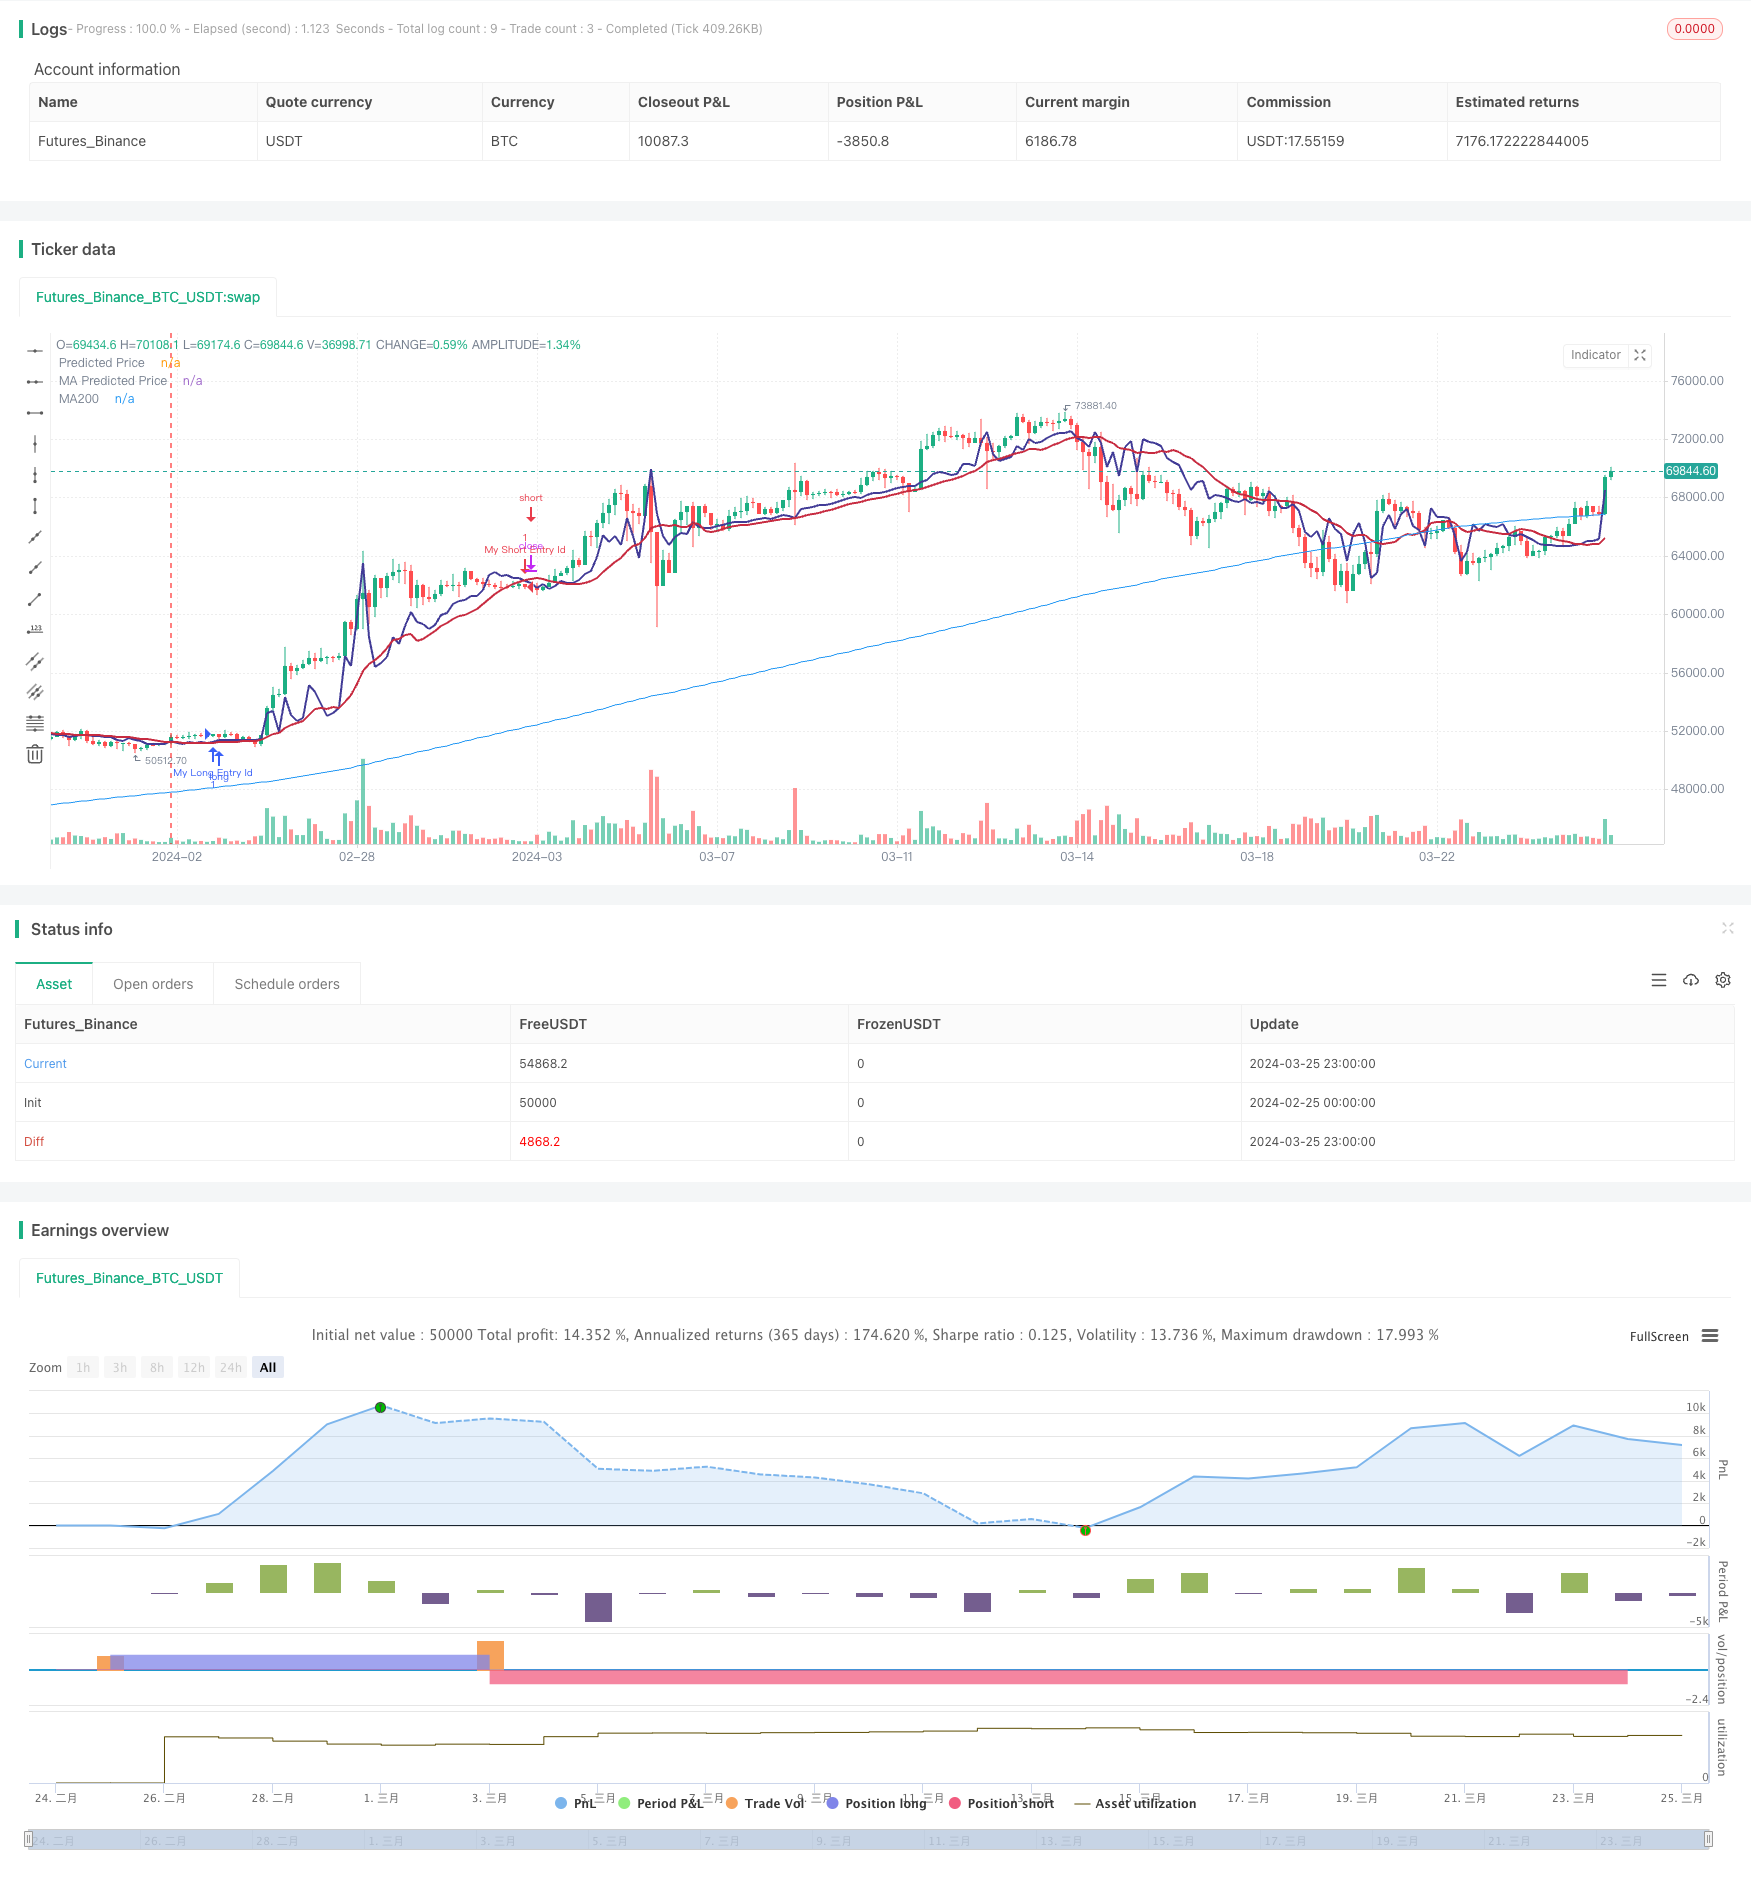
長短線形回帰クロスオーバー戦略
作者: リン・ハーンチャオチャン,日付: 2024-03-27 17:52:02タグ:

概要
ロング・ショート・リニアリ回帰クロスオーバー戦略 (Long-Short Linear Regression Crossover Strategy) は,株式の将来の価格動向を予測するためにリニアリ回帰モデルを使用する技術分析戦略である.戦略の基本原理は,株価格動向はしばしば一定の線形トレンドに従っており,価格の線形回帰を計算することで,将来の価格を予測することができる. 予測価格が現在の価格を超えると戦略はロングになり,下を横切るとポジションを退場する.
戦略の原則
ストラテジーは,まず,一定の期間における株式価格の線形回帰を計算する.線形回帰は,時間とともに価格の変化の傾向を表す最小正方形方法を使用して直線に適合する.その後,戦略は予測価格線とチャート上の現在の価格をプロットする.
戦略は2つの信号を定義しています
- ロング・シグナル: 予想価格が現在の価格を超えると発信されます.
- 短信号: 予想価格が現在の価格を下回るときに発生する
ロング・シグナルが表示されると,戦略はロング・ポジションを開く.ショート・シグナルが表示されると,ポジションを閉じる.
戦略の主要なステップは以下のとおりです.
- 価格の線形回帰を計算する
- 予測価格ラインとチャート上の現在の価格をプロット
- 長信号と短信号を定義する
- ロング・シグナルが起動するとロング・ポジションを開きます.
- ショート信号が起動すると位置を閉じる
利点を分析する
長期短期線形回帰クロスオーバー戦略には以下の利点があります.
- シンプルで効果的な: 戦略の論理は明確で実行が簡単で,価格の線形トレンドを捉えることができます.
- 広範囲に適用可能: 戦略は,トレンドとレンジングの両方の市場で取引信号を生成することができます.
- 優れた最適化能力: 戦略には,線形回帰期,移動平均等などのいくつかの重要なパラメータが含まれ,パフォーマンスを向上させるために最適化することができます.
リスク分析
長短線形回帰クロスオーバー戦略には多くの利点があるものの,いくつかのリスクもあります.
- トレンド認識リスク: 価格動きが線形的なトレンドに従わない場合,例えばレンジング市場では,戦略は誤った信号を生む可能性があります.このリスクは,MACDなどの他の指標と組み合わせることで軽減できます.
- パラメータ設定リスク: 戦略のパフォーマンスはパラメータ設定に敏感であり,不適切なパラメータは損失につながる可能性があります. したがって,ライブ取引前に十分なバックテストとパラメータの最適化が必要です.
- 過剰適合リスク:パラメータが過剰に最適化されている場合,戦略が歴史的なデータに過剰に適合し,将来的にパフォーマンスが低下する可能性があります.過剰適合を避ける方法は,単純に,サンプル外テストなどを含む.
オプティマイゼーションの方向性
- 他の指標と組み合わせ:線形回帰信号は,MACD,ボリンジャー帯など他の技術指標と組み合わせられ,信号の精度を向上させることができます.
- ダイナミックパラメータ最適化:パラメータのための適応メカニズムが設計され,市場状況に応じてパラメータをダイナミックに調整し,適応性を向上させる.
- リスク管理モジュールを追加する: ストップ・ロストやマネーマネジメントなどのリスク管理措置を戦略に組み込むことで,単一の取引のリスクを軽減し,累積的収益を高める.
- 機械学習最適化:機械学習アルゴリズムは,直線回帰モデルを継続的に最適化して予測をより正確にするのに使用できます.
概要
ロングショートリグレッション・クロスオーバー戦略は,線形リグレッションと現在の価格から予想価格を比較した取引信号を生成する.戦略の論理はシンプルで明確で,価格の線形トレンドを把握し,さまざまな市場状況に適用することができる.同時に,戦略は実行し最適化しやすく,パラメータを柔軟に調整し,他の指標と組み合わせ,リスクコントロールモジュールを追加し,戦略のパフォーマンスを継続的に改善することができる.しかし,戦略には,傾向認識の不正確,パラメータ設定の不適切,歴史的データの過剰化などのリスクもあります.したがって,実践的な応用では注意が必要です.全体として,ロングショートリグレッション・クロスオーバー戦略は,さらなる探求と最適化に値するシンプルで効果的な定量的な取引戦略です.
/*backtest
start: 2024-02-25 00:00:00
end: 2024-03-26 00:00:00
period: 3h
basePeriod: 15m
exchanges: [{"eid":"Futures_Binance","currency":"BTC_USDT"}]
*/

// This source code is subject to the terms of the Mozilla Public License 2.0 at https://mozilla.org/MPL/2.0/
// © stocktechbot
//@version=5
strategy("Linear Cross", overlay=true, margin_long=100, margin_short=0)

//Linear Regression

vol = volume

// Function to calculate linear regression
linregs(y, x, len) =>
    ybar = math.sum(y, len)/len
    xbar = math.sum(x, len)/len
    b = math.sum((x - xbar)*(y - ybar),len)/math.sum((x - xbar)*(x - xbar),len)
    a = ybar - b*xbar
    [a, b]

// Historical stock price data
price = close

// Length of linear regression
len = input(defval = 21, title = 'Strategy Length')
linearlen=input(defval = 9, title = 'Linear Lookback')
[a, b] = linregs(price, vol, len)

// Calculate linear regression for stock price based on volume
//eps = request.earnings(syminfo.ticker, earnings.actual)
//MA For double confirmation

out = ta.sma(close, 200)
outf = ta.sma(close, 50)
outn = ta.sma(close, 90)
outt = ta.sma(close, 21)
outthree = ta.sma(close, 9)

// Predicted stock price based on volume
predicted_price = a + b*vol

// Check if predicted price is between open and close
is_between = open < predicted_price and predicted_price < close

//MACD
//[macdLine, signalLine, histLine] = ta.macd(close, 12, 26, 9)

// Plot predicted stock price
plot(predicted_price, color=color.rgb(65, 59, 150), linewidth=2, title="Predicted Price")
plot(ta.sma(predicted_price,linearlen), color=color.rgb(199, 43, 64), linewidth=2, title="MA Predicted Price")
//offset = input.int(title="Offset", defval=0, minval=-500, maxval=500)
plot(out, color=color.blue, title="MA200")
[macdLine, signalLine, histLine] = ta.macd(predicted_price, 12, 26, 9)

//BUY Signal

longCondition=false
mafentry =ta.sma(close, 50) > ta.sma(close, 90)
//matentry = ta.sma(close, 21) > ta.sma(close, 50)
matwohun = close > ta.sma(close, 200)
twohunraise = ta.rising(out, 2)
twentyrise = ta.rising(outt, 2)
macdrise = ta.rising(macdLine,2)
macdlong = ta.crossover(predicted_price, ta.wma(predicted_price,linearlen))  and (signalLine < macdLine)
if macdlong and macdrise
    longCondition := true

if (longCondition)
    strategy.entry("My Long Entry Id", strategy.long)
//Sell Signal
lastEntryPrice = strategy.opentrades.entry_price(strategy.opentrades - 1)
daysSinceEntry = len
daysSinceEntry := int((time - strategy.opentrades.entry_time(strategy.opentrades - 1)) / (24 * 60 * 60 * 1000))
percentageChange = (close - lastEntryPrice) / lastEntryPrice * 100
//trailChange = (ta.highest(close,daysSinceEntry) - close) / close * 100

//label.new(bar_index, high, color=color.black, textcolor=color.white,text=str.tostring(int(trailChange)))
shortCondition=false
mafexit =ta.sma(close, 50) < ta.sma(close, 90)
matexit = ta.sma(close, 21) < ta.sma(close, 50)
matwohund = close < ta.sma(close, 200)
twohunfall = ta.falling(out, 3)
twentyfall = ta.falling(outt, 2)
shortmafall = ta.falling(outthree, 1)
macdfall = ta.falling(macdLine,1)
macdsell = macdLine < signalLine
if macdfall and macdsell and (macdLine < signalLine) and ta.falling(low,2)
    shortCondition := true

if (shortCondition)
    strategy.entry("My Short Entry Id", strategy.short)
- EMAのクロスADR戦略 - 厳格なリスク管理を伴う多次元的な技術指標に基づく取引方法
- カンドルスタイクパターンをベースにした上昇・下落の飲み込む戦略
- ボリンジャー・バンド ロング・オンリー戦略
- アルファトレンドとボリンジャー帯は,平均逆転+トレンドフォロー戦略を組み合わせたものです.
- グリッドドルコスト平均化戦略
- 3つの連続した上昇/下落のキャンドルと2つの移動平均値に基づいた定量的な取引戦略
- 複数のEMA,RSI,標準偏差に基づく退出キャンドルスティックの高さブレイクトレード戦略
- ビンアンの口座への切り替え小道具
- ネットワーク取引のリスクをカバーする戦略
- EMA-パラボリックトレンド 戦略をフォローする
- トレンド・モメント・ベース・マルチ・インジケーター・ムービング・平均クロスオーバー戦略
- ドンチアン運河を脱出する戦略 ATRSLの追跡停止
- ダイナミック・グリッド・トレンドフォローする定量的な取引戦略
- ボリンジャー・バンド ダイナミック・テイク・プロフィートとダイナミック・ポジション・アドディング・戦略
- TrippleMACDクロスオーバーと相対強度指数を組み合わせた高周波仮想通貨取引戦略
- RSIとEMAの二重フィルター戦略
- 格子ベースのロング・マルティンゲール・ダイナミック・ポジション・グリッド・トレーディング戦略
- 2倍指数関数移動平均 クラウドクロスオーバー自動取引戦略
- 2つの時間枠のEMAのクロスオーバー・ロング・ショート戦略
- ハルフ移動平均クロスオーバー戦略