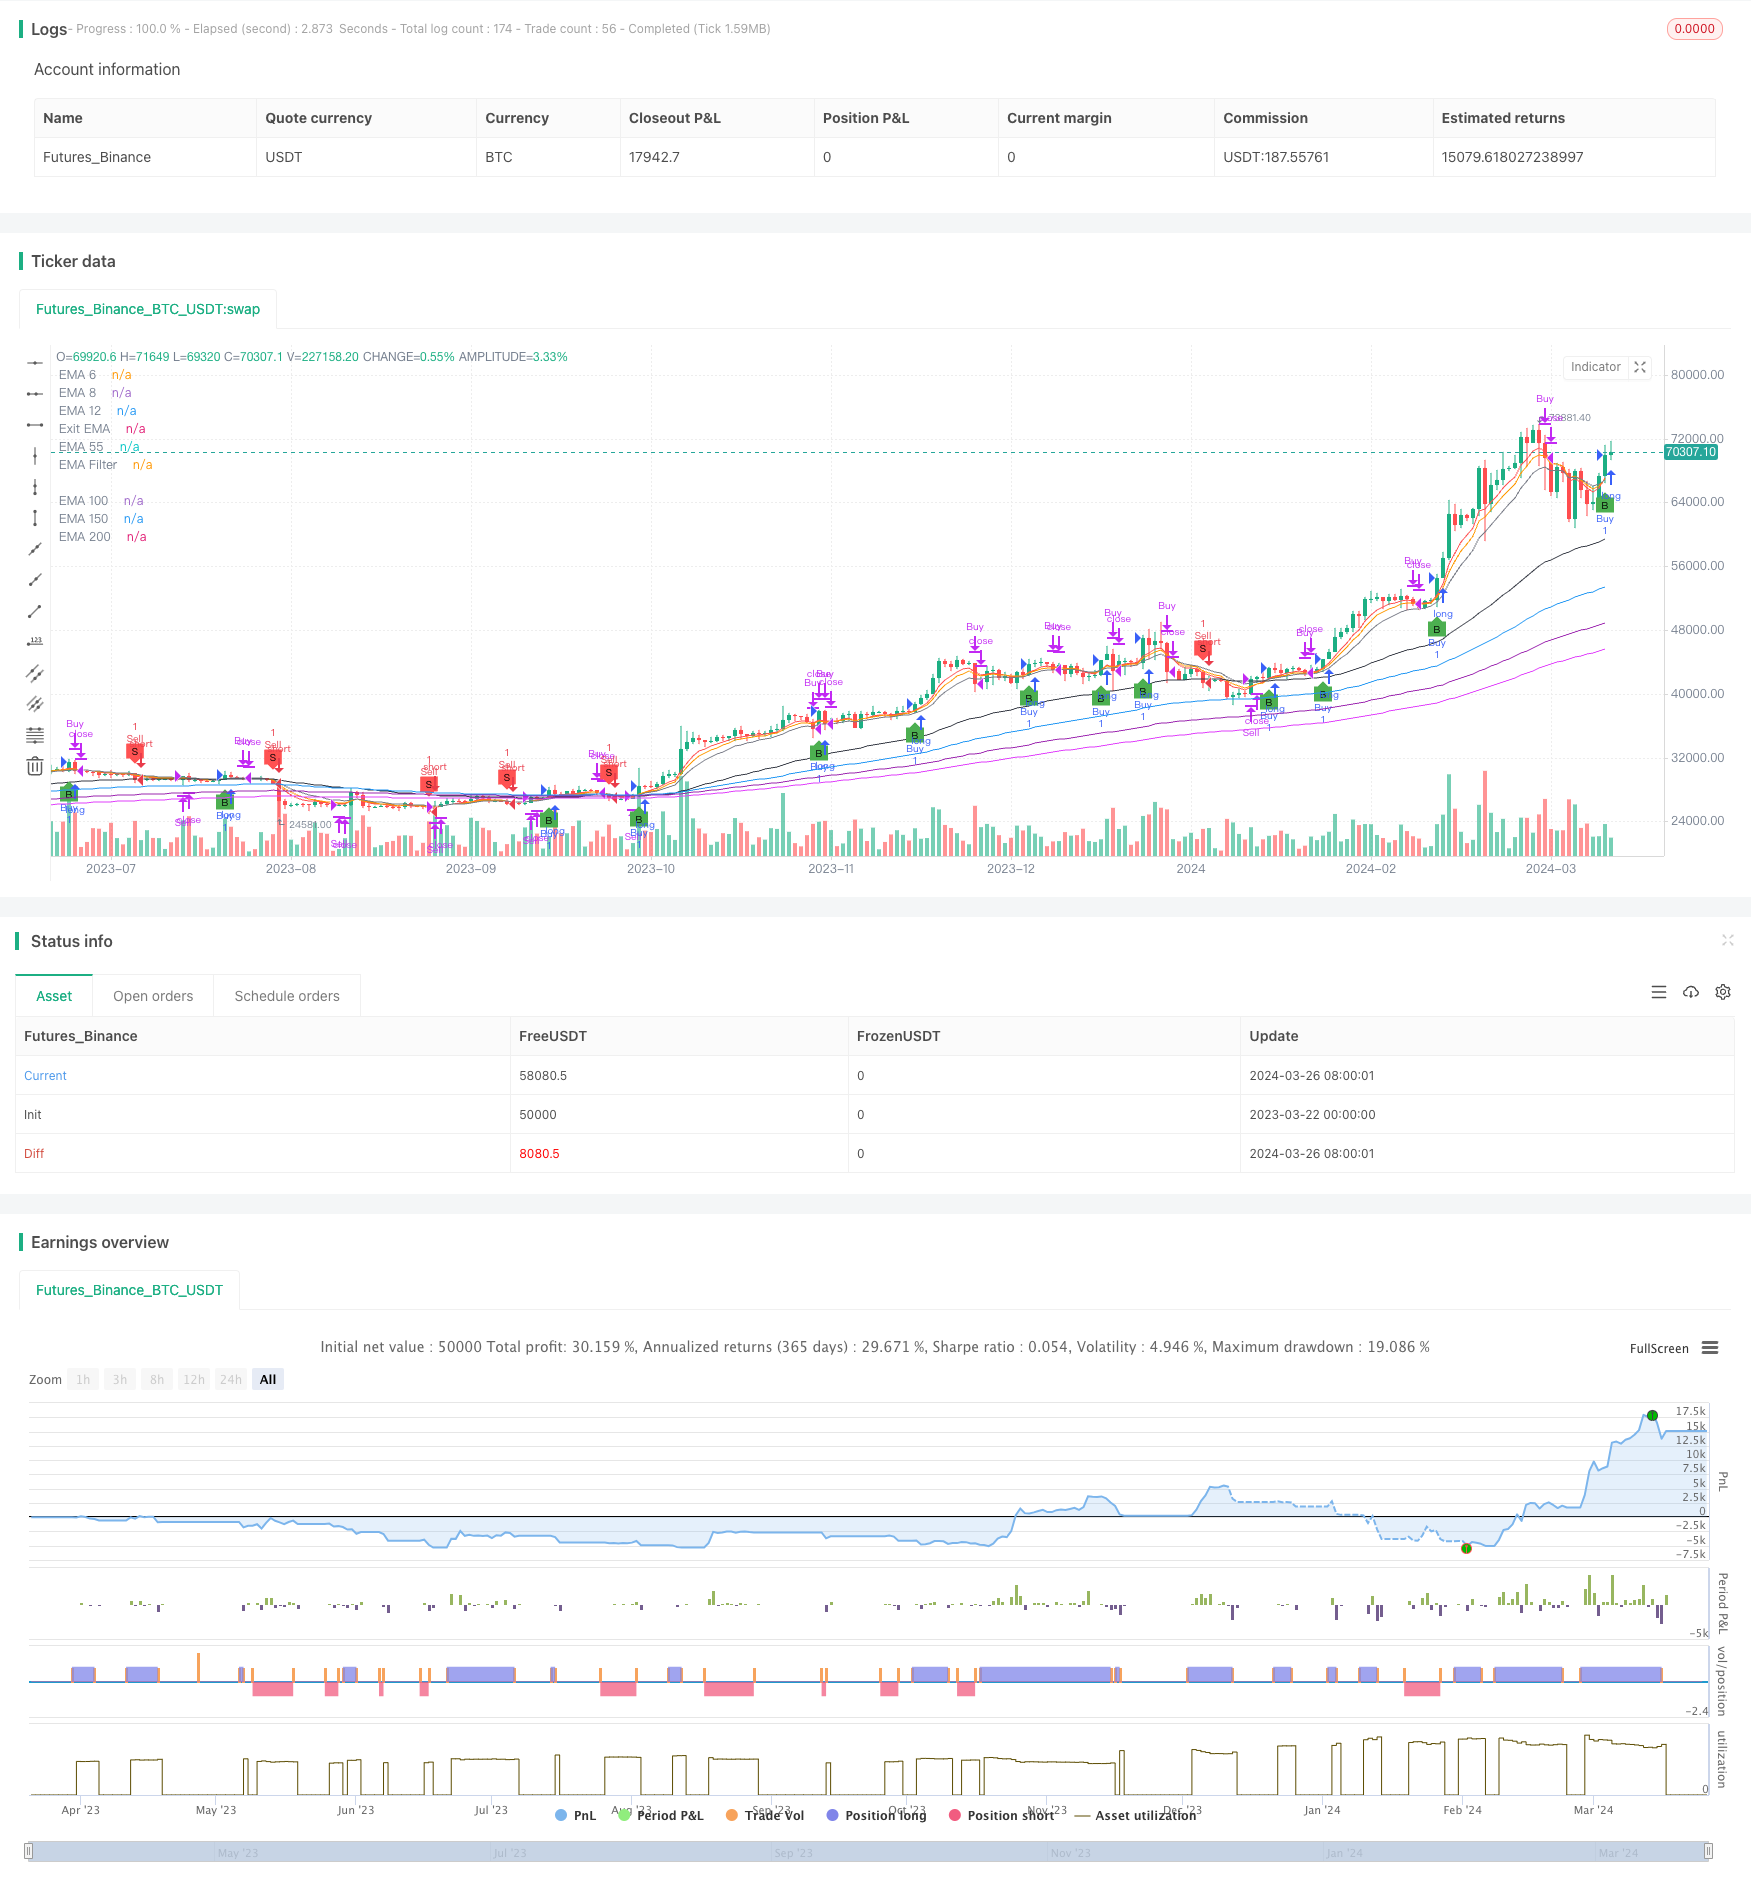
複数のEMA,RSI,標準偏差に基づく退出キャンドルスティックの高さブレイクトレード戦略
作者: リン・ハーンチャオチャン開催日:2024年3月28日 16:13:45タグ:

戦略の概要
この戦略は,複数の指数関数移動平均値 (EMA),相対強度指数 (RSI),および標準偏差ベースの出口条件を組み合わせて,潜在的な買い売り機会を特定する.市場動向の方向性と強さを分析するために,短期 (6,8,12日),中期 (55日),長期 (150,200日,250日) の EMA を使用する.設定可能な買い (30) と売 (70) の
戦略の原則
- 複数の EMA (6, 8, 12, 55, 100, 150, 200) を視覚的な参照として計算し,市場の動向を評価する.
- 最新のNキャンドルの最高高値と最低低値を,ユーザの入力 (3-4キャンドル) を基に決定する.
- Entry Long:現在の閉じる値は,最近のNキャンドルの最高値よりも高く,EMAフィルター (有効であれば) よりも高くなります.
- Entry Short: 現在の閉じる値は,最近のNキャンドルの最低値よりも低く,EMAフィルター (有効であれば) よりも低い.
- エクジット・ロング:現在の閉じる値は12日間のEMA+0.5標準偏差以下,または12日間のEMA以下です.
- エグジット・ショート:現在の閉じる値は12日間のEMA - 0.5標準偏差以上,または12日間のEMA以上です.
- RSI は 14 のデフォルト 期間, 30 の 過売り 値, 70 の 過買い 値の追加指標として使用します.
戦略 の 利点
- トレンドフォロー (複数EMA) とモメント (RSI) の両方を組み合わせて,より包括的な市場分析の観点を提供します.
- 標準偏差に基づく 唯一の退出メカニズムは 利益の保護とリスクの管理を 均衡させることができる
- ユーザが設定できるキーパラメータを備えた高度なモジュール化コードで 柔軟性があります
- 複数の楽器やタイムフレームに適用されます 特に日々の株やビットコイン取引です
リスク分析
- 市場の整合や早期のトレンド逆転中に頻繁に誤った信号が発信され,連続した損失が発生する.
- デフォルトパラメータはすべての市場条件に有効ではない場合もある.バックテストに基づく最適化は必要である.
- この戦略だけに頼るのはリスクが高い.他の指標と組み合わせて,サポート/レジスタンスレベルを決定するために推奨される.
- 突発的な重大事件によって引き起こす傾向の逆転に反応する遅さ
オプティマイゼーションの方向性
- EMA と RSI パラメータを最適化: ツール,タイムフレーム,市場特性をベースに最適なパラメータ範囲を徹底的に検索します.
- ストップ・ロストとテイク・プロフィートのメカニズムを導入する.単一の取引リスクを制御するために,ATRのような変動指標を参考に合理的なストップ・ロストとテイク・プロフィートのレベルを設定する.
- ポジションサイズを設定する: 傾向強度 (ADX) や主要なサポート/レジスタンスレベルの近さに基づいてポジションサイズを調整する.
- 他のテクニカルインジケーターと組み合わせる:ボリンジャー帯,MACD,移動平均クロスオーバーなど,エントリー/アウトリーシグナルの信頼性を向上させる.
- 異なる市場状態に最適化: トレンド,レンジ,そして移行する市場を別々に微調整するパラメータ組み合わせ.
概要
この記事では,複数の移動平均値,RSI,標準偏差出口をベースとしたキャンドルスタイクの高さブレイクアウト取引戦略を提案している.この戦略は,トレンドチャンスとリスクを管理するためにユニークな標準偏差出口メカニズムを使用しながら,トレンドとモメントの両方の次元から市場を分析する.戦略の論理は明確で厳格で,コードの実装は簡潔で効率的です.適切な最適化により,この戦略は堅牢な中高頻度内取引戦略になる可能性があります.しかし,どの戦略にも限界があり,盲目使用もリスクをもたらす可能性があることに注意することが重要です.定量取引は機械的なシグナルオーダープロセスではなく,全体的な市場状況と慎重なリスク管理の把握に基づいて構築されるべきです.トレーダーはまた,取引パフォーマンスを評価し,適切なタイミングで戦略を調整し,長期的な成功を達成するために,自らのリスク・トレランスのスタイルと組み合わせることが重要です.
/*backtest
start: 2023-03-22 00:00:00
end: 2024-03-27 00:00:00
period: 1d
basePeriod: 1h
exchanges: [{"eid":"Futures_Binance","currency":"BTC_USDT"}]
*/

//@version=5
strategy("Candle Height Breakout with Configurable Exit and Signal Control", shorttitle="CHB Single Signal", overlay=true)

// Input parameters for EMA filter and its length
useEmaFilter = input.bool(true, "Use EMA Filter", group="Entry Conditions")
emaFilterLength = input.int(55, "EMA Filter Length", minval=1, group="Entry Conditions")
candleCount = input.int(4, "SamG Configurable Candle Count for Entry", minval=3, maxval=4, step=1, group="Entry Conditions")
exitEmaLength = input.int(12, "Exit EMA Length", minval=1, group="Exit Conditions", defval=12)
exitStdDevMultiplier = input.float(0.5, "Exit Std Dev Multiplier", minval=0.1, maxval=2.0, step=0.1, group="Exit Conditions")

// State variables to track if we are in a long or short position
var bool inLong = false
var bool inShort = false

// Calculating EMAs with fixed periods for visual reference
ema6 = ta.ema(close, 6)
ema8 = ta.ema(close, 8)
ema12 = ta.ema(close, 12)
ema55 = ta.ema(close, 55)
ema100 = ta.ema(close, 100)
ema150 = ta.ema(close, 150)
ema200 = ta.ema(close, 200)
emaFilter = ta.ema(close, emaFilterLength)
exitEma = ta.ema(close, exitEmaLength)

// Plotting EMAs
plot(ema6, "EMA 6", color=color.red)
plot(ema8, "EMA 8", color=color.orange)
plot(ema12, "EMA 12", color=color.yellow)
plot(ema55, "EMA 55", color=color.green)
plot(ema100, "EMA 100", color=color.blue)
plot(ema150, "EMA 150", color=color.purple)
plot(ema200, "EMA 200", color=color.fuchsia)
plot(emaFilter, "EMA Filter", color=color.black)
plot(exitEma, "Exit EMA", color=color.gray)

// Calculating the highest and lowest of the last N candles based on user input
highestOfN = ta.highest(high[1], candleCount)
lowestOfN = ta.lowest(low[1], candleCount)

// Entry Conditions with EMA Filter
longEntryCondition = not inLong and not inShort and (close > highestOfN) and (not useEmaFilter or (useEmaFilter and close > emaFilter))
shortEntryCondition = not inLong and not inShort and (close < lowestOfN) and (not useEmaFilter or (useEmaFilter and close < emaFilter))

// Update position state on entry
if (longEntryCondition)
    strategy.entry("Buy", strategy.long, comment="B")
    inLong := true
    inShort := false

if (shortEntryCondition)
    strategy.entry("Sell", strategy.short, comment="S")
    inLong := false
    inShort := true

// Exit Conditions based on configurable EMA and Std Dev Multiplier
smaForExit = ta.sma(close, exitEmaLength)
upperExitBand = smaForExit + exitStdDevMultiplier * ta.stdev(close, exitEmaLength)
lowerExitBand = smaForExit - exitStdDevMultiplier * ta.stdev(close, exitEmaLength)

exitConditionLong = inLong and (close < upperExitBand or close < exitEma)
exitConditionShort = inShort and (close > lowerExitBand or close > exitEma)

// Strategy exits
if (exitConditionLong)
    strategy.close("Buy", comment="Exit")
    inLong := false

if (exitConditionShort)
    strategy.close("Sell", comment="Exit")
    inShort := false

// Visualizing entry and exit points
plotshape(series=longEntryCondition, style=shape.labelup, location=location.belowbar, color=color.green, size=size.tiny, title="Buy Signal", text="B")
plotshape(series=shortEntryCondition, style=shape.labeldown, location=location.abovebar, color=color.red, size=size.tiny, title="Sell Signal", text="S")
もっと
- SMA移動平均のクロスオーバー戦略
- ボリンガー 5分間のブレイク・アウト・イントラデイ・トレーディング・戦略
- 変数と移動平均に基づく変動戦略
- 移動平均のクロスオーバー量的な戦略
- EMAのクロスADR戦略 - 厳格なリスク管理を伴う多次元的な技術指標に基づく取引方法
- カンドルスタイクパターンをベースにした上昇・下落の飲み込む戦略
- ボリンジャー・バンド ロング・オンリー戦略
- アルファトレンドとボリンジャー帯は,平均逆転+トレンドフォロー戦略を組み合わせたものです.
- グリッドドルコスト平均化戦略
- 3つの連続した上昇/下落のキャンドルと2つの移動平均値に基づいた定量的な取引戦略
- ビンアンの口座への切り替え小道具
- ネットワーク取引のリスクをカバーする戦略
- EMA-パラボリックトレンド 戦略をフォローする
- 長短線形回帰クロスオーバー戦略
- トレンド・モメント・ベース・マルチ・インジケーター・ムービング・平均クロスオーバー戦略
- ドンチアン運河を脱出する戦略 ATRSLの追跡停止
- ダイナミック・グリッド・トレンドフォローする定量的な取引戦略
- ボリンジャー・バンド ダイナミック・テイク・プロフィートとダイナミック・ポジション・アドディング・戦略
- TrippleMACDクロスオーバーと相対強度指数を組み合わせた高周波仮想通貨取引戦略
- RSIとEMAの二重フィルター戦略