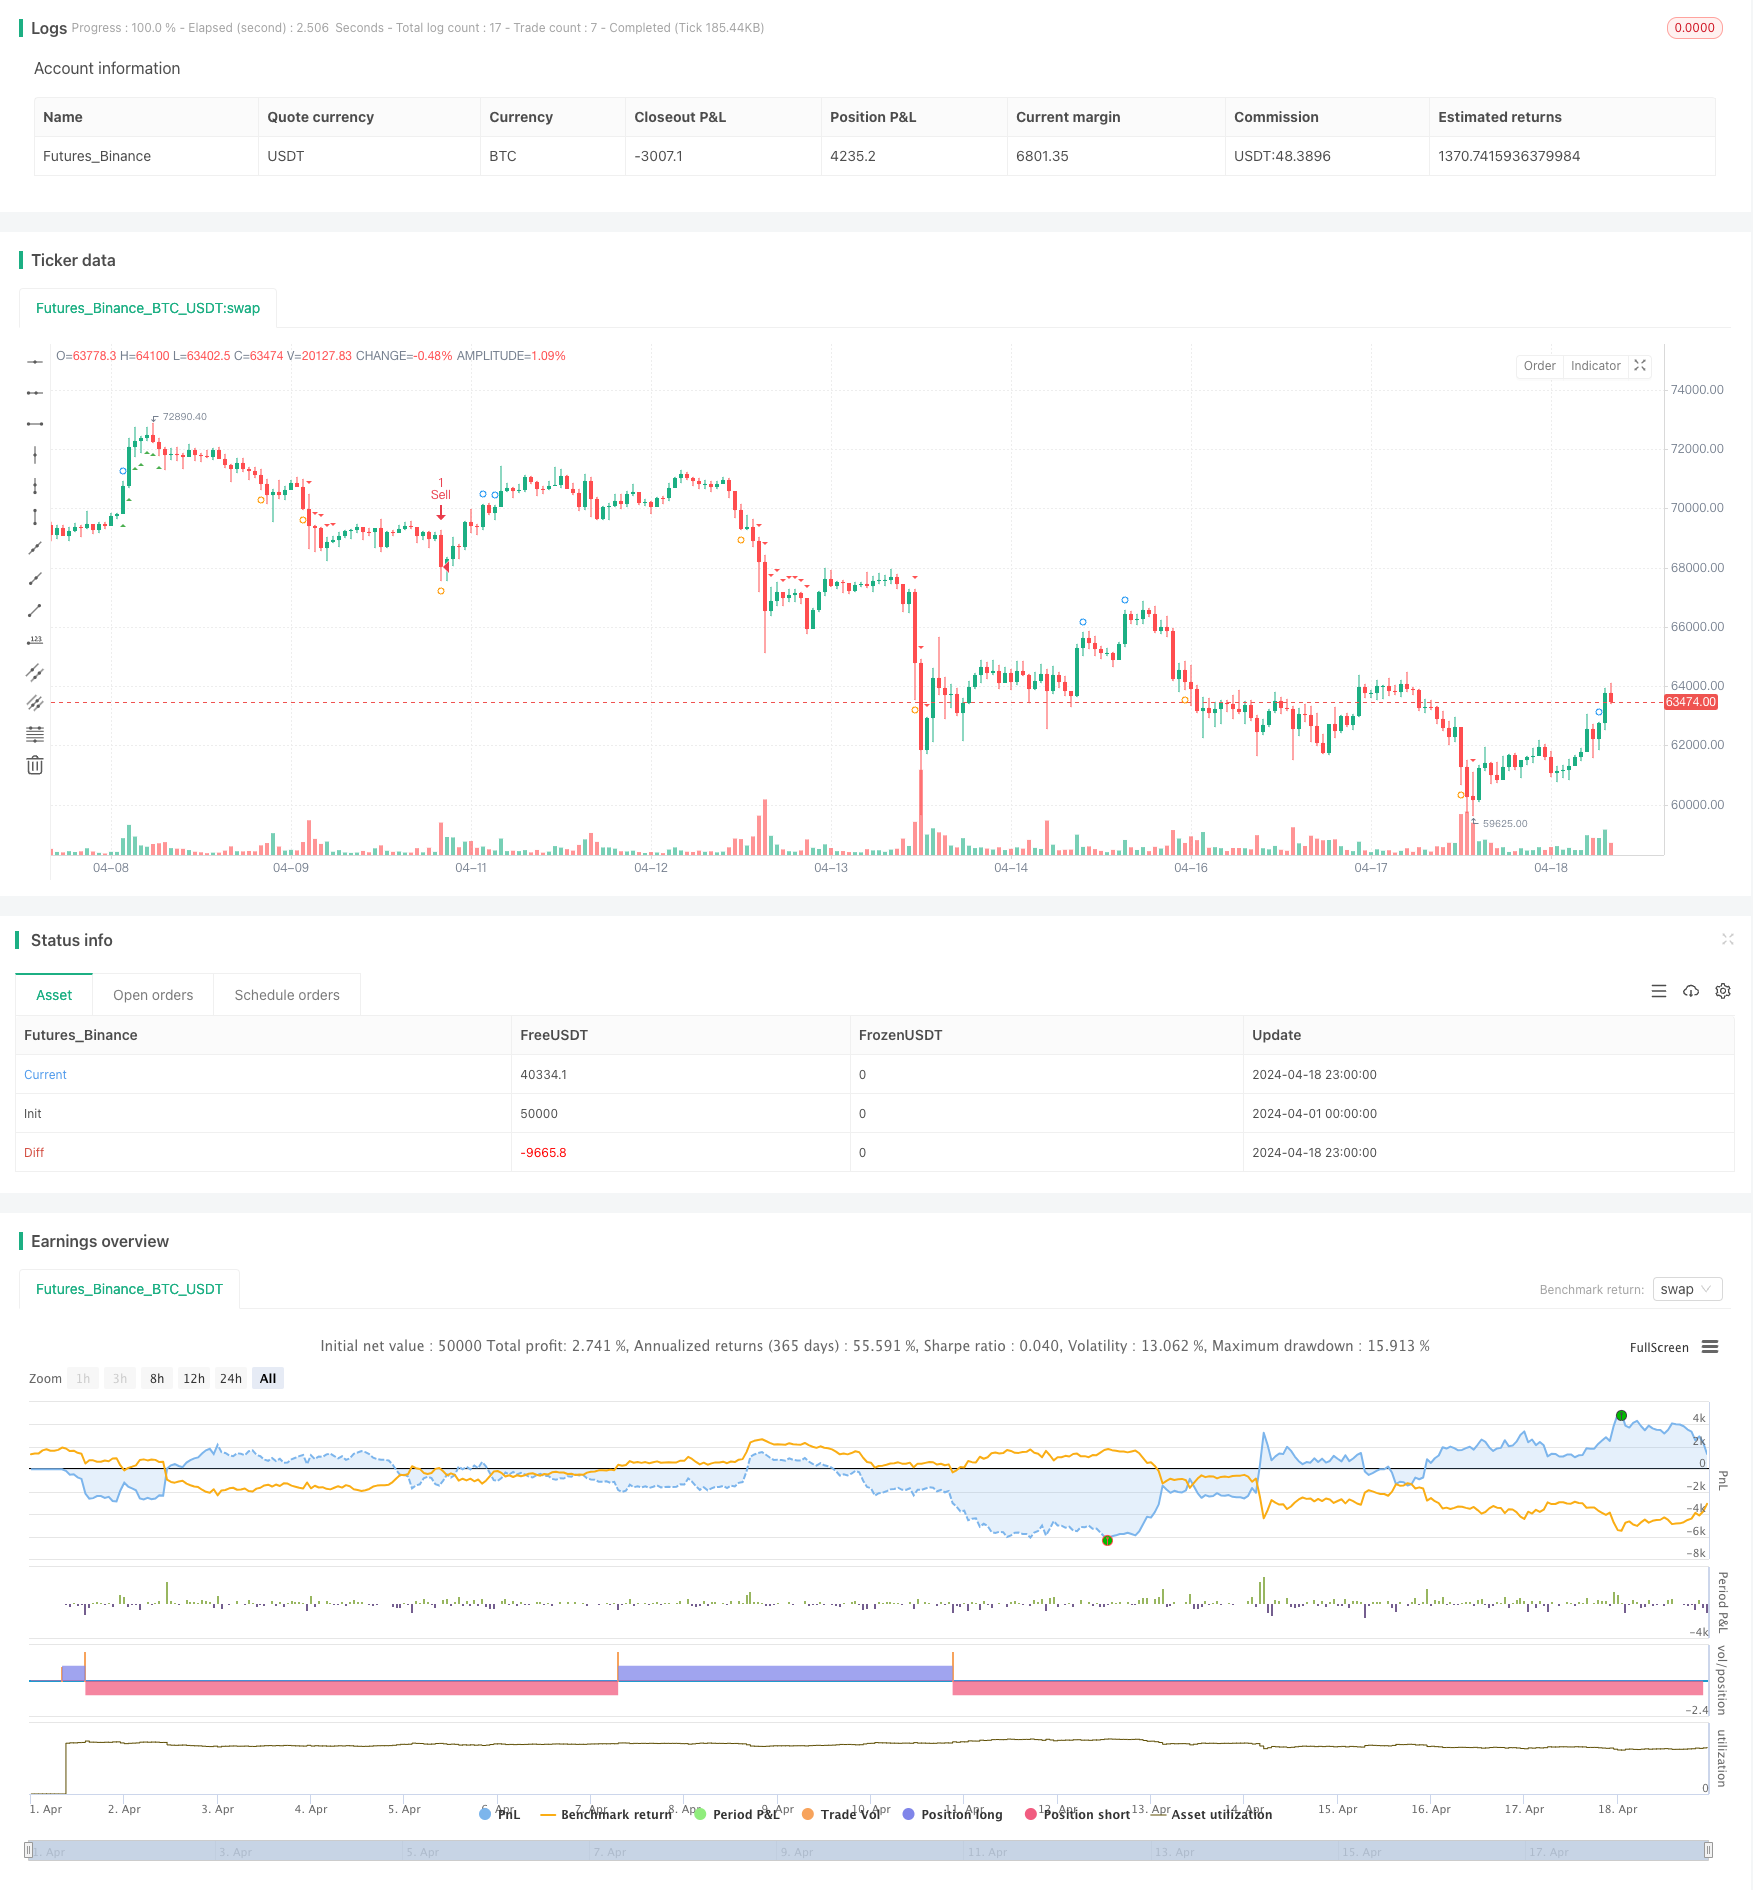
Nadaraya-Watson 封筒 多重確認動的ストップ損失戦略
作者: リン・ハーンチャオチャン開催日:2024年5月24日 17時58分47秒タグ:ADXDIRSIMAE

概要
この戦略は,ナダライア・ワトソン封筒を用いて価格データを滑らかにし,滑らかな価格に基づいて上下帯を計算する.その後,ADXおよびDI指標を使用してトレンド強さと方向を決定し,RSI指標を使用してトレンド勢力を確認する.価格が封筒帯以上または以下を横切るときに潜在的なブレイクアウトが特定される.最後に,トレンド,ブレイクアウト,およびモメントの組み合わせた信号に基づいて取引を実行し,リスクを管理するためにダイナミックストップロスを採用する.
戦略の原則
- ナダラヤ・ワトソン表紙を適用して価格データを平ら化し,上下帯を計算する.
- ADX と DI インディケーターを使用して,トレンドの強さと方向を決定します. ADX が値を下げ, +DI が -DI より大きいとき,ダウントレンドが上昇傾向を示します.
- 価格が上部帯以上または下部帯を下回る場合,潜在的なブレイクアウトを特定する.
- RSI インジケーターを使用してトレンドモメンタムを確認します.70を超えるRSIは上昇モメンタムを示し,30以下のRSIは下落モメンタムを示します.
- トレンド,ブレイク,モメントの合致信号に基づいて取引を実行します:
- 強い上昇傾向,上向きのブレイク,そして上昇勢力が有るときにロングポジションに入ります.
- 強い下向き傾向,下向きのブレイク,下向きの勢いがあるときにショートポジションに入ります.
- リスク管理のために動的ストップ・ロスを実施します.ストップ・ロスの価格は最高/最低価格と閉店価格に基づいて計算されます.
- グラフにトレンドライン,ブレイクアウトポイント,モメント信号をグラフ化することで 戦略信号を視覚的に表示します
戦略 の 利点
- ナダライア・ワトソン・エンベロープは価格データを効率的に平滑させ 騒音を減らすことができます
- 多重確認メカニズムは信号の信頼性を向上させる.トレンド,ブレイク,インパントシグナルは,取引機会を検証するために互いを補完する.
- ダイナミックストップ・ロスの管理は,市場の変動により良く適応し,リスクを軽減します.ストップ・ロスの価格は,最高/最低価格と閉店価格に基づいて計算され,市場に合わせて調整することができます.
- グラフ上のトレンドライン,ブレイクポイント,インパクトシグナルを視覚的にプロットすることで,戦略シグナルの観察と解釈が容易になります.
戦略リスク
- 不安定な市場やトレンド逆転の際に 頻繁にブレイクアウト信号が発信されれば 過剰取引や損失が起こる可能性があります
- ダイナミックストップロスは,トレンド逆転時に迅速にポジションを退場できず,引き下げが増加する可能性があります.
- 戦略のパラメータは,ナダラヤ・ワトソン封筒の帯域幅やADXの
値など,異なる市場や手段のために最適化する必要があります.パラメータの設定が正しくない場合,戦略のパフォーマンスに影響を及ぼす可能性があります.
戦略の最適化方向
- トレンド識別の正確性と安定性を向上させるため,MACD,移動平均システムなど,効果的な傾向決定指標を追加する.
- ストップロスの計算方法を最適化し,ストップロスをより柔軟かつ効率的にするために,ATRやSARなどの変動性関連指標を考慮する.
- 戦略の適応性を高めるために,トレンドやレンジ・バインド市場などの様々な市場特性を対象とした異なるパラメータの組み合わせを策定する.
- ポジションサイズを動的に調整し,市場の動向や変動などの要因に基づいて,リスクを制御するポジションサイズを調整するモジュールを導入する.
概要
この戦略は,ADXとDI,RSIモメント指標,および価格ブレイクアウトポイントなどのトレンドインジケーターと価格スムーズ化のためのNadaraya-Watsonエンベロープを組み合わせて,包括的な取引システムを作成する. ダイナミックストップ・ロスの管理は,市場の変化に適応し,一定程度リスクを制御するのに役立ちます. しかし,実用的な応用では,トレンド識別,ダイナミックストップ・ロスの最適化,パラメータ設定に注意を払い,戦略の安定性と収益性を向上させる必要があります.
/*backtest
start: 2024-04-01 00:00:00
end: 2024-04-18 23:59:59
period: 1h
basePeriod: 15m
exchanges: [{"eid":"Futures_Binance","currency":"BTC_USDT"}]
*/

//@version=5
strategy("Nadaraya-Watson Envelope with Multi-Confirmation and Dynamic Stop-Loss", overlay=true)

// Input parameters
h = input.float(7.2, "Bandwidth", minval=0)
mult = input.float(2.1, minval=0)
src = input(close, "Source")

// ADX and DI Input Parameters
adxLength = input.int(14, "ADX Length")
adxThreshold = input.float(25, "ADX Threshold")
adxSmoothing = input.int(14, "ADX Smoothing")

// Calculate ADX and DI
[dmiPlus, dmiMinus, adx] = ta.dmi(adxLength, adxSmoothing)
strongTrendUp = dmiPlus > dmiMinus and adx > adxThreshold
strongTrendDown = dmiMinus > dmiPlus and adx > adxThreshold

// Nadaraya-Watson Envelope Calculation
gauss(x, h) =>
    math.exp(-(math.pow(x, 2) / (h * h * 2)))

coefs = array.new_float(0)
den = 0.0

for i = 0 to 100
    w = gauss(i, h)
    array.push(coefs, w)

den := array.sum(coefs)

out = 0.0
for i = 0 to 100
    out += src[i] * array.get(coefs, i)
out /= den
mae = ta.sma(math.abs(src - out), 100) * mult

upper = ta.sma(out + mae, 10)
lower = ta.sma(out - mae, 10)

// Confirmations
breakoutUp = ta.crossover(src, upper)
breakoutDown = ta.crossunder(src, lower)

// Original RSI period and thresholds
rsiPeriod = input.int(14, "RSI Period")
rsi = ta.rsi(src, rsiPeriod)
momentumUp = rsi > 70 and adx > adxThreshold
momentumDown = rsi < 30 and adx > adxThreshold

// // Plot ADX-based Trend Confirmation Lines
// if (strongTrendUp)
//     line.new(bar_index, low, bar_index + 1, low, color=color.new(color.blue, 50), width=2, style=line.style_dashed)

// if (strongTrendDown)
//     line.new(bar_index, high, bar_index + 1, high, color=color.new(color.red, 50), width=2, style=line.style_dashed)

// Plot Breakout Confirmation Dots
plotshape(series=breakoutUp, style=shape.circle, location=location.abovebar, color=color.blue, size=size.tiny, title="Breakout Up")
plotshape(series=breakoutDown, style=shape.circle, location=location.belowbar, color=color.orange, size=size.tiny, title="Breakout Down")

// Plot Momentum Confirmation Arrows
plotshape(series=momentumUp, style=shape.triangleup, location=location.belowbar, color=color.green, size=size.tiny, title="Momentum Up")
plotshape(series=momentumDown, style=shape.triangledown, location=location.abovebar, color=color.red, size=size.tiny, title="Momentum Down")

// Strategy Entry and Exit
var float stopLossLevel = na
var float highestPrice = na

potentialBuy = strongTrendUp and breakoutUp
potentialSell = strongTrendDown and breakoutDown
momentumConfirmUp = potentialBuy and momentumUp
momentumConfirmDown = potentialSell and momentumDown

if (momentumConfirmUp)
    strategy.entry("Buy", strategy.long)
    stopLossLevel := close * 0.90
    highestPrice := close

if (momentumConfirmDown)
    strategy.entry("Sell", strategy.short)
    stopLossLevel := close * 1.10
    highestPrice := close

if (strategy.position_size > 0)
    highestPrice := math.max(highestPrice, close)
    stopLossLevel := math.max(highestPrice * 0.85, close * 0.90)

if (strategy.position_size < 0)
    highestPrice := math.min(highestPrice, close)
    stopLossLevel := math.min(highestPrice * 1.15, close * 1.10)

// Close position if stop loss is hit
if (strategy.position_size > 0 and close < stopLossLevel)
    strategy.close("Buy")

if (strategy.position_size < 0 and close > stopLossLevel)
    strategy.close("Sell")
関連性
- ADX フィルタリング・トレード・シグナル戦略のRSI
- 複数の指標を備えた インテリジェントピラミッド戦略
- ジョニーのボット
- ヴァンチュ・シッファーB+ディバージェンス戦略
- RSI,ADX,そしてイチモク・クラウドに基づいた定量的な取引戦略をフォローする多要素トレンド
- ATRベースのダイナミックなポジションマネジメントを備えたオープン後のブレイクアウト取引戦略
- マルチテクニカルインジケータークロスオーバーモメント量的な取引戦略 - EMA,RSI,ADXに基づく統合分析
- 多戦略適応トレンドフォローとブレイクトレードシステム
- ギャウス・クロス EMA トレンド・リトレースメント戦略
- ダイナミック・ポジション・サイジング 短期・外為取引戦略
もっと
- PSAR と EMA ベースの定量取引戦略
- 標準偏差 DEV 取引戦略 相対強度指数 RSI と単純な移動平均 SMA をベースに
- MA,SMA 双重移動平均のクロスオーバー戦略
- リスク・リターン比率と技術分析に基づくブールフラグ・ブレイクストラテジー
- 多要素融合戦略
- Bollinger Bands + RSI + マルチMA トレンド戦略
- QQEとRSIをベースにした長期・短期信号戦略
- ゼロラグ MACD ダブルクロスオーバー取引戦略 - 短期トレンドキャプチャに基づく高周波取引
- 平均本格的な範囲をフォローするトレンドストップ戦略
- SMCとEMAの戦略とP&L予測
- ダイナミック・テイク・プロフィート・ボリンガー・バンド戦略
- CCI + MA クロスオーバー・プルバック・買い戦略
- 高流動性通貨ペアの短期短期短期販売戦略
- MOST インディケーター 双重位置適応戦略
- Bollinger Bands RSI トレーディング戦略
- リアルタイムの価格戦略で購入・販売量ヒートマップ
- 2つの移動平均回帰取引戦略
- 多指標量的な取引戦略 - スーパー指標7対1戦略
- SMK ULTRA TREND 二重移動平均のクロスオーバー戦略
- 五倍強い移動平均戦略