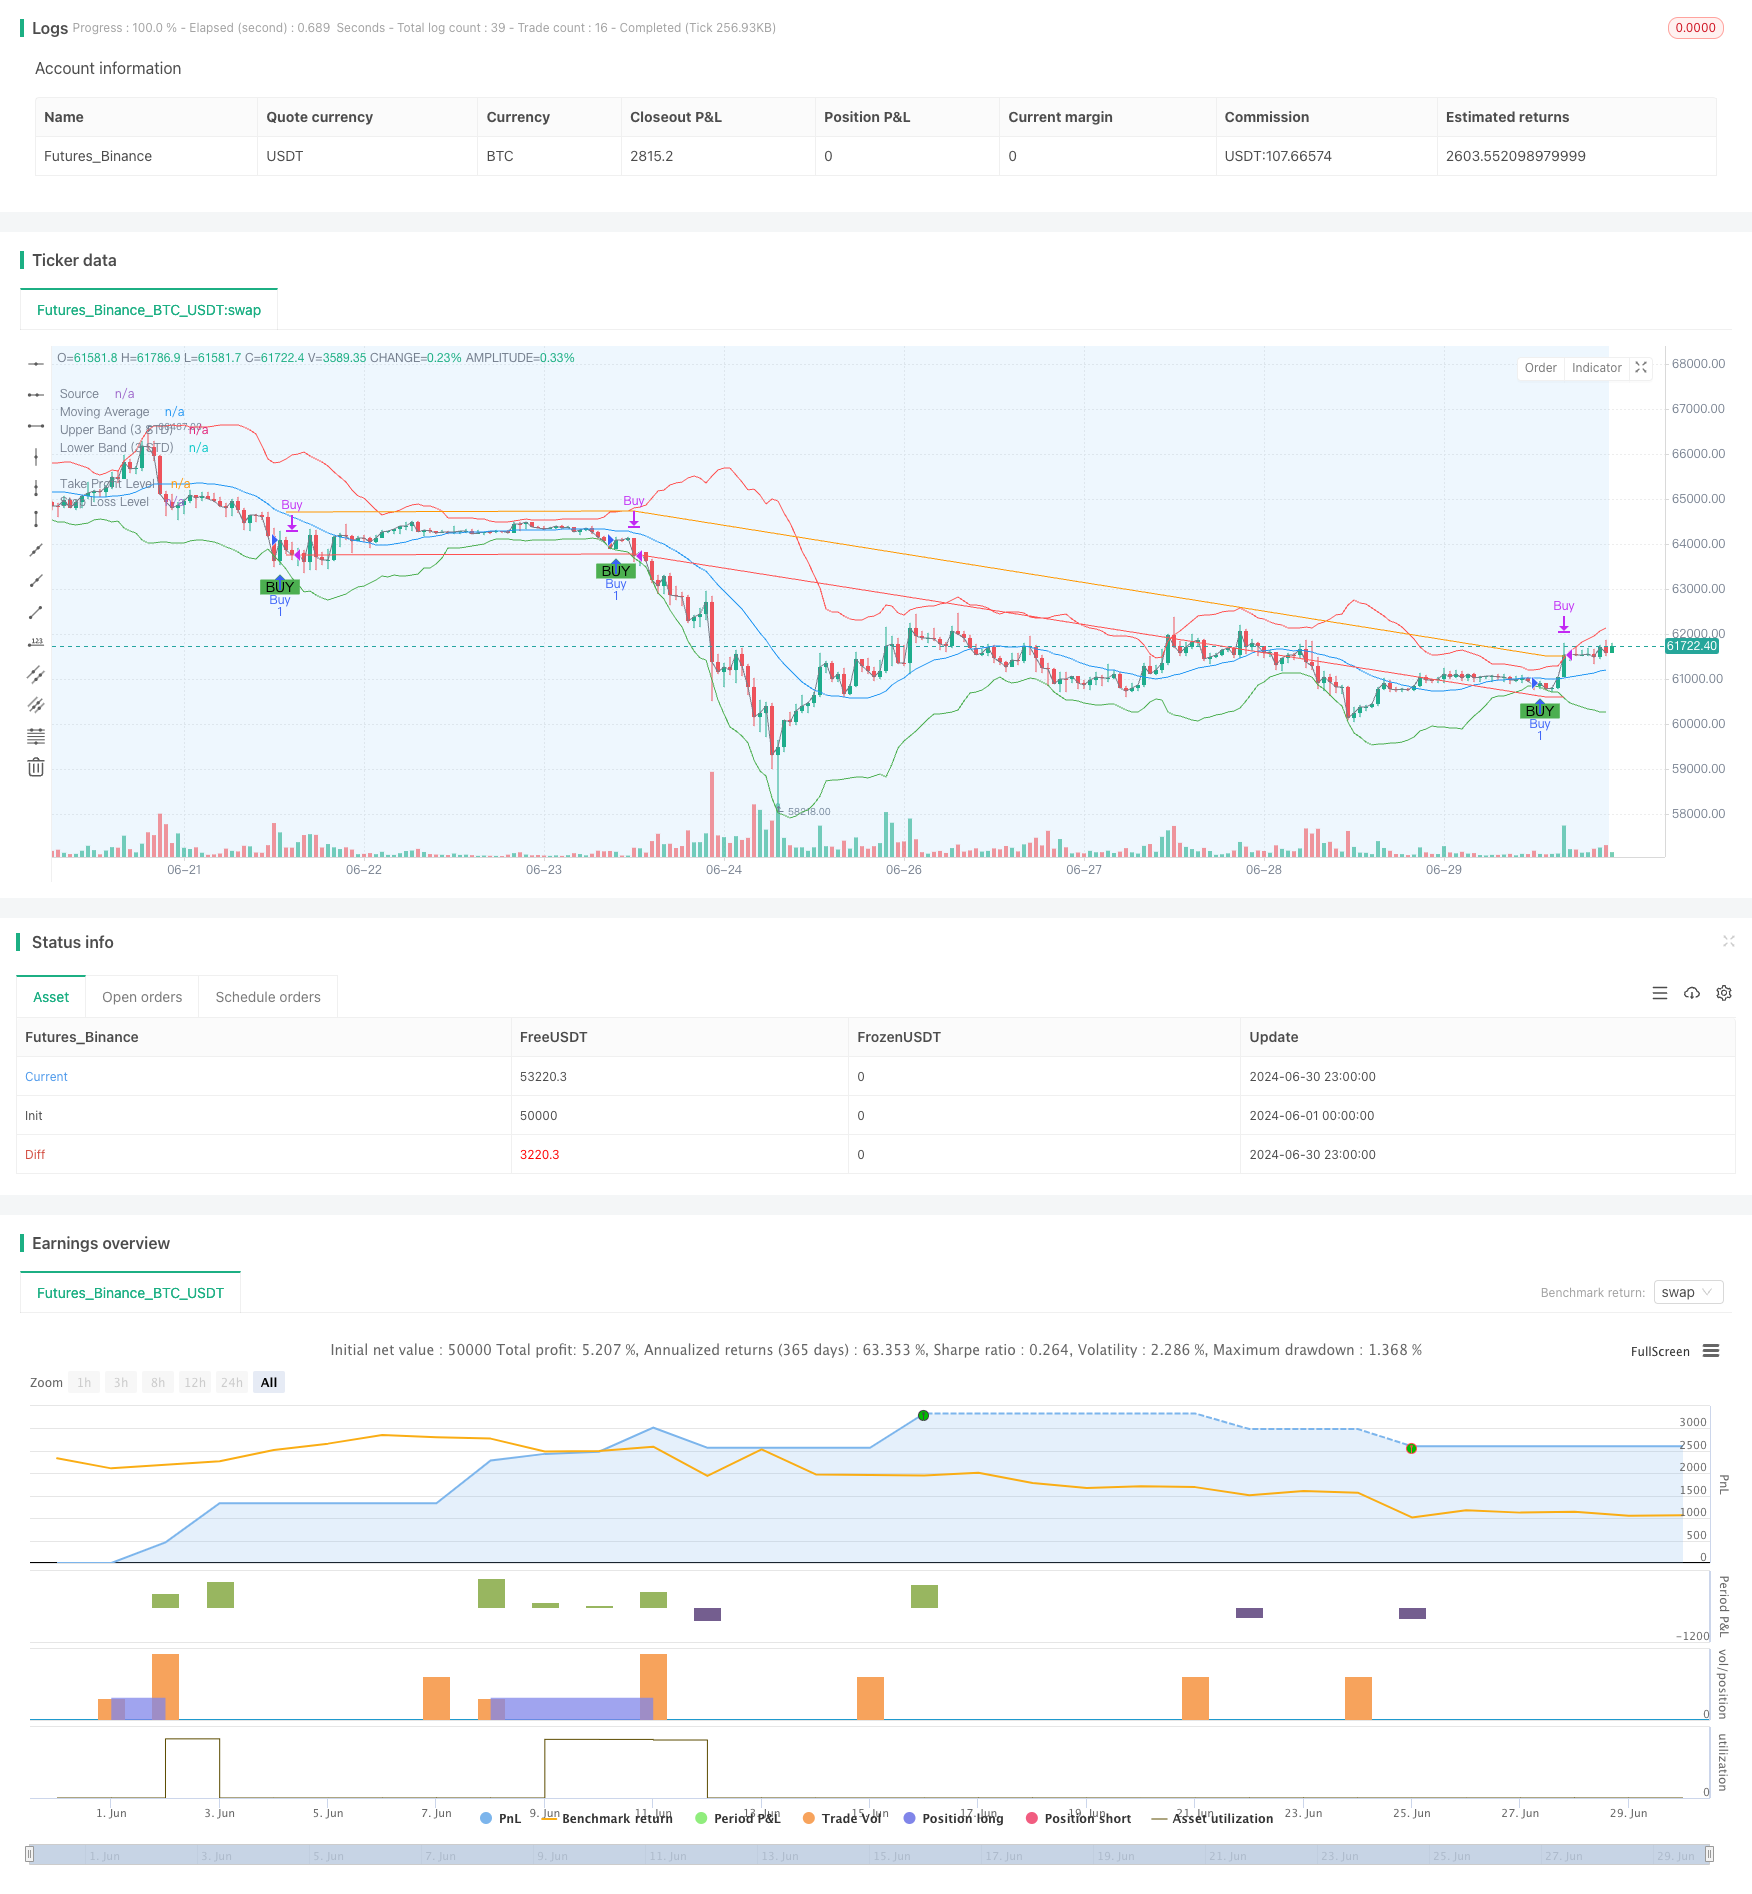
アダプティブ標準偏差ブレイクアウト取引戦略: ダイナミック・ボラティリティに基づく多期最適化システム
作者: リン・ハーンチャオチャン開催日:2024年7月30日16時09分04秒タグ:マルチSMA性感染症SLTP

概要
この取引戦略は,価格と移動平均値,および標準偏差の間の関係を活用して潜在的な購入機会を特定するための標準偏差ブレイクアウトに基づくシステムである.この戦略は,主に価格が下帯を突破したときの購入信号に焦点を当て,利益とストップロスのレベルを設定することによってリスクを管理する.戦略の核心理念は,不正常な価格変動の期間中に取引し,移動平均値と標準偏差を使用して潜在的な偽信号をフィルタリングすることです.
戦略の原則
-
移動平均を計算する (MA): 単純な移動平均 (SMA) を使って,指定された期間の平均線を計算する.
-
標準偏差を計算する: 同じ期間に基づいて価格の標準偏差を計算する.
-
上部と下部帯を構成する:
- 上部帯 = MA + (標準偏差 * 倍数)
- 下帯 = MA - (標準偏差 * 倍数)
-
購入シグナルを生成する.価格が下から下帯を越えたときに購入シグナルを誘発する.
-
リスク管理
- セット 取得価格: 入場価格 * (1 + 取得利益パーセント)
- ストップ・ロスの価格を設定する: 入場価格 * (1 - ストップ・ロスの割合)
-
バックテスト時間帯:この戦略は,ユーザがバックテストのための特定の開始および終了時間を設定し,指定された時間帯内で取引を実行することを可能にします.
戦略 の 利点
-
高い適応性:標準偏差を使用することで,戦略は市場の変動に応じて取引範囲を自動的に調整し,異なる市場環境に適応することができます.
-
総合的なリスク管理: 利益とストップ・ロスのメカニズムを統合し,各取引のリスクを効果的に制御します.
-
高柔軟性: 標準偏差期間,マルチプリキュア,テイク・プロフィート,ストップ・ロスの割合などの複数のパラメータをカスタマイズできます.
-
良い視覚化: 戦略は移動平均値,上位および下位帯,チャート上の購入信号をプロットし,直感的な理解と分析を促進します.
-
強力なバックテスト機能:ユーザーはバックテストの時間範囲を正確に設定することができ,特定の市場条件下で戦略のパフォーマンスを評価するのに有益です.
戦略リスク
-
偽ブレイクリスク:横向市場や低波動性市場では,頻繁に偽ブレイクが発生し,過剰な取引と不必要な取引手数料損失につながる可能性があります.
-
トレンドフォロー・デレー: 戦略は移動平均値と標準偏差に基づいているため,強いトレンド市場への早期エントリー機会を逃す可能性があります.
-
パラメータ感度: 戦略の性能はパラメータ設定に大きく依存する.異なるパラメータ組み合わせが大きく異なる結果をもたらし,広範なバックテストと最適化が必要である.
-
一方向取引制限: 戦略は現在,長期論理のみを実装しており,ダウントレンド市場では機会を逃したり,重大な損失を負う可能性があります.
-
市場環境依存性: 戦略は,非常に不安定で少量の仮想通貨市場でよりうまく機能するが,他の市場環境での有効性は異なる可能性がある.
戦略の最適化方向
-
ショートセールメカニズムを導入する:価格が上位帯を突破するとショートセールロジックを追加し,両方向市場で戦略が利益を得ることができます.
-
ダイナミックパラメータ調整: 標準偏差倍数や市場状況に基づいて利益/ストップ損失比などのパラメータを自動的に調整する機能を実装し,戦略の適応性を向上させる.
-
複数のタイムフレーム分析:信号の信頼性と入力タイミングの精度を向上させるために,より長い時間とより短い時間からのデータを組み込む.
-
ボリュームフィルタリングを追加: 低ボリューム期間の偽のブレイクシグナルをフィルタリングするためにボリュームインジケーターを導入し,取引品質を改善します.
-
収益とストップ・ロスのメカニズムを最適化する: 市場の変動により良く適応するために,トライリング・ストップやATRベースのストップ・ロスの設定などの動的収益とストップ・ロスのメカニズムを導入する.
-
フィルタリング条件を増やす:他の技術指標や基本データを組み合わせて追加取引条件を設定し,誤った信号を減らす.
-
マネーマネジメントを実装: ポジションサイズロジックを追加して,口座サイズと市場の変動に基づいて,それぞれの取引に対する資金の割合を動的に調整します.
概要
アダプティブ標準偏差突破取引戦略 (Adaptive Standard Deviation Breakout Trading Strategy) は,動的に調整された価格チャネルを通じて市場異常によってもたらされる取引機会を捕捉する統計的原則に基づく定量的な取引システムである.この戦略の主な利点は,適応性とリスク管理能力にあります.これは異なる市場環境で比較的安定したパフォーマンスを維持することを可能にします.しかし,この戦略は偽の突破やパラメータ敏感性などの課題に直面し,トレーダーは慎重に使用し,継続的に最適化する必要があります.
この戦略は,ショートセールメカニズム,ダイナミックパラメータ調整,マルチタイムフレーム分析,およびその他の最適化措置を導入することにより,その安定性と収益性をさらに向上させる可能性がある.経験豊富な定量トレーダーにとって,この戦略は,異なる取引スタイルと市場環境に適応するために深くカスタマイズされ最適化できる優れた基本的なフレームワークを提供します.
全体的に,この適応標準偏差突破取引戦略は,数値取引の本質を示し,数学的モデルと統計的方法を通じて市場機会を把握し,リスクを厳格に制御する.非常に不安定な仮想通貨市場に適用できるだけでなく,適切な調整により他の金融市場にも適用され,トレーダーに強力で柔軟な取引ツールを提供します.
/*backtest
start: 2024-06-01 00:00:00
end: 2024-06-30 23:59:59
period: 1h
basePeriod: 15m
exchanges: [{"eid":"Futures_Binance","currency":"BTC_USDT"}]
*/

//@version=5
strategy("MikEy Scali 3 STD Dev Buy Strategy with TP and SL", overlay=true)

// Input parameters for the strategy
length = input.int(20, title="Standard Deviation Length", minval=1)
src = input(close, title="Source")
mult = input.float(3.0, title="Standard Deviation Multiplier", step=0.1)

// Input for the take profit and stop loss percentages
takeProfitPerc = input.float(1.0, title="Take Profit Percentage", step=0.1) / 100
stopLossPerc = input.float(0.5, title="Stop Loss Percentage", step=0.1) / 100

// Input parameters for the backtesting range
testStartYear = input.int(2023, title="Backtest Start Year", minval=2000)
testStartMonth = input.int(1, title="Backtest Start Month", minval=1, maxval=12)
testStartDay = input.int(1, title="Backtest Start Day", minval=1, maxval=31)

testEndYear = input.int(2024, title="Backtest End Year", minval=2000)
testEndMonth = input.int(12, title="Backtest End Month", minval=1, maxval=12)
testEndDay = input.int(31, title="Backtest End Day", minval=1, maxval=31)

// Define the backtesting range
testStartTime = timestamp(testStartYear, testStartMonth, testStartDay, 00, 00)
testEndTime = timestamp(testEndYear, testEndMonth, testEndDay, 23, 59)

// Determine if the current bar is within the backtesting range
inBacktestRange = (time >= testStartTime) and (time <= testEndTime)

// Calculate the moving average and standard deviation
ma = ta.sma(src, length)
std_dev = ta.stdev(src, length)

// Calculate upper and lower bands
upper_band = ma + (std_dev * mult)
lower_band = ma - (std_dev * mult)

// Buy condition within the backtesting range
buyCondition = inBacktestRange and ta.crossover(src, lower_band)

// Plot the buy signal on the chart
plotshape(series=buyCondition, location=location.belowbar, color=color.green, style=shape.labelup, text="BUY")

// Execute buy orders based on the condition within the backtesting range
if (buyCondition)
    strategy.entry("Buy", strategy.long)

// Calculate the take profit and stop loss prices when a position is opened
entryPrice = na(strategy.opentrades.entry_price(0)) ? src : strategy.opentrades.entry_price(0)
takeProfitPrice = entryPrice * (1 + takeProfitPerc)
stopLossPrice = entryPrice * (1 - stopLossPerc)

// Take profit condition
takeProfitCondition = strategy.position_size > 0 and close >= takeProfitPrice

// Stop loss condition
stopLossCondition = strategy.position_size > 0 and close <= stopLossPrice

// Execute sell order when take profit condition is met within the backtesting range
if (takeProfitCondition and inBacktestRange)
    strategy.close("Buy", "Take Profit")

// Execute sell order when stop loss condition is met within the backtesting range
if (stopLossCondition and inBacktestRange)
    strategy.close("Buy", "Stop Loss")

// Plot the moving average and the bands
plot(ma, color=color.blue, title="Moving Average")
plot(upper_band, color=color.red, title="Upper Band (3 STD)")
plot(lower_band, color=color.green, title="Lower Band (3 STD)")

// Optional: Plot the source
plot(src, color=color.gray, title="Source")

// Add labels for clarity
bgcolor(buyCondition ? color.new(color.green, 90) : na, offset=-1, title="Buy Signal Background")

// Optional: Highlight the backtesting range on the chart
bgcolor(inBacktestRange ? color.new(color.blue, 90) : na, title="Backtest Range Background")

// Plot the take profit and stop loss levels if a position is open
plot(strategy.position_size > 0 ? takeProfitPrice : na, color=color.orange, title="Take Profit Level")
plot(strategy.position_size > 0 ? stopLossPrice : na, color=color.red, title="Stop Loss Level")
- アダプティブ・量子的取引戦略,ダブル・ムービング・平均クロスオーバーと,利益/ストップ・ロスを取る
- ダイナミック・トライル・ストップ ダブル・ターゲット・ムービング・平均・クロスオーバー戦略
- ダイナミックな利益/損失管理システムによる4期間のSMA突破取引戦略
- トレンド・ブレイク・トレーディング・システム (TBMA戦略)
- 調整可能なストップ・ロストとテイク・プロフィートを持つ二重移動平均クロスオーバー戦略
- ダイナミックストップ・ロストとテイク・プロフィートシステムによる戦略をフォローする二重移動平均クロスオーバートレンド
- RSI トレンド・モメント・トラッキング・ストラテジーによる移動平均のクロスオーバー
- ダイナミックなリスクマネジメントを伴う二重移動平均のクロスオーバー戦略
- トレンドフィルターと例外出口のスムーズな移動平均ストップ・ロスト&テイク・プロフィート戦略
- アダプティブ・ムービング・平均クロスオーバーとストップ・ロスのストラテジー
- 時間間隔統合戦略によるマルチEMAクロスオーバー
- 2つの移動平均のクロスオーバー確認戦略と量価格統合最適化モデル
- 二重動的指標の最適化戦略
- VWAPクロスオーバーダイナミック・プロフィート・ターゲットの取引戦略
- ボリンジャー・バンドス ブレイク量的な取引戦略
- フィボナッチ拡張とリトラセーションチャネルブレイクアウト戦略
- 多次元オーダーフロー分析と取引戦略
- 複数の移動平均値の傾向と逆転パターンの認識戦略
- 先進的な複合動向平均値と市場動向トレンド把握戦略
- 先進的なフィボナッチリトレースメントとボリューム重量化された価格アクション取引戦略
- ダイナミックポジション・ダブル・ムービング・メアワー・クロスオーバー戦略
- ATRとボリュームを組み合わせる戦略をフォローするダイナミック・シグナル・ライン・トレンド
- 多指標動的変動警告取引システム
- ダイナミック・トレンドフォロー・トレーディング・戦略
- VWAP-ATR トレンドフォローと価格逆転戦略
- Bollinger Bands RSI 市場中立量的な取引戦略
- 複数のレベルオーバーセール オシレーター 購入戦略
- アルファトレンドとKAMAをリスク管理と組み合わせた戦略の適応傾向
- 2つの指標 交差確認 勢い 量 取引戦略
- 動的動向を追求する戦略 - 多指標統合動力分析システム