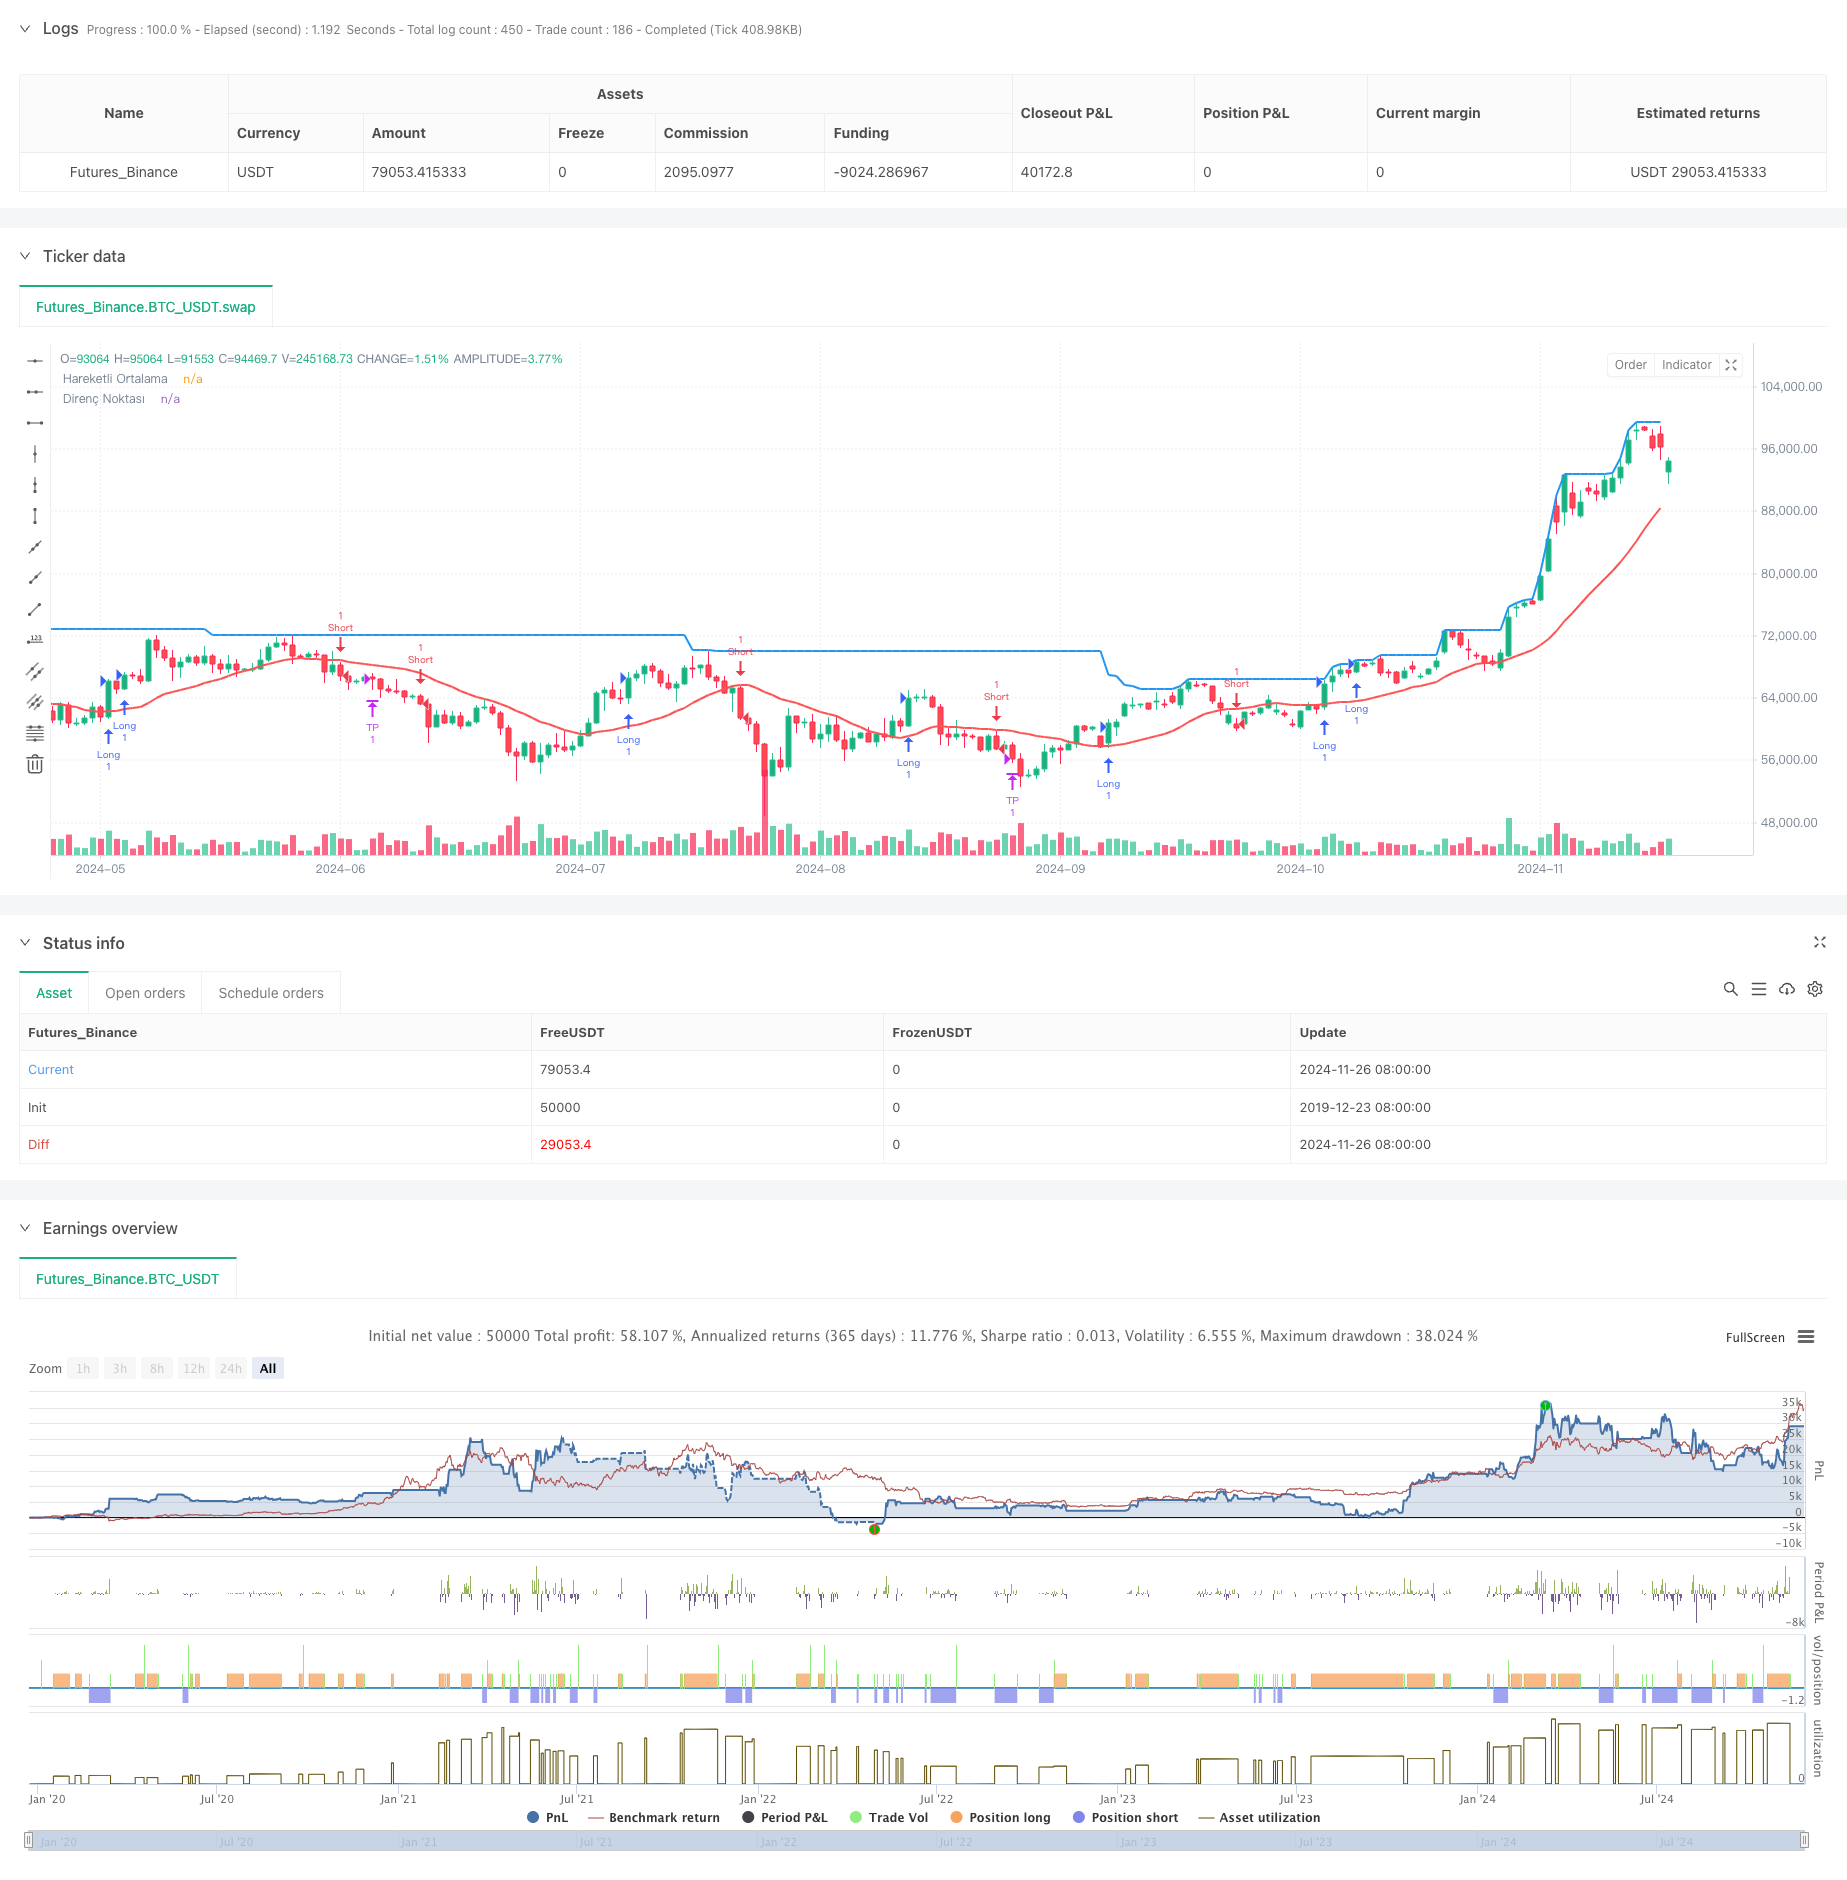
ダイナミックレジスタンスを持つ適応型FVG検出とMAトレンドトレーディング戦略
作者: リン・ハーンチャオチャン開催日:2024年11月29日 14:50:09タグ:FVGマルチSMCICTについて

概要
この戦略は,フェアバリューギャップ (FVG) の検出,移動平均トレンド決定,ダイナミックレジスタンスレベルを組み合わせた包括的な取引システムである.この戦略は,異なるタイムフレームにわたるFVG形成を特定し,移動平均トレンド方向を統合し,逆転信号に応じて取引を実行する.このシステムには,歴史的な高値に基づくダイナミックストップ損失と利益目標も含まれています.
戦略の原則
基本論理には次の主要な要素が含まれます.
- FVG検出: 指定された時間枠内で上昇値と下落値のフェア価値ギャップを特定する (デフォルトは1時間)
- トレンド決定: 20 期間の移動平均値を使用して市場傾向の方向性を評価する
- 逆転確認: キャンドルスタイクパターンを介して市場の逆転信号を評価します.
- ダイナミックレジスタンス:レジスタンスレベルと利益目標として最近の高値を使用します.
- リスク管理: 割合に基づくストップ損失保護を実施する
戦略 の 利点
- 多次元分析: 価格パターン,傾向,市場構造を組み合わせる
- 高い適応性: 異なる市場環境でパラメータを調整できます
- 管理されたリスク: 明確なストップ損失と利益目標
- ビジュアルサポート: FVG ゾーンと主要価格レベルをグラフィック表示
- コンプリート・ロジック: 入口,出口,リスク管理のための包括的なシステムを含む
戦略リスク
- タイムフレーム依存性: 異なるタイムフレームは矛盾する信号を生成する可能性があります
- 市場変動: 重度の変動が頻繁にストップ・ロスを引き起こす可能性があります.
- パラメータ感度: 戦略の性能はパラメータ設定に大きく依存する
- トレンド依存性: 変動する市場での業績が低下する可能性がある
- シグナル遅延: 移動平均値には固有の遅延がある.
戦略の最適化方向
- 変動調整を導入する: 市場の変動に基づいてストップ損失と利益目標を調整する
- フィルタリング条件を追加する: 確認のために容量または他の技術指標を含める
- タイムフレームを最適化する: 効果性のために異なるタイムフレームの組み合わせをテストする
- トレンド決定を改善する:複数の移動平均値または他のトレンド指標を使用する
- 逆転確認を強化する: パターン認識の追加の方法を組み込む
概要
この戦略は,複数の取引コンセプトを統合し,FVG,トレンド,価格パターンの組み合わせを通じて高い確率の取引機会を探している包括的な戦略である.この戦略の強みは,体系的なアプローチとリスク管理にあるが,パラメータ最適化と市場環境適応性に注意を払う必要がある.提案された最適化方向性を通じて,戦略のさらなる改善に余地がある.
/*backtest
start: 2019-12-23 08:00:00
end: 2024-11-27 08:00:00
period: 1d
basePeriod: 1d
exchanges: [{"eid":"Futures_Binance","currency":"BTC_USDT"}]
*/

//@version=5
strategy("SMC FVG Entry Strategy with Retest", overlay=true)

// Parametreler
stopLossPercent = input(2, title="Stop Loss (%)") / 100
lookbackPeriod = input(50, title="Güçlü Direnç İçin Geriye Dönük Süre")
fvgLength = input.timeframe("60", title="FVG Zaman Dilimi")  // 1 saatlik zaman dilimi
maPeriod = input(20, title="MA Dönemi")  // Trend yönü için MA dönemi

// FVG'leri Hesapla
var float fvgLow = na
var float fvgHigh = na
var bool fvgFilled = false

// Seçilen zaman diliminde FVG'leri kontrol et
if (ta.change(time(fvgLength)))
    bull_fvg = low > high[2] and close[1] > high[2]
    bear_fvg = high < low[2] and close[1] < low[2]

    if (bull_fvg)
        fvgLow := low[2]
        fvgHigh := high
        fvgFilled := true
    else if (bear_fvg)
        fvgLow := low
        fvgHigh := high[2]
        fvgFilled := true

// Trend Yönü Kontrolü (MA kullanarak)
ma = ta.sma(close, maPeriod)
trendUp = close > ma
trendDown = close < ma

// Dönüş Mumu Kontrolü
bullishReversal = close > open and close[1] < open[1] and fvgFilled and close > fvgHigh
bearishReversal = close < open and close[1] > open[1] and fvgFilled and close < fvgLow

// İlk güçlü direnç noktası
resistanceLevel = ta.highest(high, lookbackPeriod)

// Giriş Koşulları
if (bullishReversal and trendUp)
    entryPrice = close
    stopLoss = entryPrice * (1 - stopLossPercent)
    takeProfit = resistanceLevel
    strategy.entry("Long", strategy.long)
    strategy.exit("TP", "Long", limit=takeProfit, stop=stopLoss)

if (bearishReversal and trendDown)
    entryPrice = close
    stopLoss = entryPrice * (1 + stopLossPercent)
    takeProfit = resistanceLevel
    strategy.entry("Short", strategy.short)
    strategy.exit("TP", "Short", limit=takeProfit, stop=stopLoss)

// FVG'leri Grafik Üzerinde Göster
// if (fvgFilled)
//     var box fvgBox = na
//     if (na(fvgBox))
//         fvgBox := box.new(left=bar_index[1], top=fvgHigh, bottom=fvgLow, right=bar_index, bgcolor=color.new(color.green, 90), border_color=color.green)
//     else
//         box.set_top(fvgBox, fvgHigh)
//         box.set_bottom(fvgBox, fvgLow)
//         box.set_left(fvgBox, bar_index[1])
//         box.set_right(fvgBox, bar_index)

// Direnç Noktasını Göster
plot(resistanceLevel, color=color.blue, title="Direnç Noktası", linewidth=2)
plot(ma, color=color.red, title="Hareketli Ortalama", linewidth=2)
関連性
- MA,SMA,MA傾斜,ストップ損失を後押しし,再入力
- トレンド構造とオーダーブロックとフェア・バリュー・ギャップ戦略との断絶
- インテリジェント・インスティチュチュショナル・トレーディング・ストラクチャー モメント・ストラテジー
- FVGのモメンタム・スカルピング戦略
- クラウドベースのボリンガー帯 双動平均量的な傾向戦略
- ダイナミックストップ・ロスの戦略を持つ連続的なキャンドルベースのダイナミックグリッドアダプティブ移動平均
- 動向平均のクロスオーバー戦略は,二重動向平均に基づいている
- SMAの二重移動平均取引戦略
- MAのクロス戦略
- EMAフィルターによるクロスマーケット・オナイトポジション戦略
もっと
- ポジションスケーリングを含む多期間のRSI-EMAモメンタム取引戦略
- マルチMAトレンドはRSIモメント戦略をフォローする
- 複数のレベルフィボナッチ EMA トレンド フォローする戦略
- トレンドフォロー・ギャップ・ブレークアウト・トレーディング・システムとSMAフィルター
- リスクマネジメントとタイムフィルタリングシステムによる戦略をフォローする二重EMAクロスオーバー傾向
- 2倍平滑動平均傾向 戦略を踏まえて - 修正されたハイキン・アシに基づいた
- MACD 多インターバルダイナミックストップ・ロスト・アンド・テイク・プロフィート・トレーディング・システム
- ストカスティックRSIとキャンドルスティック確認の動的取引システム
- ATRベースのリスク管理システムによる戦略をフォローする二重移動平均傾向
- マルチテクニカル指標動的適応取引戦略 (MTDAT)
- 多周波モメント逆転量的な戦略システム
- 自動化量的な取引システムと二重EMAクロスオーバーとリスク管理
- ダイナミックな二重SMAトレンド 賢明なリスク管理の戦略に従う
- KNN ベースの適応パラメトリック傾向 戦略をフォローする
- EMA波動帯に基づく取引システムによる多期トレンド
- 復習システム ランダム行情生成器
- 多期EMA横断高利率トレンド 戦略をフォローする (高度)
- アダプティブ・レンジ・ボラティリティー・トレンド 取引戦略をフォローする
- リスク・リターン比最適化戦略を持つトレーディングシステムに従う二重移動平均傾向
- 移動平均クロスオーバーとキャンドルスティックパターンのスマートタイム戦略