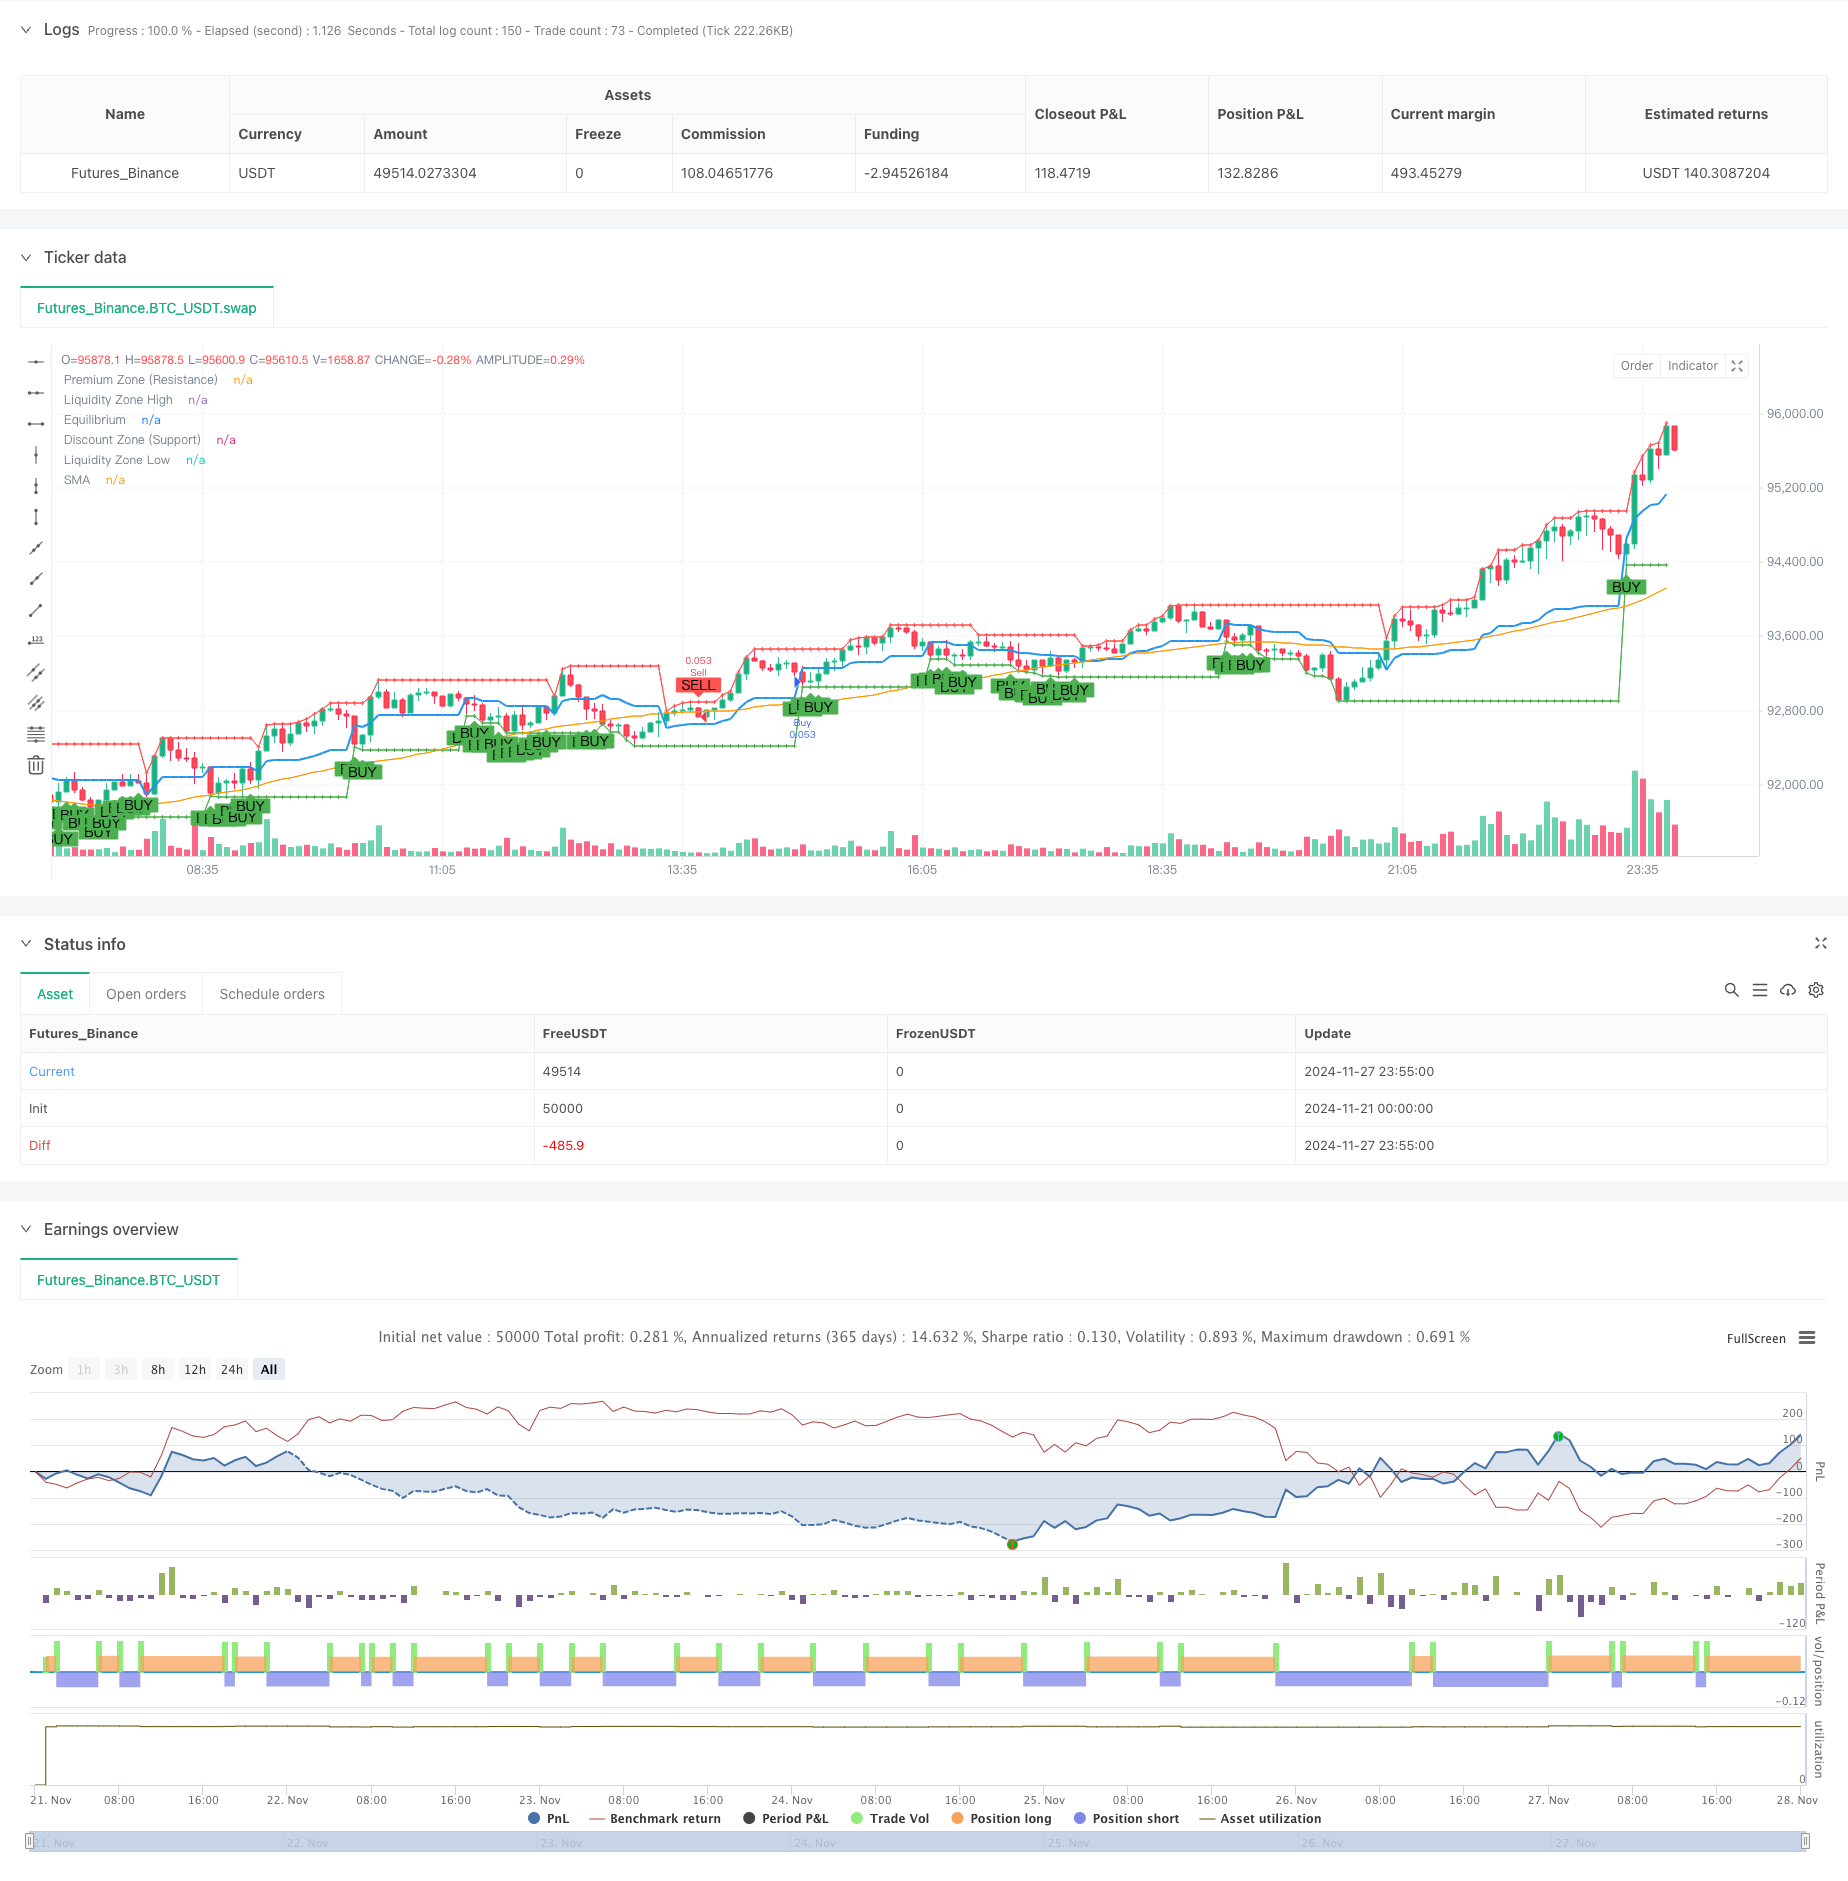
複数のゾーンSMC理論に基づいた 戦略をフォローするインテリジェントトレンド
作者: リン・ハーンチャオチャン開催日:2024年11月29日 15:38:01タグ:SMASMCOBEQ

概要
この戦略は,スマートマネーコンセプト (SMC) 理論に基づい,市場を3つの主要価格ゾーンに区切ることで,取引システムに続く包括的なトレンドを構築する.均衡,プレミアム,割引.それは50期間のシンプルムービング・平均値 (SMA) とオーダーブロック分析を組み合わせ,異なるゾーン間の価格動きを通じて取引機会を特定する.
戦略の原則
基本的な論理にはいくつかの重要な要素が含まれます.
- 最後の8個のキャンドルからスイング・ハイとローを計算して市場範囲を決定します
- バランスゾーンをスイング高と低の中間点として定義し,上にはプレミアムゾーン,下にはディスカウントゾーンです.
- 50 期間の SMA を使って,全体的なトレンド方向を決定します. SMA 以上の上昇,下の低下.
- 価格がSMAより上にある場合,ディスカウントゾーンで購入信号を生成し,価格がSMAより下にある場合,プレミアムゾーンで販売信号を生成する.
- 20個のキャンドル内の最高値と最低値を分析して,取引信号を確認することで,オーダーブロックを識別します.
- 変動する高値と低値を 流動性ゾーンとしてマークし 価格の潜在的逆転点を予測します
戦略 の 利点
- 市場段階の明確な識別を提供する構造化されたゾーン分割方法.
- ゾーン,トレンド,オーダーブロックの三重検証による複数の信号確認メカニズム
- 市場の変化に動的に適応し,リアルタイムで主要な価格レベルを更新する.
- ストップ・ロストとポジション管理を含む包括的なリスク管理システム
- クリーンで効率的なコード実装 維持し最適化が簡単です
戦略リスク
- 不安定な市場における潜在的な誤ったブレイクシグナル
- 過去のデータに依存しているため 市場が急激に逆転する指標が遅れている.
- 固定期間の移動平均は,すべての市場環境に適合しない可能性があります.
- リスク管理のために適切なストップ・ロスの設定が必要です. 推奨されるリスク管理対策:
- 異なる市場状況に合わせて動的パラメータ調整
- 変動性フィルターを追加する
- 厳格なマネーマネジメント規則の実施
- 定期的なバックテストとパラメータ最適化
オプティマイゼーションの方向性
- 適応パラメータを入力します:
- 市場変動に基づいて,ゾーンの範囲を動的に調整する
- 適応期間の移動平均を導入する
- 強化された信号フィルタリング
- 音量確認メカニズムを追加する
- 動力指標を組み込む
- リスク管理を改善する
- ダイナミックストップ・ロスのメカニズムを導入する
- 位置サイズアルゴリズムを最適化
- 実行効率を向上させる
- 資源消費を減らすために計算論理を最適化
- 信号生成メカニズムを改良し,より迅速な応答を図る
概要
この戦略は,インテリジェント・ゾーン・ディビジョンと複数の信号確認メカニズムを通じて,強力なトレンドフォローシステムを構築している.その核心強みは,明確な市場構造分析と包括的なリスク管理にある.継続的な最適化と改善を通じて,この戦略は,さまざまな市場条件にわたって安定したパフォーマンスを約束している.トレーダーは,特定の市場特性に基づいてパラメータを調整し,ライブ・トレーディングで戦略を実施する際に厳格なリスク管理を維持することをお勧めする.
/*backtest
start: 2024-11-21 00:00:00
end: 2024-11-28 00:00:00
period: 5m
basePeriod: 5m
exchanges: [{"eid":"Futures_Binance","currency":"BTC_USDT"}]
*/

//@version=5
//@version=5
strategy("SMC Strategy with Premium, Equilibrium, and Discount Zones", overlay=true, default_qty_type=strategy.percent_of_equity, default_qty_value=10)

// === Instellingen voor Swing High en Swing Low ===
swingHighLength = input.int(8, title="Swing High Length")
swingLowLength = input.int(8, title="Swing Low Length")

// Vind de recente swing highs en lows
var float swingHigh = na
var float swingLow = na

if (ta.highestbars(high, swingHighLength) == 0)
    swingHigh := high

if (ta.lowestbars(low, swingLowLength) == 0)
    swingLow := low

// Bereken Equilibrium, Premium en Discount Zones
equilibrium = (swingHigh + swingLow) / 2
premiumZone = swingHigh
discountZone = swingLow

// Plot de zones op de grafiek
plot(equilibrium, title="Equilibrium", color=color.blue, linewidth=2)
plot(premiumZone, title="Premium Zone (Resistance)", color=color.red, linewidth=1)
plot(discountZone, title="Discount Zone (Support)", color=color.green, linewidth=1)

// === Simple Moving Average om trendrichting te bepalen ===
smaLength = input.int(50, title="SMA Length")
sma = ta.sma(close, smaLength)
plot(sma, title="SMA", color=color.orange)

// === Entry- en Exitregels op basis van zones en trendrichting ===

// Koop- en verkoopsignalen
buySignal = close < equilibrium and close > discountZone and close > sma // Prijs in discount zone en boven SMA
sellSignal = close > equilibrium and close < premiumZone and close < sma // Prijs in premium zone en onder SMA

// Order Blocks (Eenvoudig: hoogste en laagste kaars binnen de laatste 20 kaarsen)
orderBlockLength = input.int(20, title="Order Block Length")
orderBlockHigh = ta.highest(high, orderBlockLength)
orderBlockLow = ta.lowest(low, orderBlockLength)

// Koop- en verkoopsignalen met order block bevestiging
buySignalOB = buySignal and close >= orderBlockLow // Koop in discount zone met ondersteuning van order block
sellSignalOB = sellSignal and close <= orderBlockHigh // Verkoop in premium zone met weerstand van order block

// === Uitvoeren van Trades ===
if (buySignalOB)
    strategy.entry("Buy", strategy.long)

if (sellSignalOB)
    strategy.entry("Sell", strategy.short)

// === Plots voor visuele feedback ===
plotshape(buySignalOB, title="Buy Signal", location=location.belowbar, color=color.green, style=shape.labelup, text="BUY")
plotshape(sellSignalOB, title="Sell Signal", location=location.abovebar, color=color.red, style=shape.labeldown, text="SELL")

// === Liquiditeitsjachten aangeven ===
// Simpel: markeer recente swing highs en lows als liquiditeitszones
liquidityZoneHigh = ta.valuewhen(high == swingHigh, high, 0)
liquidityZoneLow = ta.valuewhen(low == swingLow, low, 0)

// Markeer liquiditeitszones
plot(liquidityZoneHigh, title="Liquidity Zone High", color=color.red, linewidth=1, style=plot.style_cross)
plot(liquidityZoneLow, title="Liquidity Zone Low", color=color.green, linewidth=1, style=plot.style_cross)
関連性
- 多期トレンドフォローとオーダーブロック量的な取引戦略
- SMAトレンド
- MAHLバンド
- 線形回帰傾斜に基づく動的市場体制の特定戦略
- SMAクロスオーバーとボリュームフィルタを搭載した適応型ダイナミックストップ・ロストとテイク・プロフィート戦略
- 2つのタイムフレームモメント戦略
- 価格とボリュームブレイク購入戦略
- ダイナミック・プロフィット・ロック (Dynamic Profit Lock) の量的な取引戦略を持つマルチ-SMAゾーンブレイク
- モボバンド
- 信号によるZスコア
もっと
- ダイナミックなリスクマネジメントと固定得益を備えた高度なフェアバリューギャップ検出戦略
- ストップ・ロスの最適化モデルによるダイナミックRSIオーバーセール リバウンド・トレーディング戦略
- ダイナミックATRストップ・ロスのRSI 過売度リバウンド量的な戦略
- ATR波動性フィルターシステムによる高度な二重EMA戦略
- 双 EMA ダイナミックゾーン トレンド フォローする戦略
- RSI ダイナミック・トラッキング・ストップ・ロスの量的な取引戦略
- 双 EMA トレンド モメンタム 取引戦略
- 多トレンドモメンタムクロスオーバー戦略と波動性最適化システム
- 多指標トレンドブレイク量的な取引戦略
- モメント インディケーター オシレーション
値 強化 トレーディング 戦略 - RSIとEMAを組み合わせた多期量的なダイナミック取引戦略
- 多次元技術指標の動向は定量的な戦略に従った
- 2つの移動平均交差調整パラメータ取引戦略
- 複数のトレンドをフォローし,構造を突破する戦略
- TRAMA 双動平均 クロスオーバー インテリジェント量的な取引戦略
- ポジションスケーリングを含む多期間のRSI-EMAモメンタム取引戦略
- マルチMAトレンドはRSIモメント戦略をフォローする
- 複数のレベルフィボナッチ EMA トレンド フォローする戦略
- トレンドフォロー・ギャップ・ブレークアウト・トレーディング・システムとSMAフィルター
- リスクマネジメントとタイムフィルタリングシステムによる戦略をフォローする二重EMAクロスオーバー傾向