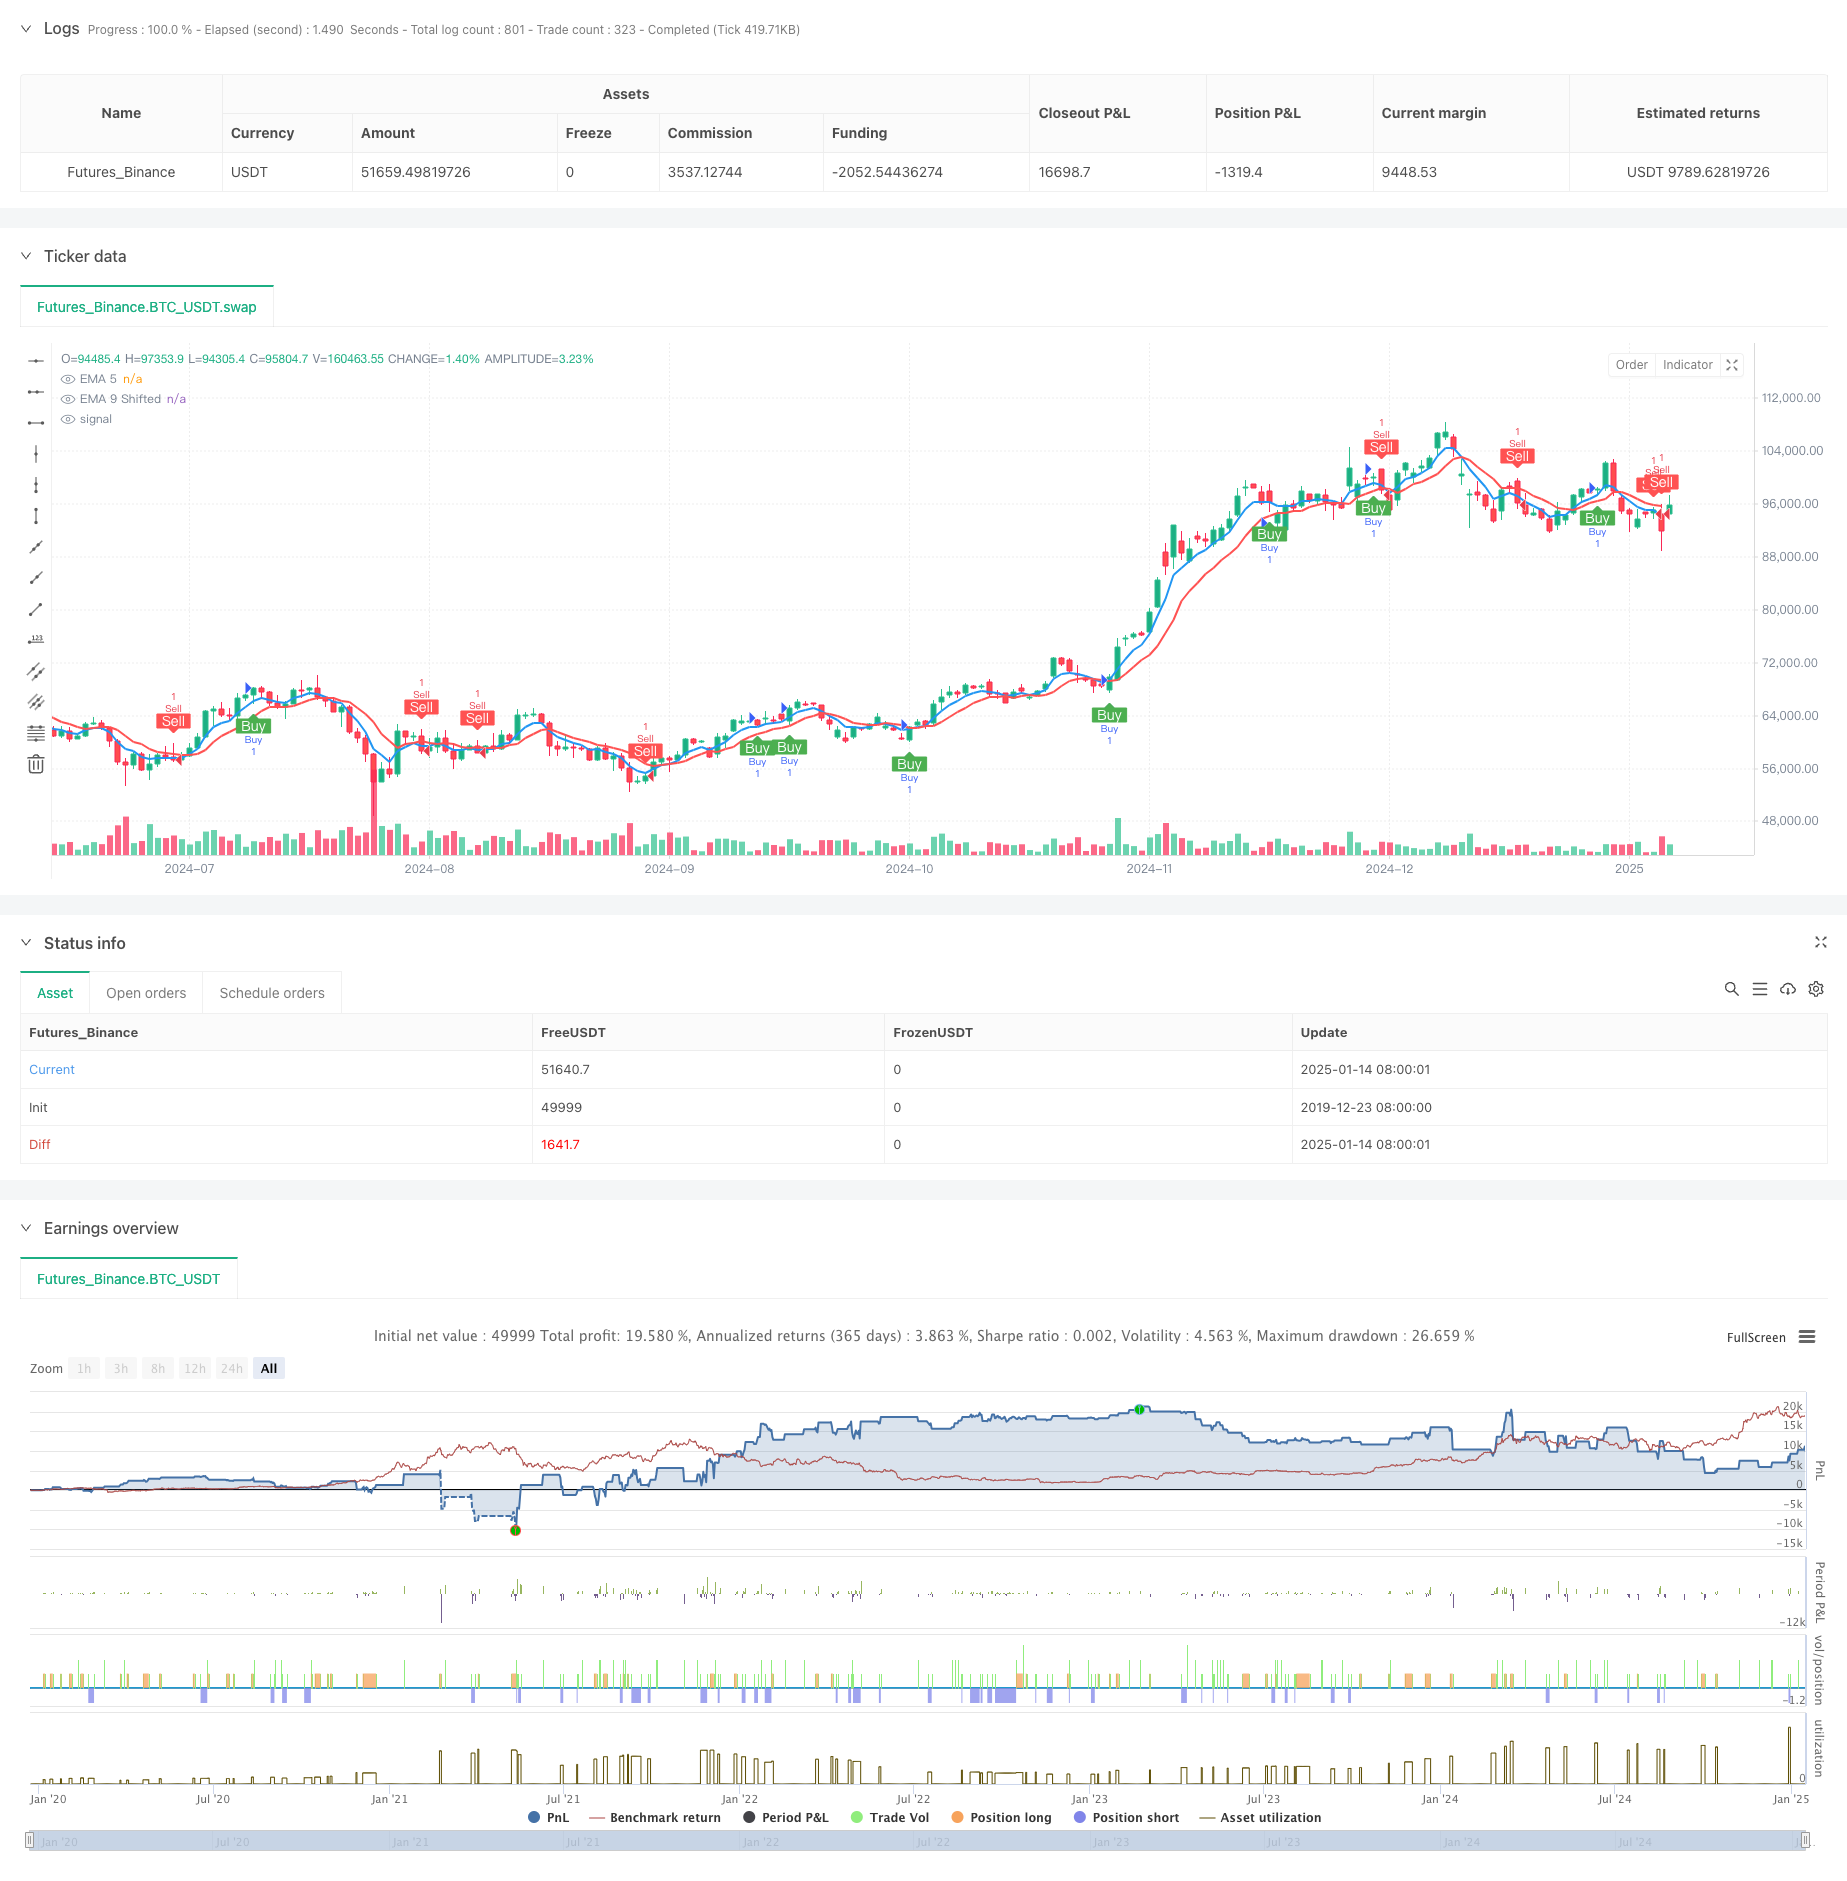
移動平均値とバー外パターンに基づく二重トレンド確認取引戦略
作者: リン・ハーンチャオチャン, 日付: 2025-01-17 14:39:19タグ:エイマ

概要
この戦略は,移動平均値とアウトサイドバーパターン認識を組み合わせたトレンドフォローシステムである. 5 期と 9 期指数関数移動平均値 (EMA) を主要なトレンド指標として利用し,信号確認のためのアウトサイドバーパターンも使用している.この戦略には,アウトサイドバーの高さに基づいて動的なストップ・ロストとテイク・プロフィート設定,およびストップ・ロストヒットによって引き起こすポジション逆転メカニズムが含まれている.
戦略の原則
基本的な論理は次の主要な要素に基づいています 1. 5 期間の EMA と 9 期間の EMA のクロスオーバー を用いて,基本的トレンド方向を決定する 2. 市場波動性を外部バーパターン (現在のバーは前回のバーより高く,前回のバーより低く) で確認する 3. EMAのクロスオーバー信号とOutside Barパターンが一致するときに取引を行う 4. 外部バーの高さを利用して,動的にストップ・ロストとテイク・プロフィートのレベルを設定し,テイク・プロフィートの50%とストップ・ロストの100%を設定する 5. トレンド逆転の可能性を把握するためにストップロスが起動すると,自動的にリバースポジションを実行する.
戦略 の 利点
- 双重確認メカニズムは,単一の指標からの誤った信号を回避することで,取引の正確性を向上させる.
- ダイナミックストップ・ロースとテイク・プロフィートの設定は,異なる市場条件において合理的なリスク管理を維持し,市場の変動により適性
- 市場動向の変化に迅速に適応し,資本効率を向上させる
- 戦略には明瞭な入出ルールがあり,実行とバックテストを容易にする
戦略リスク
- 波動性が低い市場では,バー外パターンが少なく発生し,取引頻度に影響を与える可能性があります.
- ストップ・ロスのポジションは,急激に変動する市場では,あまりにも幅広く,取引ごとにリスクが増加する可能性があります.
- ポジション逆転メカニズムは,様々な市場で連続した損失を引き起こす可能性があります.
- 固定EMAパラメータは,異なる市場条件で不一致なパフォーマンスを発揮することがあります.
オプティマイゼーションの方向性
- リスク管理を柔軟にするため,ストップ・ロースとテイク・プロフィートの比率を動的に調整するための変動指標を導入する
- 傾向強度フィルターを追加することで,弱いトレンド環境での取引を避ける
- 市場変動指標を組み込むことで,ポジション逆転を誘発する条件を最適化する
- 研究 EMA パラメータの最適化 システム適応性を向上させる
概要
これは古典的な技術分析と近代的な定量的な取引概念を組み合わせた戦略システムである.移動平均値とアウトサイドバーパターンの組み合わせは,タイミングの高いトレンドフォローと信頼性の高い信号生成の両方を保証する.動的なストップ・ロスト/テイク・プロフィートおよびポジション逆転メカニズムの設計は,リスク管理に強い焦点を当て,戦略を実践的に実行可能にしている.最適化余地がある一方で,全体的な枠組みは既にライブ取引のための基本条件を満たしている.
/*backtest
start: 2019-12-23 08:00:00
end: 2025-01-15 08:00:00
period: 1d
basePeriod: 1d
exchanges: [{"eid":"Futures_Binance","currency":"BTC_USDT","balance":49999}]
*/

//@version=5
strategy(title="Outside Bar EMA Crossover Strategy with EMA Shift", shorttitle="Outside Bar EMA Cross", overlay=true)

// Input for EMA lengths
lenEMA1 = input.int(5, title="EMA 5 Length")
lenEMA2 = input.int(9, title="EMA 9 Length")

// Input for EMA 9 shift
emaShift = input.int(1, title="EMA 9 Shift", minval=0)

// Calculate EMAs
ema1 = ta.ema(close, lenEMA1)
ema2 = ta.ema(close, lenEMA2)

// Apply shift to EMA 9
ema2Shifted = na(ema2[emaShift]) ? na : ema2[emaShift]  // Dịch chuyển EMA 9 bằng cách sử dụng offset

// Plot EMAs
plot(ema1, title="EMA 5", color=color.blue, linewidth=2)
plot(ema2Shifted, title="EMA 9 Shifted", color=color.red, linewidth=2)

// Outside Bar condition
outsideBar() => high > high[1] and low < low[1]

// Cross above EMA 5 and EMA 9 (shifted)
crossAboveEMA = close > ema1 and close > ema2Shifted

// Cross below EMA 5 and EMA 9 (shifted)
crossBelowEMA = close < ema1 and close < ema2Shifted

// Outside Bar cross above EMA 5 and EMA 9 (shifted)
outsideBarCrossAbove = outsideBar() and crossAboveEMA

// Outside Bar cross below EMA 5 and EMA 9 (shifted)
outsideBarCrossBelow = outsideBar() and crossBelowEMA

// Plot shapes for visual signals
plotshape(series=outsideBarCrossAbove, title="Outside Bar Cross Above", location=location.belowbar, color=color.green, style=shape.labelup, text="Buy", textcolor=color.white)
plotshape(series=outsideBarCrossBelow, title="Outside Bar Cross Below", location=location.abovebar, color=color.red, style=shape.labeldown, text="Sell", textcolor=color.white)

// Calculate Outside Bar height
outsideBarHeight = high - low  // Chiều cao của nến Outside Bar

// Calculate TP and SL levels
tpRatio = 0.5  // TP = 50% chiều cao nến Outside Bar
slRatio = 1.0  // SL = 100% chiều cao nến Outside Bar

tpLevelLong = close + outsideBarHeight * tpRatio  // TP cho lệnh mua
slLevelLong = close - outsideBarHeight * slRatio  // SL cho lệnh mua

tpLevelShort = close - outsideBarHeight * tpRatio  // TP cho lệnh bán
slLevelShort = close + outsideBarHeight * slRatio  // SL cho lệnh bán

// Strategy logic
if (outsideBarCrossAbove)
    strategy.entry("Buy", strategy.long)
    strategy.exit("Take Profit/Stop Loss", "Buy", stop=slLevelLong, limit=tpLevelLong)  // Thêm TP và SL

if (outsideBarCrossBelow)
    strategy.entry("Sell", strategy.short)
    strategy.exit("Take Profit/Stop Loss", "Sell", stop=slLevelShort, limit=tpLevelShort)  // Thêm TP và SL

// Logic: Nếu lệnh Buy bị Stop Loss => Vào lệnh Sell
if (strategy.position_size > 0 and close <= slLevelLong)
    strategy.close("Buy")
    strategy.entry("Sell After Buy SL", strategy.short)

// Logic: Nếu lệnh Sell bị Stop Loss => Vào lệnh Buy
if (strategy.position_size < 0 and close >= slLevelShort)
    strategy.close("Sell")
    strategy.entry("Buy After Sell SL", strategy.long)

// Cảnh báo khi label Buy xuất hiện
alertcondition(condition=outsideBarCrossAbove, title="Label Buy Xuất Hiện", message="Label Buy xuất hiện tại giá: {{close}}")

// Cảnh báo khi label Sell xuất hiện
alertcondition(condition=outsideBarCrossBelow, title="Label Sell Xuất Hiện", message="Label Sell xuất hiện tại giá: {{close}}")
関連性
- ATRベースの動的停止管理戦略による多次元傾向分析
- 先進的な多指標トレンド確認取引戦略
- アダプティブ・トレンドフォローとマルチコンフィレーション・トレーディング・戦略
- 日中取引戦略を最適化するために,RSIモメントインジケーターと組み合わせたダイナミックEMAシステム
- 戦略をフォローするマルチテクニカルインジケータークロスオーバーモメントトレンド
- EMAトレンドと丸数ブレークアウト取引戦略
- 動的RSI 多重移動平均クロスオーバーの量的な取引戦略
- 動的トレンドRSI指標の横断戦略
- 双重クロスオーバートレンド フォローする戦略: EMAとMACDシネージティック・トレーディング・システム
- 先進的な多指標多次元トレンドクロス定量戦略
- 複数の確認を伴う戦略に従う多面滑らかな移動平均動的クロスオーバー傾向
もっと
- 機械学習 適応型スーパートレンド 定量的な取引戦略
- ダイナミック・ウェーブ・トレンドとフィボナッチ統合量的な取引戦略
- トレーディング戦略をフォローする波動性停止ベースのEMAトレンド
- ダイナミック・ボラティリティ・フィルターによるマルチ-EMAトレンドフォロー戦略
- 多指標量的な取引戦略をフォローする三重EMA傾向
- 年末トレンド モメンタム・トレード・ストラテジーの後 ((60日間のMAブレイク)
- RSI 過剰購入/過剰売却量的な取引戦略の多指標トレンド
- 効率的な価格チャネル取引戦略 15分ブレイクベース
- 過去のバックテストを伴う多時間枠のフェア・バリュー・ギャップ・ブレイクアウト戦略
- QQEの動的傾向 リスク管理量的な取引戦略
- スーパートレンドの三重強化戦略に続くダイナミックな傾向
- RSI ダイナミック・ブレイクアウト・リトレースメント・トレーディング・ストラテジー
- オプティマイズされた二重T3トレンド追跡戦略
- 多条件ドンチアンチャネルモメンタムブレイク戦略
- 多期技術指標 ダイナミック取引システム戦略
- 動的サポート抵抗とボリンガー帯 多指標クロス戦略
- 多次元 イチモク・クラウド 価格突破 トレンド確認 トレーディング戦略
- ダイナミック・ニューラル・RSI トレンドフォロー・トレーディング・戦略
- 定量的な取引戦略をフォローするマルチEMAクロスオーバー傾向
- RSIを重複する多レベル指標の取引戦略